Abstract
This is a registry report from the Australia and New Zealand Islet and Pancreas Transplant Registry. We report data for all solid organ pancreas transplant activity from inception in 1984 to end of 2016. Data analysis was performed using Stata Software version 14 (StataCorp, College Station, Tex). From 1984 to 2016 a total of 756 solid organ pancreas transplants have been performed in Australia and New Zealand, in 738 individuals. In 2016, 55 people received a pancreas transplant. These transplants were performed in Auckland (4), Monash (22), and Westmead (29). In 2016, 50 transplants were simultaneous pancreas kidney, 4 were pancreas after kidney, and 1 was a pancreas transplant alone.
PART 1. WAITING LIST
Overview of Waiting List Activity
Definitions
Patients join the waiting list on the date they are referred to the transplanting center; however, this may occur some time before their kidneys fail. Patients are therefore classified as “under consideration” until they medically require a kidney-pancreas transplant. Once they require a kidney-pancreas transplant, they are classified as “active” on the list while they remain medically fit. The “under consideration” classification also captures people recently referred to the transplant center, who are still undergoing assessment about their medical fitness for pancreas transplant. People referred to a transplanting center when they are already on dialysis become “active” on the list as soon as they are accepted as medically fit. People referred to a transplanting center when their kidneys still function become active once their kidney disease progresses to such a level that dialysis is planned soon. Once active on the waiting list, patients are transplanted in order of their waiting time, by blood group.
Patient Waiting List Flow
The patient waiting list activity in the past 3 years for Australia (Westmead and Monash units) and New Zealand are shown in Tables 1 and 2, respectively. In Australia, although the number of transplants has increased over the past 3 years, the number of patients on the active waiting list has continued to increase.
TABLE 1.
Waiting list activity in Australiaa for the last 3 years
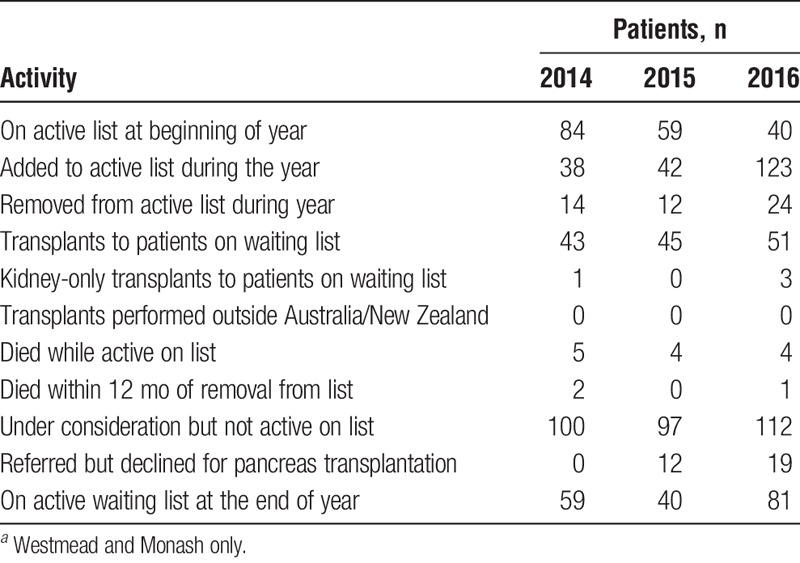
TABLE 2.
Waiting list activity in New Zealand for the past 3 years

Distribution of Active Patients by State
Figure 1 and Tables 3 and 4 show the state of residence of people active on the pancreas waiting list, by the pancreas transplanting center they were referred to (Australia only). For New Zealand data, there is no breakdown beyond that seen in Table 2.
FIGURE 1.
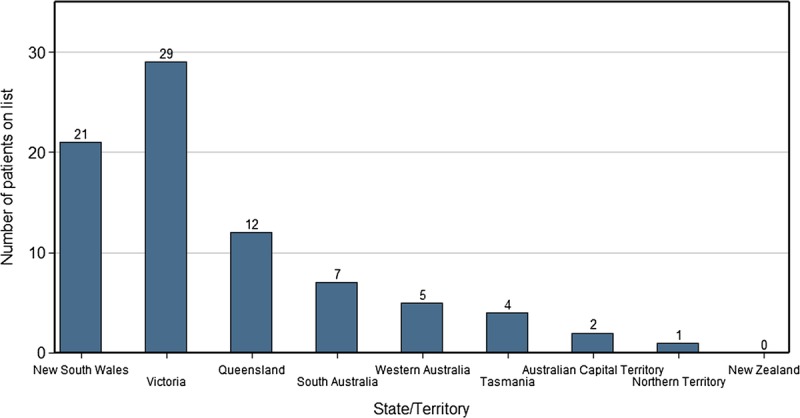
Distribution of people active on the waiting list by state/territory of residence, as of December 2015.
TABLE 3.
Patient state of residence for people active on the list at Westmead national pancreas transplant unit (New South Wales), December 2016

TABLE 4.
Patient state of residence for people active on the list at Monash pancreas transplant unit (Victoria), December 2016

Tables 5 and 6 show the state of residence of people who are under consideration together with people who are active on the pancreas waiting list, by the pancreas transplanting center they were referred to, in Australia. For New Zealand data, there is no breakdown beyond that seen in Table 2.
TABLE 5.
State of residence for people under consideration and for people active on the list at Westmead national pancreas transplant unit (New South Wales), December 2016

TABLE 6.
State of residence for people under consideration and for people active on the list at Monash pancreas transplant unit (Victoria), December 2016

New Referrals Received Over Time
Tables 7, 8, and 9 show the distribution of new referrals received by the transplanting units over time.
TABLE 7.
New referrals received by Westmead national pancreas unit (New South Wales)

TABLE 8.
New referrals received by Monash pancreas transplant unit (Victoria)

TABLE 9.
New referrals received by Auckland national pancreas transplant unit (New Zealand)

Patient Characteristics for Those Active on the List in 2016
Figures 2 and 3 illustrate the distribution of other characteristics of those active on the waiting list in 2016, including the distribution of blood groups and patient ages.
FIGURE 2.
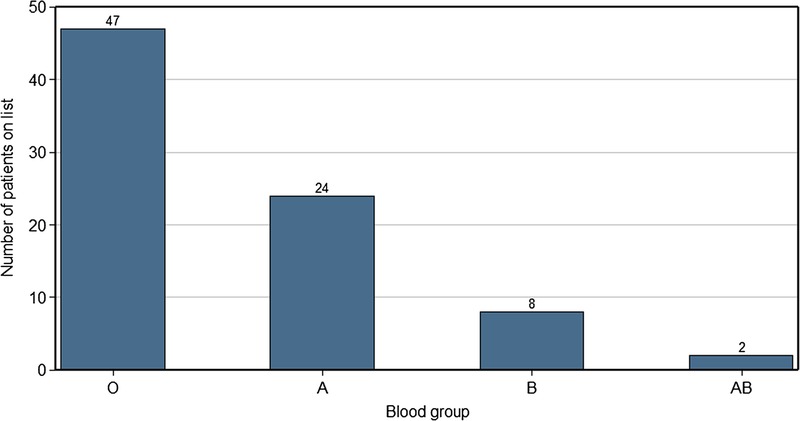
Distribution of people active on the list by their blood group, as of December 2015.
FIGURE 3.
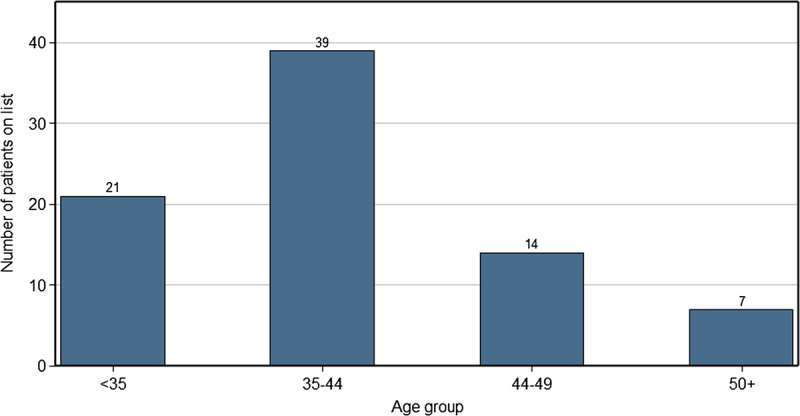
Distribution of people active on the list by their age, as of December 2015.
PART 2. PANCREAS TRANSPLANT RECIPIENTS
Pancreas Transplant Incidence
A total of 756 solid organ pancreas transplants have been performed in Australia and New Zealand (ANZ) from 1984 to 2016. Transplants have been performed in Westmead (479), Monash (221), Auckland (52), Royal Prince Alfred (1), Royal Melbourne Hospital (1), Queen Elizabeth Hospital (1), and Prince Henry (1). Figure 4 shows pancreas transplants over time. The number of transplants has substantially increased in past decade compared with previous years.
FIGURE 4.
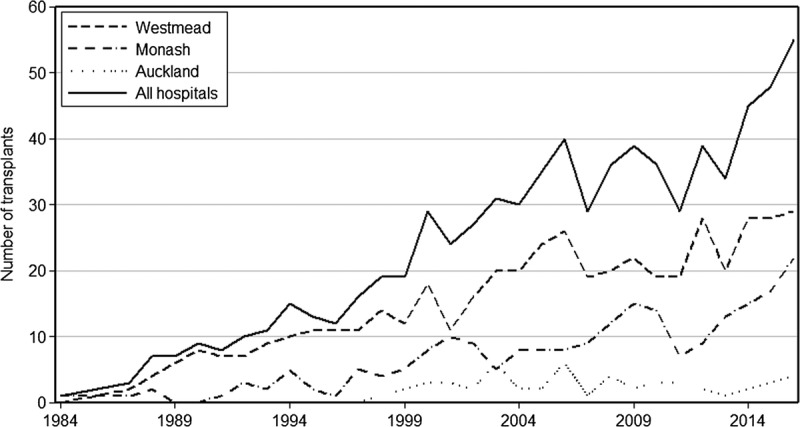
Incidence of pancreas transplants over time, 1984 to 2016.
In 2016, 55 people received a pancreas transplant; these transplants were performed in Auckland (4), Monash (22), and Westmead (29). The number of transplants in 2016 increased by 15% compared with 2015.
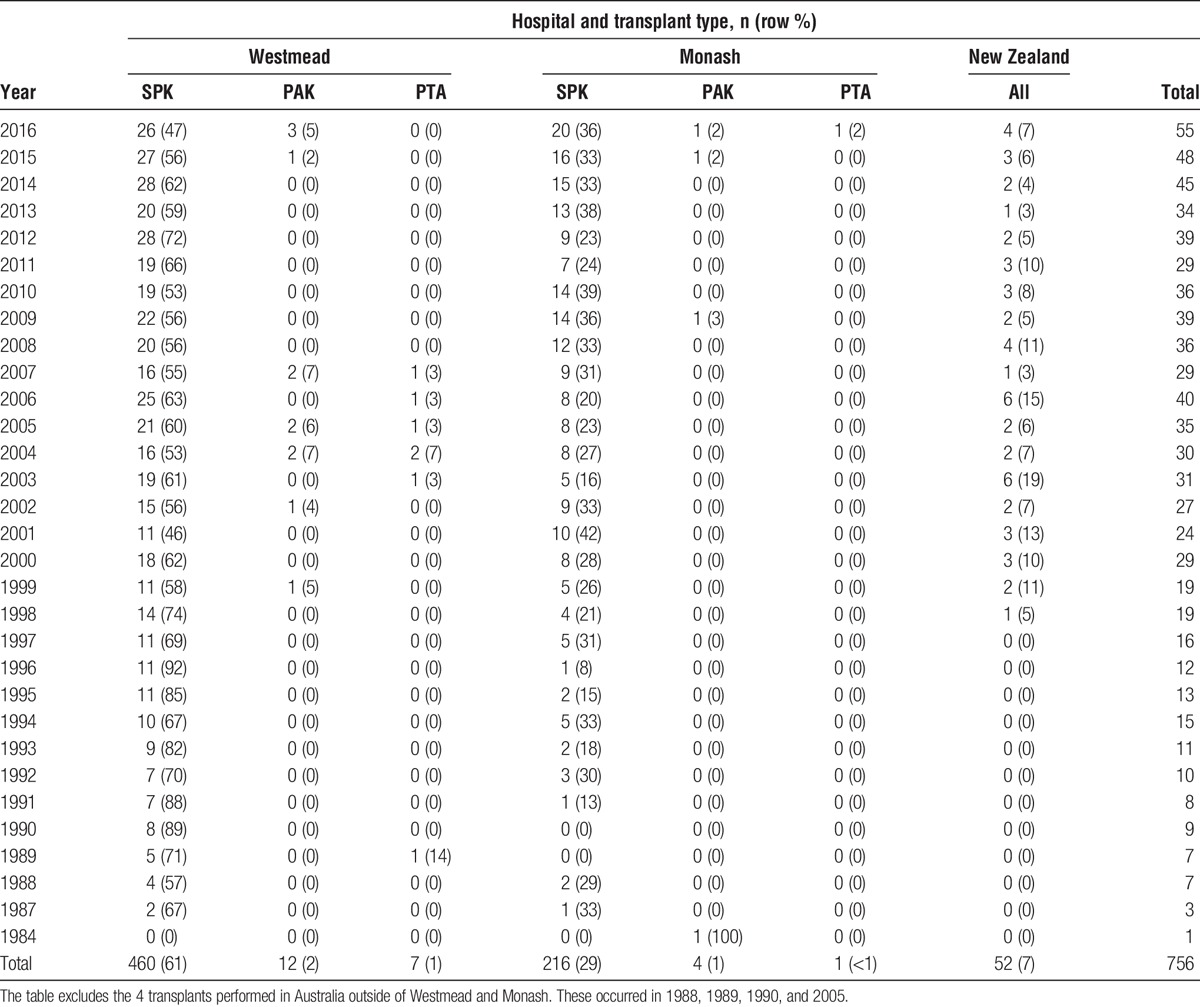
Not all pancreas transplant operations are undertaken with the same organs. Simultaneous pancreas-kidney transplant (SPK) is the most common operation, representing 97% of all pancreas transplants in ANZ. From 55 transplants performed in 2016, 50 were SPK, 4 were pancreas after kidney transplant (PAK), and 1 was pancreas transplant alone (PTA). PAK operations are done for people who either had a first kidney transplant without a pancreas (most commonly from a living donor relative) and subsequently opt for a pancreas or for people who underwent an SPK but had a pancreas transplant failure, so need a further pancreas transplant. PTA is a less common operation and occurs rarely. On rarer occasions, a multiorgan transplant is undertaken, which includes a pancreas transplant. There were 1 simultaneous pancreas-liver plus kidney transplant that was performed in 2005, 1 liver-pancreas plus intestine transplant in 2012, and 1 liver plus pancreas transplant in 2016. The distribution of operation types is shown in Figure 5, and the number of transplants by operation type is shown in Table 10.
FIGURE 5.
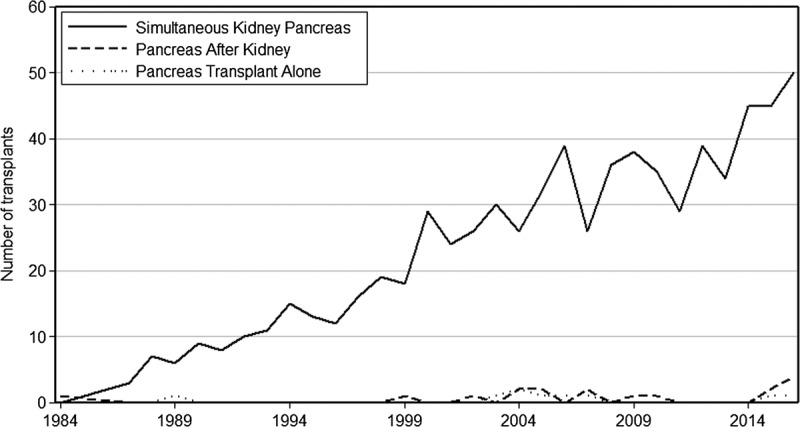
Pancreas transplants by type, over time.
TABLE 10.
Pancreas transplant operations by center, over time
Patients Transplanted by State
The states of origin of the people receiving pancreas transplants are shown in the following tables by transplanting center: Table 11 for Westmead and Table 12 for Monash. Numbers for New Zealand can be found in Table 10.
TABLE 11.
Distribution of state of residence of people receiving pancreas transplants in Australia over time at Westmead pancreas transplant unit (New South Wales)

TABLE 12.
Distribution of state of residence of people receiving pancreas transplants in Australia over time at Monash pancreas transplant unit (Victoria)

Demographics of New Pancreas Transplant Recipients
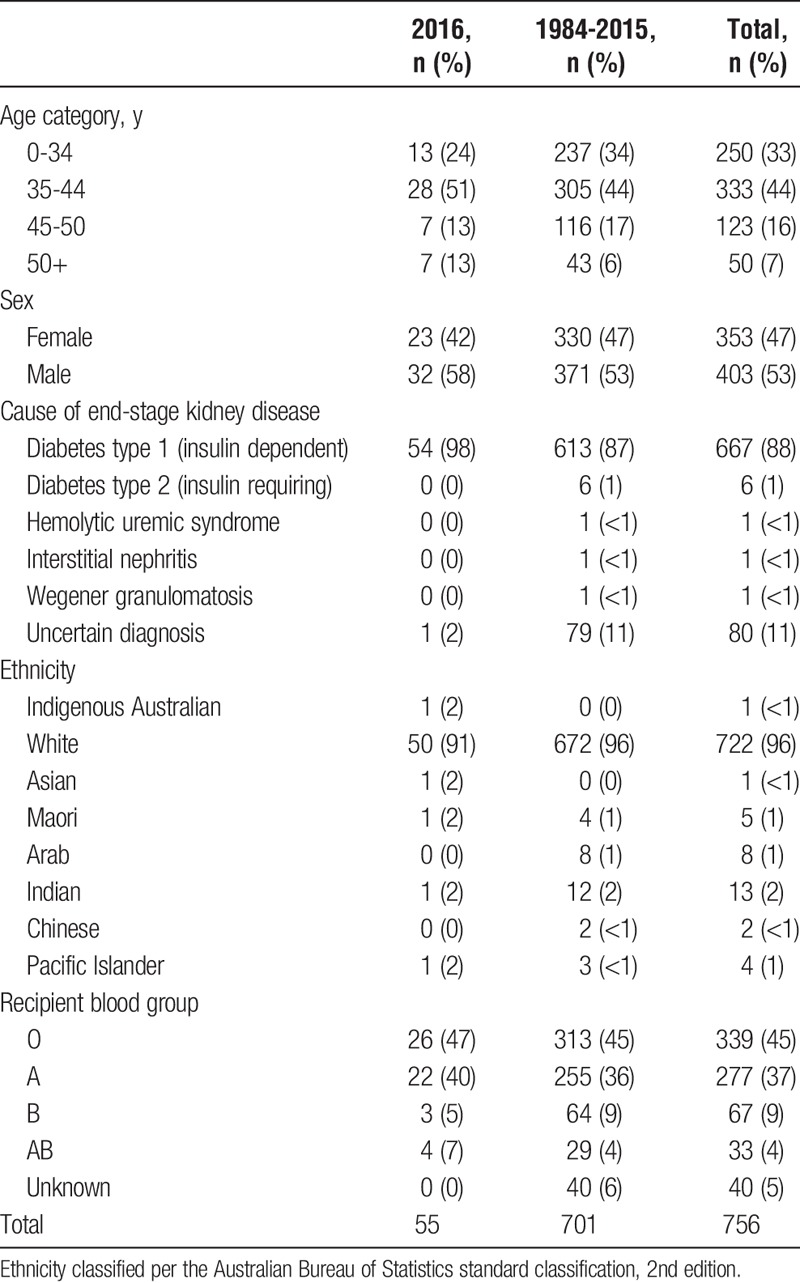
The characteristics of pancreas transplant recipients in 2016 and in previous years are shown in Table 13. The primary diagnosis causing end-stage kidney disease of recipients during 2016 and historically was type I diabetes. The number of diabetic recipients with other cause of end-stage kidney failure was small. The number of patients with type II diabetes accepted for pancreas transplantation was also small, and none were transplanted in 2016.
TABLE 13.
Demographics and characteristics of pancreas transplant recipients
Balance of Donor and Recipient Characteristics in 2016
Cross-tabulations of donor and recipient blood group and sex for people transplanted in 2016 are displayed in Tables 14 and 15. These distributions remain like previous years.
TABLE 14.
Cross-tabulation of recipient and donor blood groups for 2016
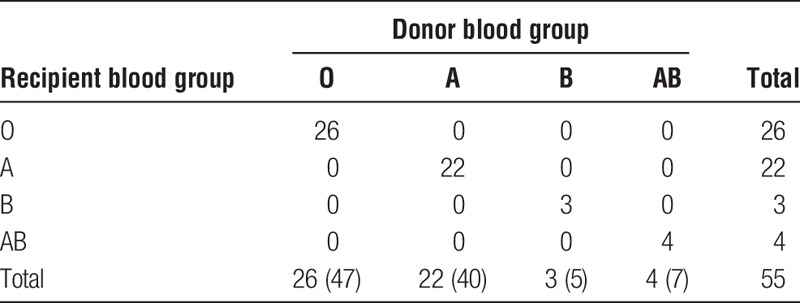
TABLE 15.
Cross-tabulation of recipient and donor sex for 2016

Patient Survival
Patient survival is calculated from the date of transplantation until death. Patients still alive at the end of the follow-up period are censored. For people who had more than 1 transplant, their survival is calculated from the date of their first transplant. For these analyses, we had survival data for 738 patients, 18 of whom have received 2 pancreas transplants for a total of 756 pancreas transplants. Note that the following survival plots' survival proportion on the y axes does not always start at zero; this is to better demonstrate some observed differences.
Figure 6 shows overall survival after pancreas transplant. There were 6557 years of observation, and 129 people died in that time. Survival at 1 year was 96.7%; at 5 years, 92.9%; at 10 years, 82.6%; and at 15 years, 76.4%.
FIGURE 6.
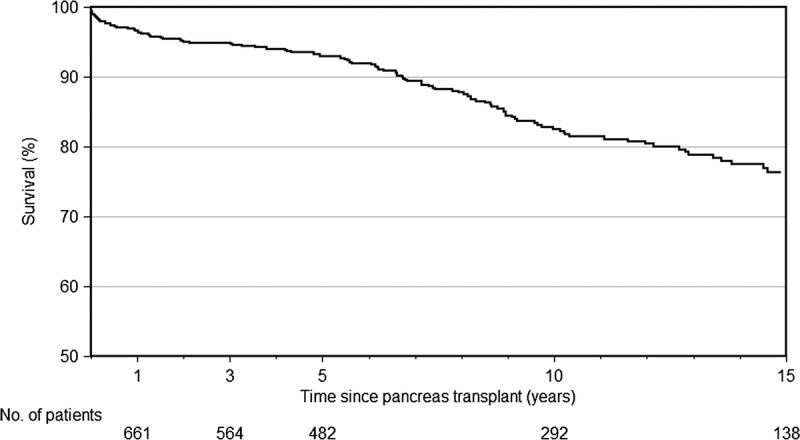
Patient survival after pancreas transplantation in ANZ.
Patient survival by era of transplantation is shown in Figure 7. Survival has improved over time, P < 0.001. Survival at 1 year for people transplanted in 2000 or before 2000 was 93.2%, and in recent years, this has risen to 97.5%. Survival at 5 years was 88.7% for those transplanted in 2000 or before whereas for those transplanted after 2005 5-year survival was 93.5%.
FIGURE 7.
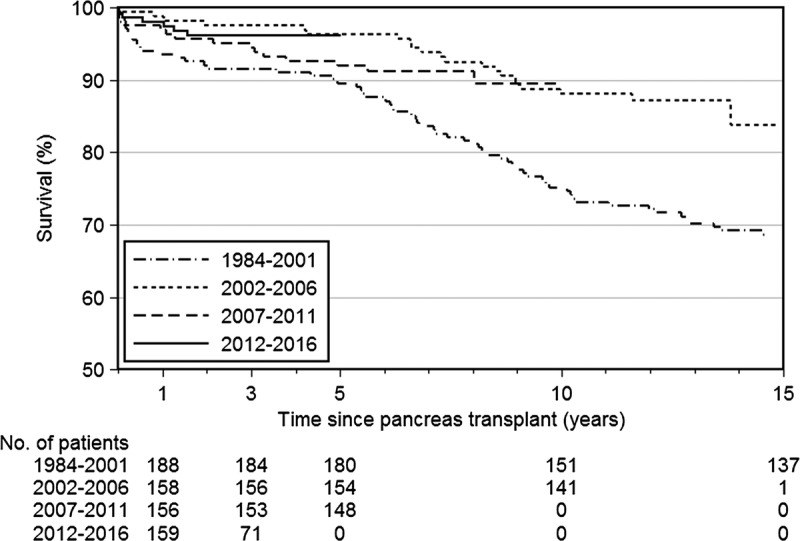
Patient survival by era of transplantation.
Patient survival by age at transplantation is shown in Figure 8. People who were older at the time of pancreas transplantation had poorer survival than those who were younger (P = 0.006). People 45 years and older at transplantation were more than twice as likely to die as those 44 years or younger. Survival at 1 year for recipients younger than 35 years was 98.0% and for those aged 35 to 44 years was 96.5%, whereas for those aged 45 to 49 years was 94.9% and those 50 years or older was 95.9%. Five-year survival for those younger than 35 years was 93.2% and for those aged 35 to 44 years was 93.7%, whereas for those aged 45 to 49 years was 91.0% and those 50 years or older was 91.1%.
FIGURE 8.
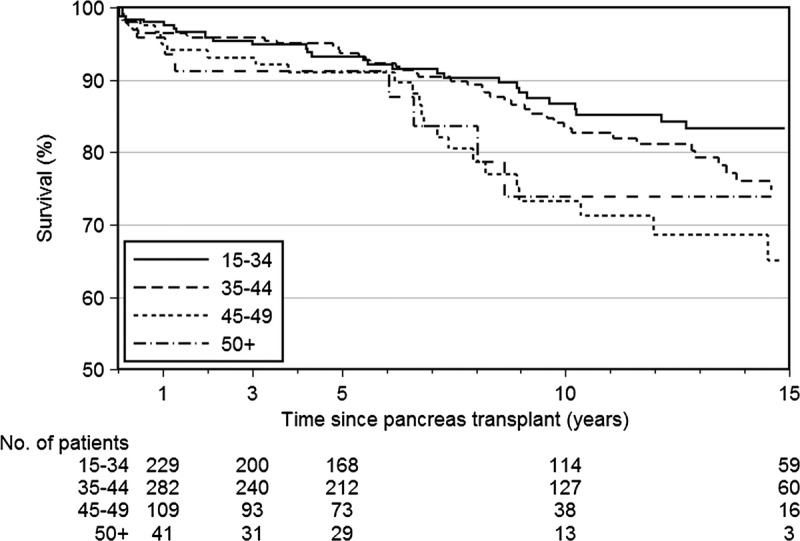
Patient survival by age at transplantation.
Pancreas Survival
Pancreas transplant survival was calculated from the time of transplant until the time of permanent return to insulin therapy or pancreatectomy. We calculated both pancreas failure including death with a functioning pancreas and pancreas failure censored for death with a functioning graft. For pancreas graft survival, we included all pancreas transplants undertaken, including those who had received a pancreas transplant twice (18 patients). At the time of this report analysis, we had complete survival records for 756 pancreas transplants.
Figure 9 shows pancreas survival censored for death. Over 5412 years of observation, there were 151 pancreas graft failures (excluding people who died with a functioning transplant). Overall, 1-year pancreas graft survival was 87.2%; 5-year survival, 82.1%; 10-year survival, 78.4%.
FIGURE 9.
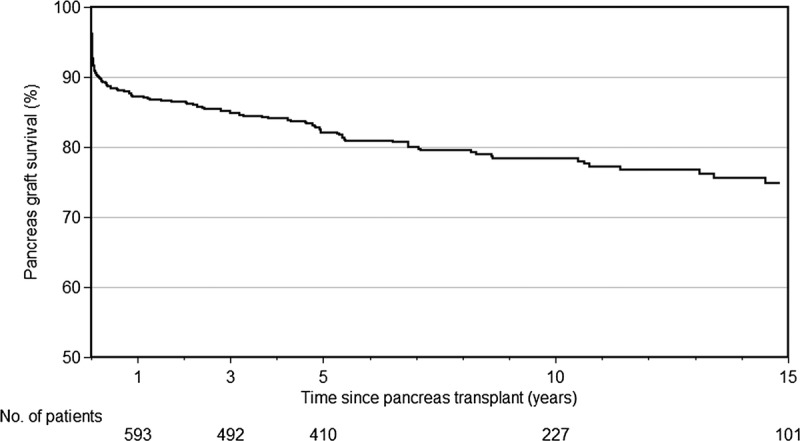
Pancreas transplant survival, excluding death with a functioning pancreas graft.
Figure 10 shows pancreas survival including death with a functioning pancreas. Over the same observation time, there were an additional 244 recipients who died with their pancreas still functioning. One-, 5-, and 10-year survival rates were 85.4%, 77.6%, and 66.4%, respectively.
FIGURE 10.
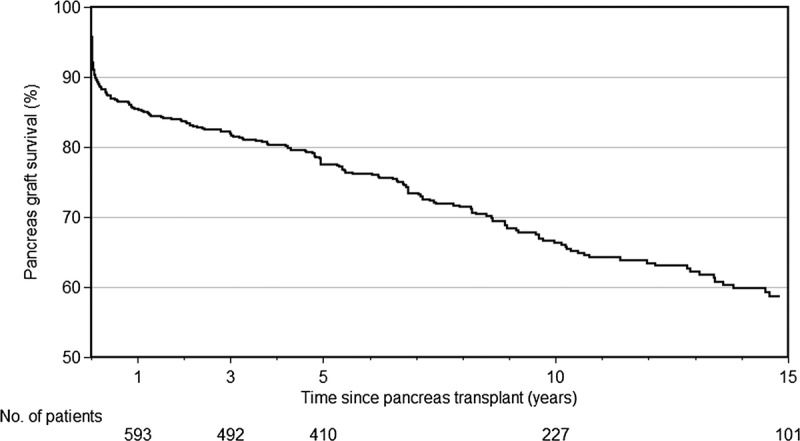
Pancreas transplant survival, including death with a functioning pancreas graft.
Survival of pancreas transplants varied over time, with survival markedly improving over time (P = 0.003). For those transplanted in more recent years, risk of transplant loss was more than 50.7%, lower than those transplanted before 2000. This is shown in Figure 11. In 2000 and previous years, 1-year pancreas survival was 80.2% and 5-year survival was 73.7%. For those transplanted after 2005, 1-year survival was 90.3% and 5-year survival was 86.1%.
FIGURE 11.
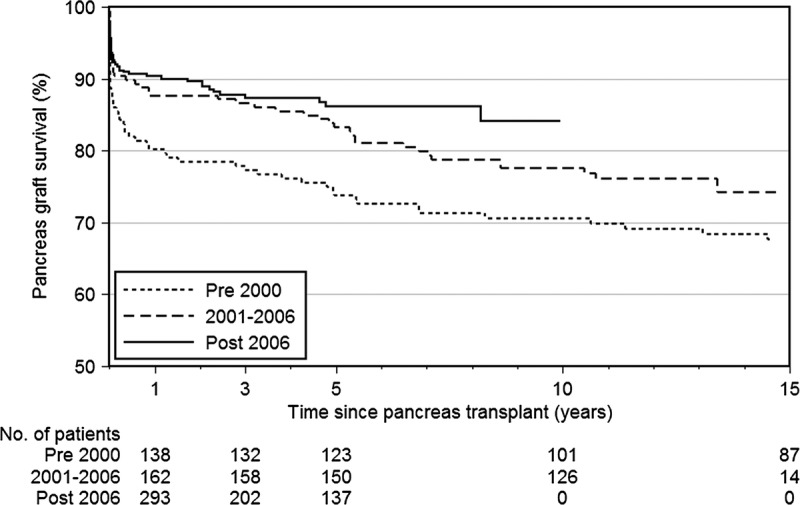
Pancreas transplant survival over time (censored for death).
Pancreas survival by donor body mass index (BMI) is presented in Figure 12. Most donors (57%) were either underweight or normal (BMI < 25 kg/m2). However, 27% were overweight (BMI = 25-29 kg/m2) and 4% were obese (BMI ≥ 30 kg/m2). Although Figure 12 suggests separation of survival curves, there was no difference statistically (P = 0.6).
FIGURE 12.
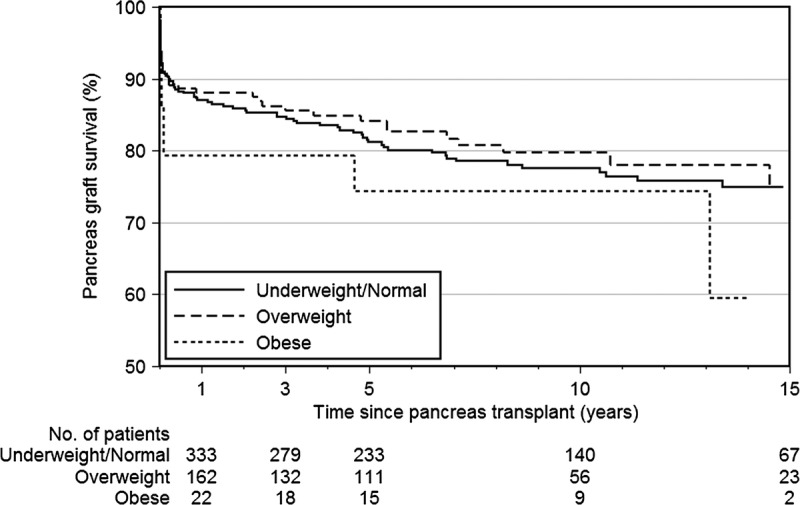
Pancreas survival censored for death with pancreas function, by donor BMI.
Pancreas survival by donor age is presented in Figure 13. The survival curves seem poorer for donors aged 35 to 44 years compared with those 45 years and older, or younger donors, but this difference was not statistically significant (P = 0.1). We can only hypothesize that any difference may be due to donors older than 45 years being a more highly selected group, compared with the donors aged 35 to 44 years.
FIGURE 13.
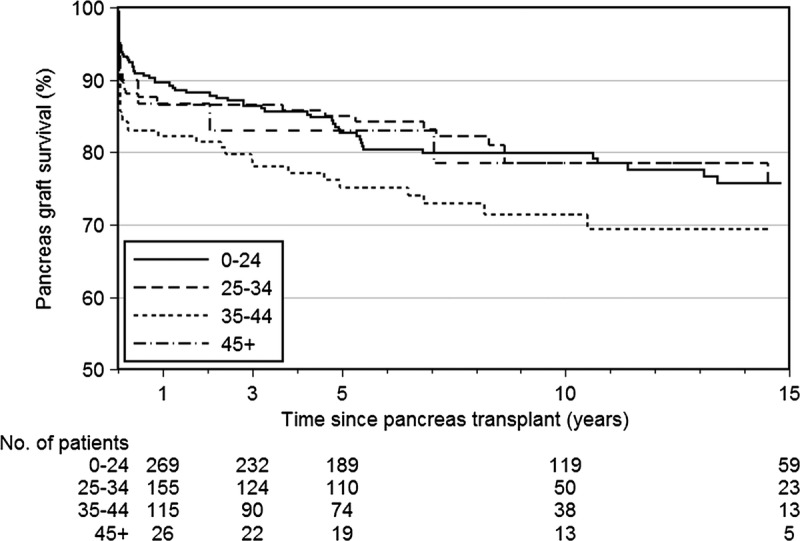
Pancreas transplant survival, censored for death with function, by donor age.
Prevalence of Functioning Pancreas Transplants
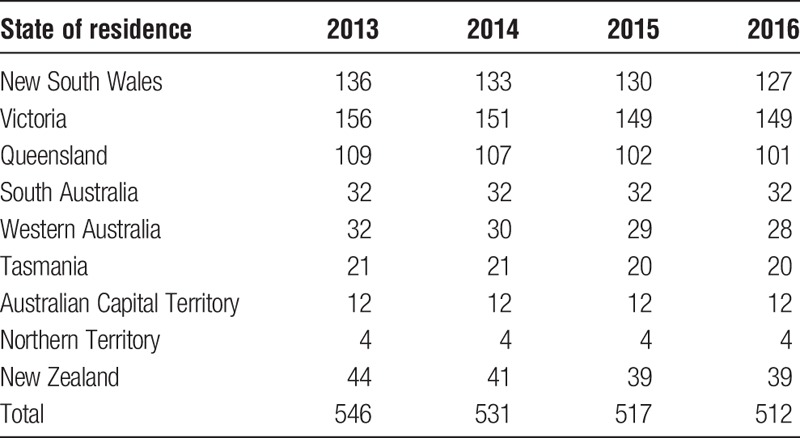
We calculated the point prevalence of people living in ANZ who were alive with a functioning transplant on 31st December each year for the past 4 years (Table 16). The numbers hereinafter exclude people who are still alive but whose pancreas transplant has failed. The number of functioning transplants has decreased slightly over time but seems to be stabilizing between 2015 and 2016.
TABLE 16.
People alive with a functioning pancreas transplant in ANZ by year and residence, at year's end
Kidney Transplant Survival
Kidney transplant survival was calculated for those who received SPK transplants, from the time of transplantation until the time of return to dialysis. We calculated both kidney failure including death with a functioning kidney and kidney failure censored for death with a functioning graft. For kidney graft survival, we included only SPK transplants and excluded PAK transplant recipients. We had survival records for 727 SPK transplant recipients.
Figure 14 shows kidney survival censored for death. Over 5910 years of observation, there were 80 kidney graft failures (excluding people who died with a functioning transplant). Overall, 1-year kidney graft survival was 96.8%, 5-year survival was 93.2%, and 10-year survival was 87.6%.
FIGURE 14.
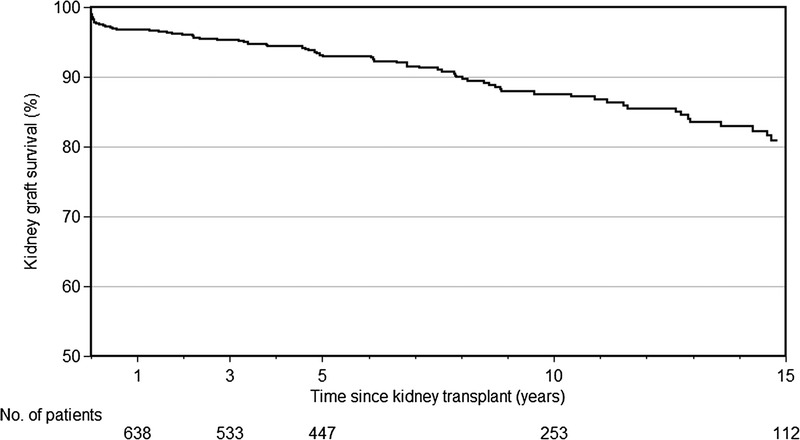
Kidney transplant survival, censored for death with kidney function, for people receiving SPK transplants.
Figure 15 shows kidney survival including death with a functioning kidney. Over the same observation time, there were an additional 97 recipients who died with their kidney still functioning. One-, 5-, and 10-year survival rates were 94.4%, 87.8%, and 74.7% respectively.
FIGURE 15.
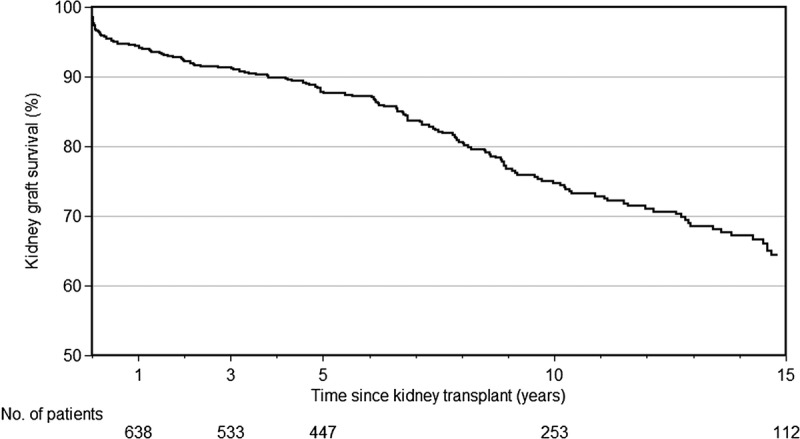
Kidney transplant survival, including death with kidney function, for people receiving SPK transplants.
Kidney survival improved over time, with longer survival for those transplanted in more recent years (P = 0.006). For those transplanted in 2000 or before, kidney transplant survival was 93.0% at 1 year and 89.4% at 5 years but was 98.5% at 1 year and 95.3% at 5 years for those transplanted after 2005 (Figure 16).
FIGURE 16.
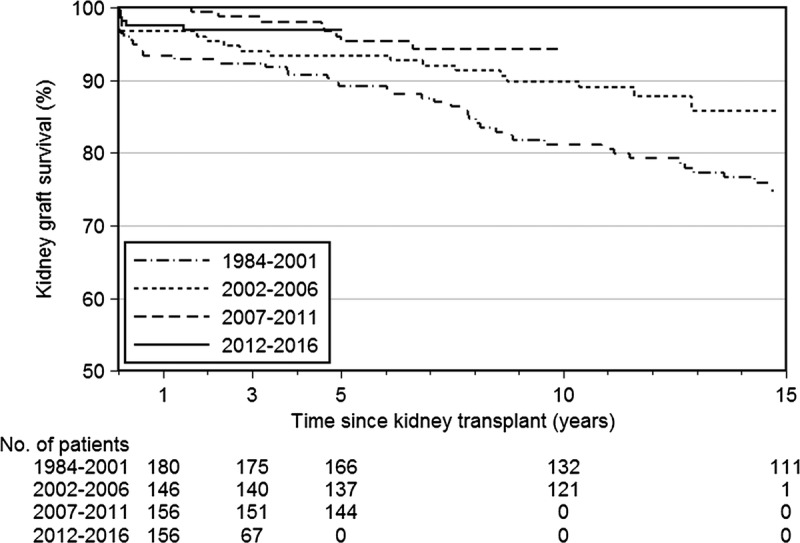
Kidney transplant survival, censored for death, for SPK recipients over time.
The era effect was even stronger when considering kidney failure including death with kidney function, P < 0.001. For those transplanted 2000 or before, survival was 89.2% at 1 year and 82.4% at 5 years but was 96.3% at 1 year and 89.9% at 5 years after 2005 (Figure 17).
FIGURE 17.
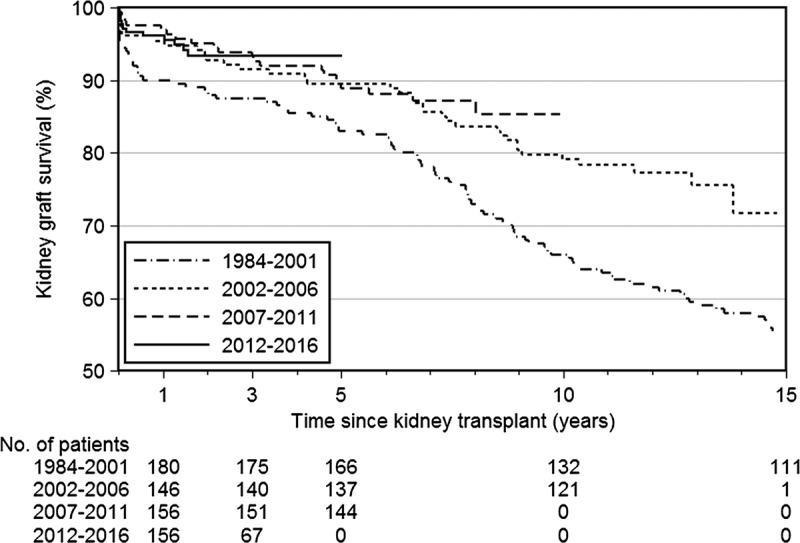
Kidney transplant survival, including death with a functioning kidney, for SPK recipients over time.
Pancreas Transplant Operative Data
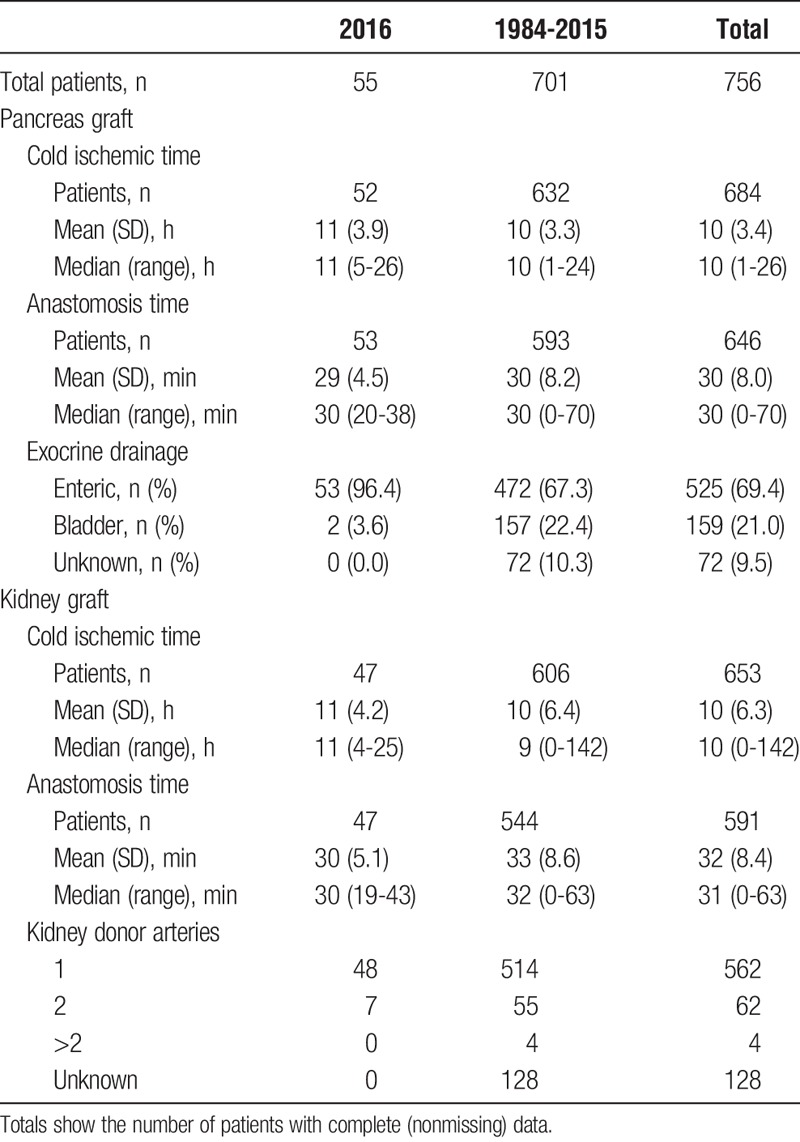
Characteristics of the pancreas transplant operations for 2016, previous years, and overall are shown in Table 17.
TABLE 17.
Descriptive characteristics of pancreas transplant operations
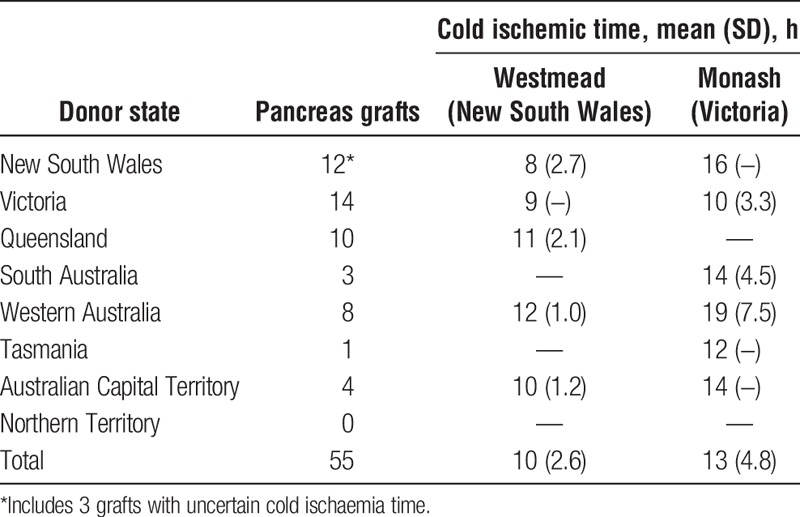
To investigate how much the total cold ischemic time varied dependent on the donor state and distance traveled to the transplanting center, Table 18 displays a cross tabulation of donor state of origin with transplanting center.
TABLE 18.
Comparison of cold ischemic time of pancreas grafts by donor state, for Australian pancreas transplants 2016
Surgical Technique
Exocrine drainage of the pancreas graft has changed over time. Enteric drainage of the pancreas was first used in ANZ during 2001. Figure 18 illustrates the number of transplants by pancreas duct management. Since 2001, most pancreas transplants have used enteric drainage of the pancreas duct.
FIGURE 18.
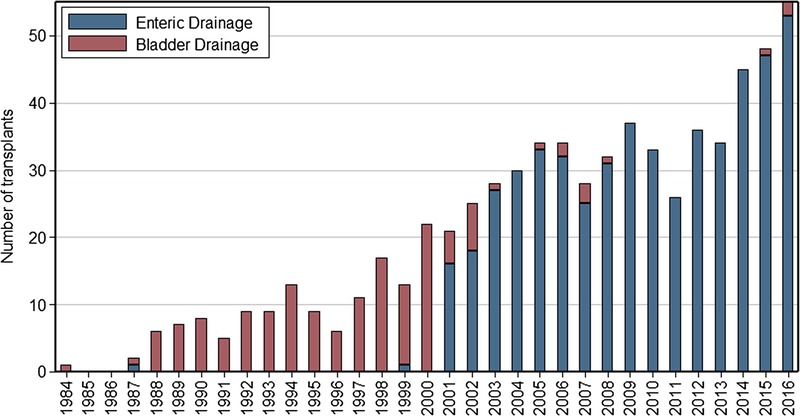
Change in management of exocrine drainage of the pancreas over time.
The site of donor vessel anastomoses onto the recipient vessels is dependent on many things, including but not limited to surgeon's preference, surgical ease of access, length, and relative caliber of donor vessels. The sites of anastomosis for donor arteries and veins are displayed in Figures 19 and 20.
FIGURE 19.
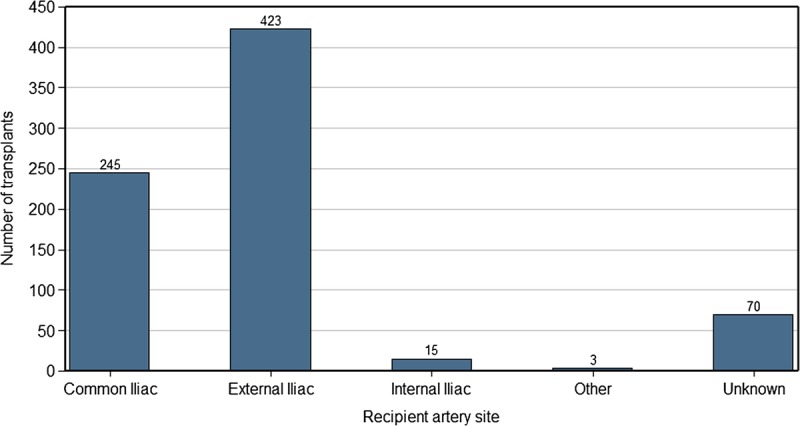
Site of donor artery anastomosis onto recipient vessel.
FIGURE 20.
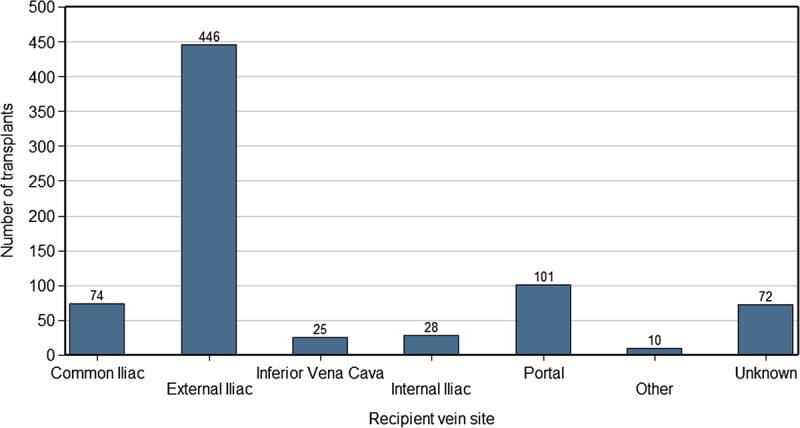
Site of donor vein anastomosis onto recipient vessel.
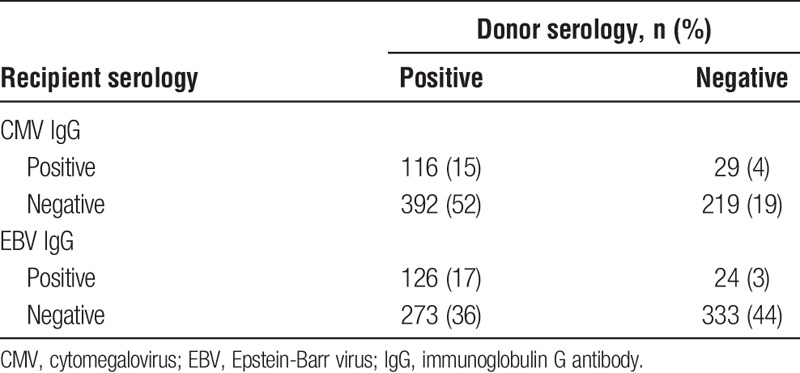
The immunological matching of donor-recipient pairs is shown in Table 19, and the cytomegalovirus and Epstein-Barr virus matching is illustrated in Table 20.
TABLE 19.
Immunological crossmatching of donor recipient pairs
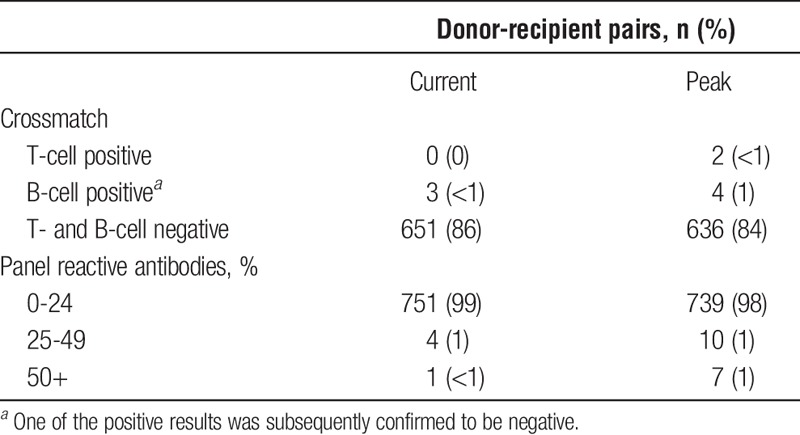
TABLE 20.
Infectious disease serology cross-tabulation of donor recipient pairs
PART 3. PANCREAS DONORS
This section gives an overview of donors in 2016 and over time. Donor eligibility criteria guidelines are available in The Transplantation Society of Australia and New Zealand consensus statement1 but briefly require donors to be more than 25 kg, and up to the age of 45 years, without known diabetes mellitus or pancreatic trauma or history of alcoholism or pancreatic trauma. Donation after cardiac death may be considered up to the age of 35 years. Because these are guidelines, there may be occasions when there is minor deviation from these advised criteria.
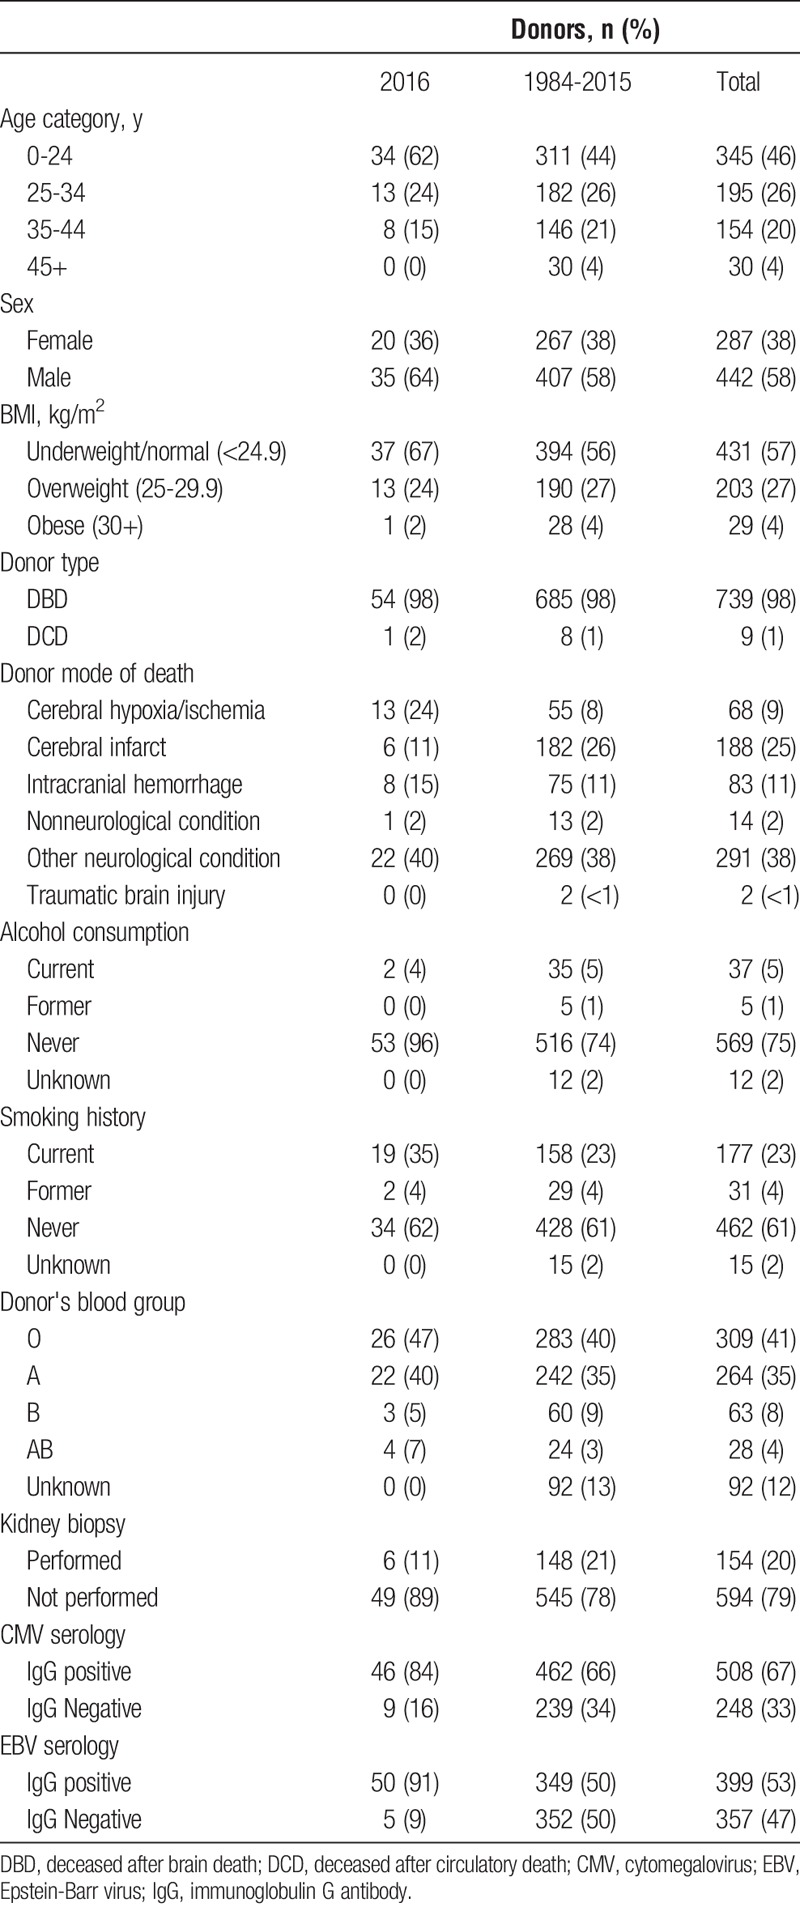
Donor BMI is perceived as impacting recipient outcomes. Obese donors are more likely to have fatty pancreas, which results in more difficult surgery and increased postoperative complications, and suboptimal insulin secretion. Alcohol consumption is defined by a history of consumption of more than 40 g/d. Table 21 describes pancreas donor characteristics in ANZ to date.
TABLE 21.
Demographics and characteristics of pancreas transplant donors
The distribution of donor states of origin is shown in Table 22 and Table 23 by transplanting unit. Tables 24 and 25 show the distribution of donor organs according to state of origin, cross-tabulated with the state of origin of the recipients who received those organs, for 2016, and from inception of the pancreas program. Note, these tables include Australian donors and recipients only.
TABLE 22.
Distribution of state of residence of pancreas donors in Australia over time at Westmead national pancreas transplant unit (New South Wales)

TABLE 23.
Distribution of state of residence of pancreas donors in Australia over time at Monash pancreas transplant unit (Victoria)

TABLE 24.
Number of pancreas transplants by donor and recipient state of residence in Australia, all years

TABLE 25.
Number of pancreas transplants by donor and recipient state of residence in Australia, 2016 only

ACKNOWLEDGMENTS
The authors acknowledge the contributions of all ANZ pancreas transplant collaborators: Dr Helen Pilmore, Professor Stephen Munn, Professor Peter Kerr, Associate Professor John Kanellis, Dr Bill Mulley, Mr Alan Saunder, Mr Roger Bell, Mr Ming Yii, Miss Nancy Suh, Mr Stephen Thwaites, Mr Michael Wu, Ms Tia Mark, Professor Henry Pleass, Professor Philip O'Connell, Professor Jeremy Chapman, Dr Brian Nankivell, Associate Professor Angela Webster, Associate Professor Germaine Wong, Dr Natasha Rogers, Dr Brendan Ryan, Dr Lawrence Yuen, Professor Richard Allen, Dr Jane Holmes-Walker, Ms Kathy Kable, Mr Paul Robertson, Ms Patricia Anderson, Associate Professor Wayne Hawthorne, Mr Abhijit Patekar, and Ms Julie McKelvey.
Footnotes
Published online 6 September, 2017.
A.C.W. was the registry executive officer. J.H. and A.P. were the data analysts. P.R. was the transplant coordinator. P.J.K. was the biostatistics consultant.
The registry is funded in part by a grant from the Commonwealth Department of Health and Ageing.
The authors declare no conflicts of interest.
Contributor Information
Collaborators: on behalf of Australia and New Zealand Pancreas Transplant collaborators
REFERENCE
- 1.The Transplantation Society of Australia and New Zealand. Clinical guidelines for organ transplantation from deceased donors. The Transplantation Society of Australia and New Zealand Web site. http://www.tsanz.com.au/organallocationprotocols/. Accessed May 3, 2016.


