Abstract
Background:
This study aimed to compare the diagnostic values of contrast-enhanced ultrasound (CEUS) and contrast-enhanced computed tomography (CECT) in detecting small hepatocellular carcinoma (SHCC).
Methods:
A series of related articles from 2001 to 2015 were searched in PubMed and Embase databases. Data from selected articles were pooled to analyze the sensitivity, specificity, positive likelihood ratio (PLR), negative likelihood ratio (NLR), diagnostic odds ratio (DOR), and summary receiver operating characteristic (SROC) curve using Meta-DiSc software. Heterogeneity was estimated using χ2-based Cochran-Q test and I2-statistics, and publication bias was estimated using Egger test in Stata software.
Results:
In total, 8 high-quality articles based on 623 subjects including 318 SHCC cases were included. For the extracted data, no heterogeneity and publication bias were observed among these studies. The following respective data on CEUS and CECT were pooled: sensitivities: 0.75 (95% confidence interval [CI]: 0.70–0.80) and 0.74 (95% CI: 0.68–0.78); specificity: 0.91 (95% CI: 0.87–0.94) and 0.92 (95% CI: 0.89–0.95); PLRs: 5.99 (95%CI: 3.28–10.92) and 7.76 (95% CI: 3.12–19.28); NLRs: 0.31 (95% CI: 0.20–0.49) and 0.32 (95% CI: 0.20–0.50); DORs: 27.38 (95% CI: 14.38–52.11) and 30.02 (95% CI: 9.32–96.62). Area under the SROC curve: 0.91 and 0.89 and no significant statistical result was identified between them (Z = 0.23, P = .82).
Conclusion:
CEUS showed a diagnostic ability comparable to that of CECT in detecting SHCC.
Keywords: contrast-enhanced computed tomography, contrast-enhanced ultrasound, diagnostic value, small hepatocellular carcinoma, summary receiver operating characteristic
1. Introduction
Hepatocellular carcinoma (HCC) is one of the most malignant cancers and the fourth leading cause of cancer-related death worldwide.[1] Most HCCs occur in patients suffering from chronic liver diseases, such as HBV and HCV-related liver cirrhosis. Small HCC (SHCC) is defined as a primary measuring ≤2 or 3 cm in diameter[2,3] appearing at the early stage of HCC. SHCC patients usually exhibit lower intraoperative mortality, higher resection rate, and higher 5-year survival rate than larger HCC patients.[4] Thus, a reliable detection method is needed to identify SHCC at the early stage of HCC for improving the clinical treatment and prognosis of HCC.[5,6]
In recent years, contrast-enhanced ultrasound (CEUS) and contrast-enhanced computed tomography (CECT) have emerged as reliable imaging technologies used in various clinical detections, including the diagnosis of HCC and malignant renal cystic lesions.[7] However, diagnostic results need to be further confirmed by biopsy or surgery resection.[8] CEUS has many advantages, such as safety, easy execution, no risk of nephrotoxicity, and no requirement for ionizing radiation,[9] and is mostly used to detect liver lesions at the early stage of HCC.[10] Although the specificity and sensitivity of CEUS are comparable to those of CECT, some lesions are not detected. The American Association for the Study of Liver Disease has indicated that CEUS may provide false HCC positive diagnosis in cholangiocarcinoma patients.[11] CECT is a recommended tool for resection or systemic therapy assessment in 2 years of postoperative. Based on the intravenously injected iodinated contrast agents, CT can provide a marked reduction imaging for real-time thin-section of entire liver.[12] However, with respect to the final results of biopsy or surgery resection, the diagnosis ability of CEUS compared with that of CECT remains controversial. For example, Palmieri et al[13] have reported that CEUS has a lower sensitivity and negative predictive value in the diagnosis of early-stage HCC, but Liu et al[14] have reported that there is no significant difference between abilities of CEUS and CECT in diagnosing small liver lesions. Because of the lack of comparisons of the diagnosis abilities of CEUS and CECT in previous studies, we performed this meta-analysis to perform a more reliable and comprehensive evaluation of the diagnostic abilities of CEUS and CECT in detecting small lesions (≤2 cm) of SHCC.
2. Methods
2.1. Data sources
Electronic databases of PubMed (http://www.ncbi.nlm.nih.gov/pubmed) and Embase (http://www.embase.com) were used to select related clinical research articles published in English up to July 2016. The following key search terms were used: small hepatocellular carcinoma (OR “SHCC”) and contrast-enhanced ultrasound (OR “contrast-enhanced ultrasonography” OR “CEUS”) and contrast-enhanced CT (OR “contrast-enhanced computed tomography” OR “CECT” OR “CT”).
2.2. Inclusion and exclusion criteria
Studies were included if they met the following terms: the study is focused on the diagnostic values of CEUS and CECT in detecting SHCC and published in English; has provided or calculated the diagnostic results of real positive numbers, false-positive numbers, false-negative numbers, and true-negative numbers; and has definitely pathological result as the golden standard for the diagnosis of SHCC. Studies were excluded if they were reviews, reports, comments, or letters.
2.3. Data extraction and quality assessment
Two authors independently extracted the data, including first author, published date, research date, nationality, sex, age, and true-positive, false-positive, false-negative, and true-negative numbers, from the included studies. Study quality was assessed by the quality assessment of diagnostic accuracy studies (QUADAS), containing 14 items that were determined by “YES” (satisfied with the criteria), “No” (not satisfied with the criteria), and “Unclear” (partially satisfied with the criteria or could not provide sufficient information).[15] A third author was introduced to settle any disagreement between the 2 authors in the process of data extraction.
2.4. Statistical analysis
The meta-analysis was performed using Meta-DiSc (version 1.4, Unit of Clinical Biostatistics team of the Romany Cajal Hospital, Madrid, Spain). For multiple diagnoses or screen assessment, the effect size was measured in terms of sensitivity, specificity, positive likelihood ratio (PLR), negative likelihood ratio (NLR), and diagnostic odds ratio (DOR) with their 95% confidence intervals (CIs). Threshold effect size was estimated using Spearman correlation analysis, and P < .05 was considered statistically significant. Heterogeneity was estimated using χ2-based Cochran-Q test and I2 statistics.[16] If heterogeneity was significant (P < .05 or I2 > 50%), a random effect model was used to calculate the pooled effect size by applying DerSimonian–Laird method; otherwise, a fixed effect model was used to calculate the pooled effect size by applying Mantel–Haenszel method.[17] Heterogeneity resource was assessed using regression analysis. Publication bias was estimated using Egger test and Begg test in Stata software (Version 12.0, Stata Corporation, College Station, Texas), and P < .05 was set as a threshold for statistical significance.
3. Results
3.1. Characteristics of included studies
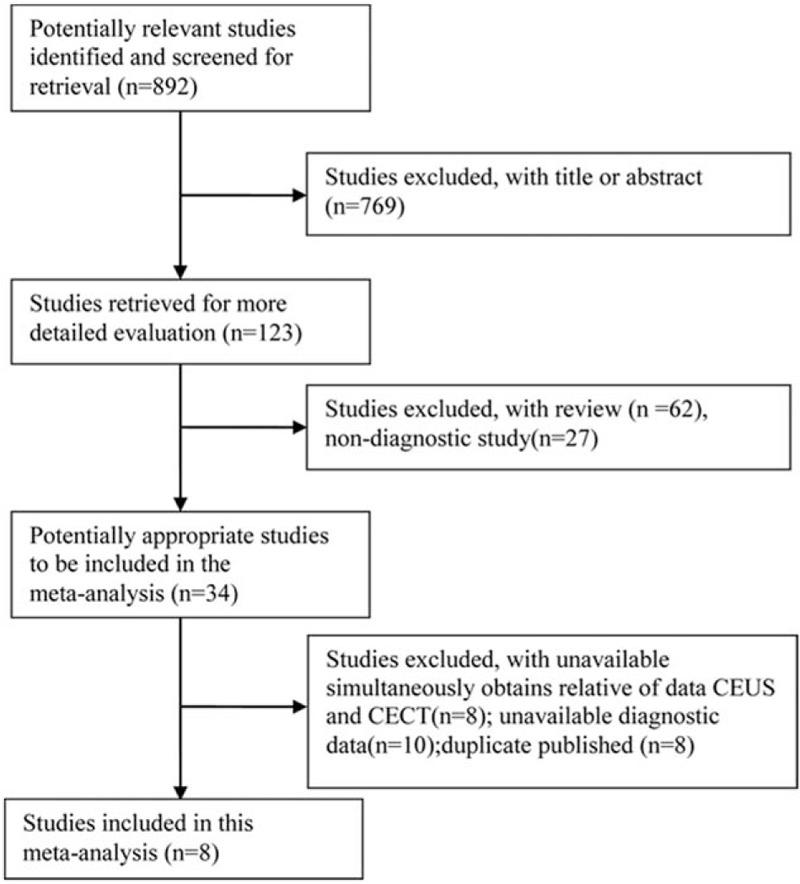
A flowchart of literature research is shown in Fig. 1. Based on the selected strategy, 892 papers were obtained. After scanning the titles and abstracts, 769 papers were excluded because of irrelevant study contents. Of the remaining papers, 115 were excluded because they were reviews (n = 62), non-diagnostic studies (n = 27), data unavailable (n = 18), or duplicate published (n = 8). Finally, 8 studies that met the selected criteria were included in this meta-analysis.[2,10,18–23] The characteristics of the included studies are presented in Table 1. The included studies comprised the data of 623 participants, including 318 SHCC patients, from various countries, such as China, Italy, Japan, and France. The publication year of the included studies ranged from 2001 to 2015. The quality assessment results revealed that the overall quality of the included studies was high with sound QUADAS scores of 9 to 12, but some individuals had a relatively low quality. In addition, based on the Egger test, no publication bias was found in CEUS (t = 0.19, P = .856) and CECT (t = 2.09, P = .105) in SHCC diagnosis. Begg test also revealed no significant publication bias was observed in CEUS (Z = 0.19, P = .85) or CECT (Z = 0.94, P = .35) in SHCC diagnosis.
Figure 1.

Selection process of eligible studies.
Table 1.
Characteristics of the included articles.

3.2. Diagnostic analysis of pooled data
The threshold effects of CEUS and CECT were evaluated using the Spearman correlation coefficients of the logarithm of sensitivity and 1-specificity. No threshold effect of CEUS and CECT was identified for these 2 indices (sensitivity: coefficient = 0.619, P = .102; 1-specifity = 0.024, P = .955); thus, a combined analysis of the other 2 indices could be performed.
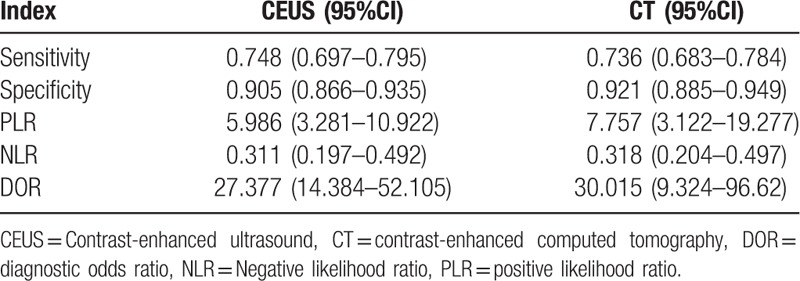
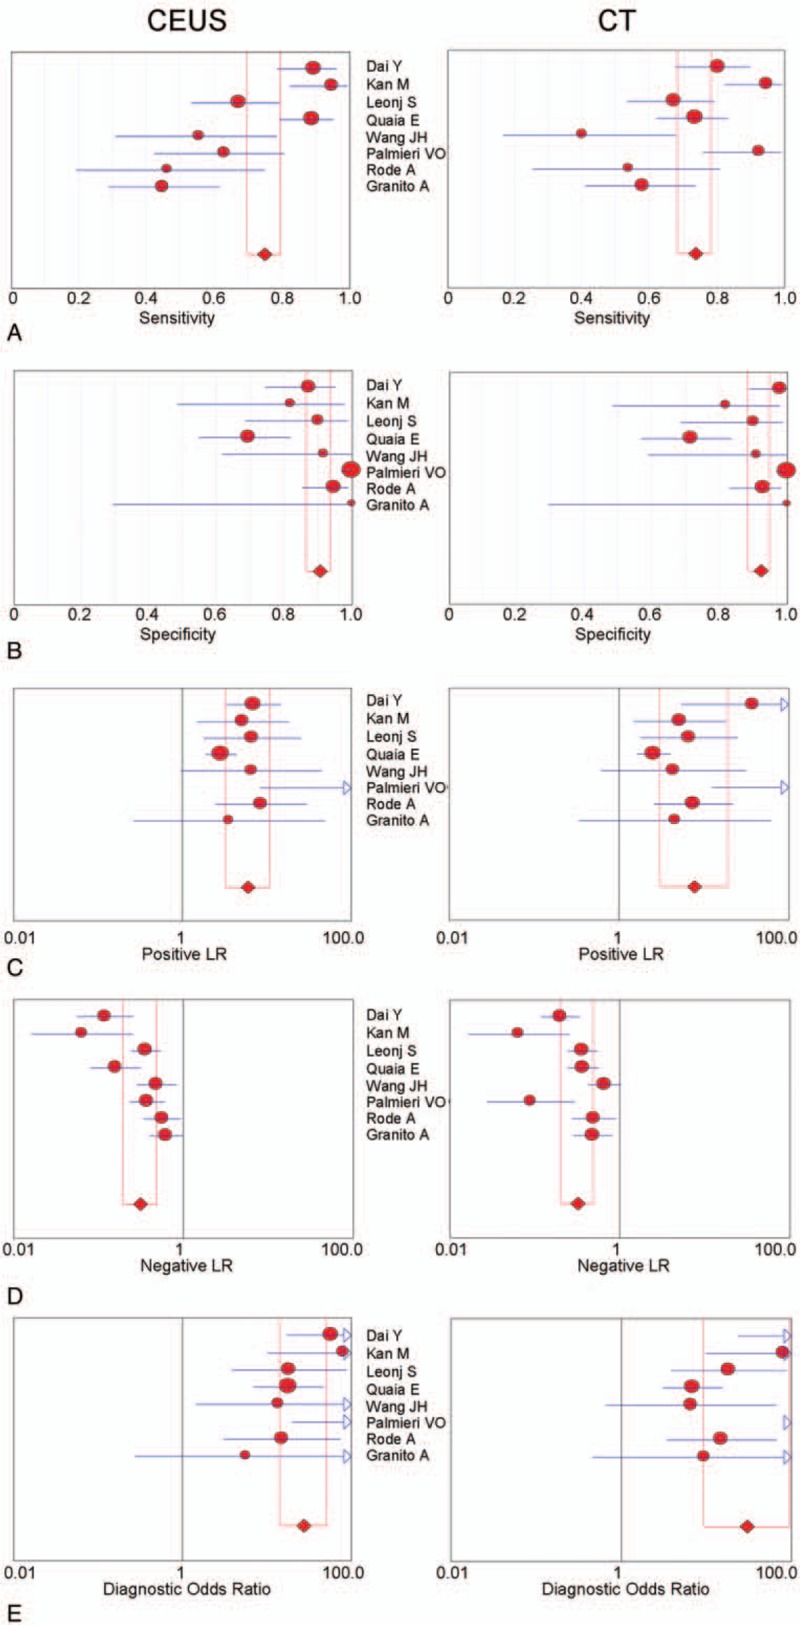
The diagnostic results of CEUS and CECT in detecting SHCC are presented in Table 2 and Fig. 2. Because of the significant heterogeneities on CEUS (P < .01, I2 = 87.1%) and CT (P < .01, I2 = 79.9%), the random effect model was selected and the pooled sensitivities of CEUS and CECT were determined to be 0.75 (95% CI: 0.70–0.80) and 0.74 (95% CI: 0.68–0.78), respectively (Fig. 2). Similarly, because of significant heterogeneities in the CEUS and CECT specificities (P < .01, I2 = 83.2%; P < .01, I2 = 82.8%), the random effect model was selected and the pooled specificities of CEUS and CECT were determined to be 0.91 (95% CI: 0.87–0.94) and 0.92 (95% CI: 0.89–0.95), respectively. To trace the source of heterogeneity, a regression analysis was performed and no significant result was identified in the study population (Asian vs Europe) and sample size (patients <100 vs patients ≥100) (Table 3). These results suggested that the study population and sample size were not the source of heterogeneity.
Table 2.
Diagnostic results of CEUS and CT.

Figure 2.

Diagnostic analysis of contrast-enhanced ultrasound (CEUS) and contrast-enhanced computed tomography (CT): (A) sensitivity; (B) specificity; (C) positive like ratio (PLR); (D) negative like ratio (NLR); (E) diagnostic odds ratio.
Table 3.
Results of meta-regression analysis.

In in-depth assessment, the diagnostic PLRs of CEUS and CECT remarkable heterogeneities (P = .0449, I2 = 51.3%; P = .0008, I2 = 72.0%). Similarly, the random effect model was selected to estimate the pooled data, and the pooled PLRs of CEUS and CECT were 5.99 (95% CI: 3.28–10.92) and 7.76 (95% CI: 3.12–19.28), respectively. The diagnostic NLRs of CEUS and CECT also demonstrated significant heterogeneities, and therefore, the random effect model was applied. As a result, the pooled NLRs of CEUS and CECT were 0.31 (95% CI: 0.20–0.49) and 0.32 (95% CI: 0.20–0.50), respectively. In addition, the diagnostic DORs of CEUS and CT were also estimated, but the DOR of CEUS was not heterogeneous (P = .2915, I2 = 89.0%); therefore, the fixed effect model was used, and the pooled DOR of CEUS was found to be 27.38 (95% CI: 14.38–52.11). On the contrary, the DOR of CECT exhibited a significant heterogeneity (P = .0015, I2 = 70.0%), and therefore, the random effect model was used. The combined DOR of CT was 30.02 (95% CI: 9.32–96.62). Taken together, these results clearly demonstrated that the detection indices of CEUS were not obvious differents from those of CECT for the diagnosis of SHCC.
3.3. Summary receiver operating characteristic (SROC) curves of CEUS and CECT
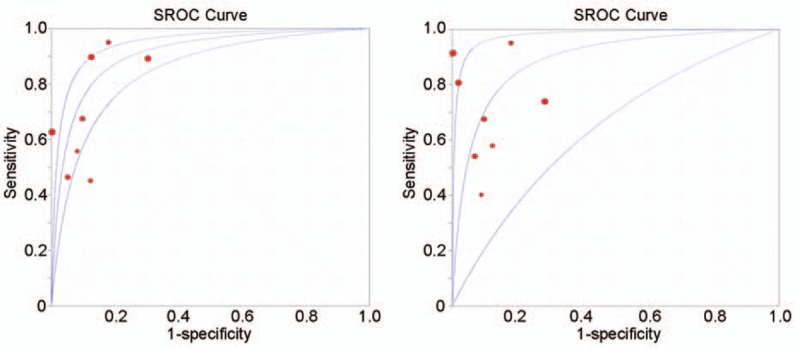
For a comprehensive evaluation of both CEUS and CECT in detecting SHCC, the diagnostic SROC curves of CEUS and CECT were analyzed and are presented in Fig. 3. Based on the threshold effective detection results, for both CEUS and CECT, the regression coefficients of logarithm of both sensitivity and specificity exhibited no statistical significance compared with 0: SROC curves were symmetric and demonstrated a clear trade-off between sensitivity and specificity. Hence, the fixed model was selected for performing the next analysis. Lastly, the area under curve (AUC) of the SROC curve for CEUS and CECT were 0.9073 and 0.8919, respectively, with their respective Q-indices of 0.8391 and 0.8227. No significant statistical difference was identified between CEUS and CECT on AUC by performing comparison using Z test (Z = 0.23, P = .82). On combining the diagnostic results with SROC curves, both indices and their 95% CIs and AUC overlapped between CEUS and CECT, suggesting that CEUS had a diagnostic ability comparable to that of CECT in detecting SHCC.
Figure 3.

Summary receiver operating characteristic curves: (A) contrast-enhanced ultrasound (CEUS); (B) contrast-enhanced computed tomography (CT).
4. Discussion
To compare the diagnostic values of CEUS and CECT in SHCC, 8 high-quality research papers in English presenting data of 318 SHCC patients were included in this meta-analysis with a small publication bias. The pooled data revealed that there was no obvious difference in sensitivities, specificities, PLRs, NLRs, and DORs between CEUS and CECT in detecting SHCC. Moreover, SROC curves also indicated that CEUS had an AUC and a Q-index similar to those of CECT in detecting SHCC.
Recently, using improved imaging and accuracy of diagnostic technologies, the detection of dormant and smaller lesions has become possible. Many studies have shown that diagnostic ability of CEUS is comparable to that of dynamic CECT in detecting tumor vascularity.[24] CECT, a scanner can provide a series of 2-dimensional image slices of an organ.[25] It is commonly accepted that pathological result is the golden standard for clinical diagnosis. A previous study has reported that CECT is a valuable diagnostic method for SHCC patients with bile duct tumor thrombi.[4] CEUS, an enhanced US system, has been reported to be more accurate in liver lesions characterisations with sensitivity comparable to that of CECT.[26] For example, Strobel et al[27] have reported that CEUS has a remarkable diagnostic accuracy in detecting small liver lesions. In addition, CEUS can be used for detecting small, newly developed lesions during HCC prognosis.[28] In this study, CEUS was found to have not only sensitivity comparable to that of CECT but also an equal capacity of other diagnostic indices in detecting SHCC, suggesting that CEUS and CECT have similar diagnostic ability in detecting SHCC. Moreover, Liu et al[14] have also reported comparable high sensitivity, specificity, and accuracy between CEUS and CECT in detecting small malignant diagnosis in liver, with a similar ability in distinguishing SHCC lesions from cirrhotic lesions in livers. The SROC curve of pooled data revealed that the AUCs of CEUS and CECT were approaching each other, which is consistent with the result of CEUS in the study of Niu et al.[29] All findings indicated that CEUS and CECT have a similar diagnostic value in detecting SHCC. Meanwhile, a similar meta-analysis has reported that CEUS and CECT exhibit no significant difference in the diagnosis of malignant renal cystic lesions.[7] In addition, a dog experiment has also shown that CEUS and CECT can provide diagnostic results comparable to histopathology findings in characterising surgical small intestinal diseases.[8] Taken together, these findings suggested that CEUS and CECT have similar diagnostic abilities in detecting small pathological lesions, but further clinical practices and studies are required for validating this finding. Moreover, several lesions were characterized neither by CEUS nor CECT because of their small sizes, location under diaphragm, or intersection, respiratory movement.[14] Despite the missed lesions, the potential factors should be concerned that could affect the diagnostic results. Different HCC diagnostic criteria may be a causative factor for diagnostic results. Because biopsy is set as the golden standard for SHCC diagnosis, difference in analytical criteria or experience for different censors may result in different conclusion on a same lesion. In addition, different CEUS or CECT systems may also perform differently in charactering small lesions resulting in different diagnostic results.
This is the first comprehensive meta-analysis evaluating the diagnostic ability of CEUS and CT in detecting SHCC. In the studies selected for the analysis, CEUS and CECT were used simultaneously for the diagnosis of SHCC in each patient. The combined results obtained by meta-analysis enlarged the sample sizes and enhanced the statistical power, providing an accurate and reliable conclusion. However, this analysis has 2 limitations. First, with only 2 diagnostic evaluation methods were included, there might be a bias in the estimation of diagnostic value because of the absence of other methods. Second, to the number of included studies is relatively small, and due to the incomplete stratification message of included samples, the sources of heterogeneity for the analysis were limited.
In conclusion, this comprehensive meta-analysis revealed that the diagnostic value of CEUS and CECT in detecting SHCC is similar, suggesting that both CEUS and CT may play vital roles in the clinical practice of SHCC diagnosis.
Footnotes
Abbreviations: AUC = area under curve, CECT = contrast-enhanced computed tomography, CEUS = contrast-enhanced ultrasound, CI = confidence interval, CIs = confidence intervals, DOR = diagnostic odds ratio, HCC = hepatocellular carcinoma, NLR = negative likelihood ratio, PLR = positive likelihood ratio, QUADAS = quality assessment of diagnostic accuracy studies, SHCC = small hepatocellular carcinoma, SROC = summary receiver operating characteristic.
The authors declare that they have no conflict of interest.
References
- [1].Siegel RL, Miller KD, Jemal A. Cancer statistics, 2016. CA Cancer J Clin 2016;66:10–29. [DOI] [PubMed] [Google Scholar]
- [2].Wang JH, Lu SN, Hung CH, et al. Small hepatic nodules (≤2 cm) in cirrhosis patients: characterization with contrast enhanced ultrasonography. Liver Int 2006;26:928–34. [DOI] [PubMed] [Google Scholar]
- [3].Cong W, Lu X, Lau W. Chen M, Zhang Y, Lau W. Pathobiologic Characteristics of Small Hepatocellular Carcinoma,11-24. Springer, Rdiofrequency ablation for small hepatocellular carcinoma. Dordrecht:2016. [Google Scholar]
- [4].Liu QY, Huang SQ, Chen JY, et al. Small hepatocellular carcinoma with bile duct tumor thrombi: CT and MRI findings. Abdom Imaging 2010;35:537–42. [DOI] [PubMed] [Google Scholar]
- [5].Chen MS, Li JQ, Zheng Y, et al. A prospective randomized trial comparing percutaneous local ablative therapy and partial hepatectomy for small hepatocellular carcinoma. Ann Surg 2006;243:321–8. [DOI] [PMC free article] [PubMed] [Google Scholar]
- [6].Huang GT, Lee PH, Tsang YM, et al. Percutaneous ethanol injection versus surgical resection for the treatment of small hepatocellular carcinoma: a prospective study. Ann Surg 2005;242:36–42. [DOI] [PMC free article] [PubMed] [Google Scholar]
- [7].Lan D, Qu HC, Li N, et al. The value of contrast-enhanced ultrasonography and contrast-enhanced CT in the diagnosis of malignant renal cystic lesions: a meta-analysis. Plos One 2016;11:e0155857. [DOI] [PMC free article] [PubMed] [Google Scholar]
- [8]. Goodall EFP. Comparative imaging of surgical small intestinal disease in dogs: evaluation of pre-operative contrast-enhanced ultrasound, intra-operative contrast-enhanced ultrasound, and triple-phase contrast-enhanced computed tomography; 2016. [Google Scholar]
- [9].Martie A, Sporea I, Popescu A, et al. Contrast enhanced ultrasound for the characterization of hepatocellular carcinoma. Med Ultrasonogr 2011;13:108–13. [PubMed] [Google Scholar]
- [10].Palmieri VO, Santovito D, Marano G, et al. Contrast-enhanced ultrasound in the diagnosis of hepatocellular carcinoma. J Hepatol 2008;48:848–57. [DOI] [PubMed] [Google Scholar]
- [11].Bruix J, Sherman M. Management of hepatocellular carcinoma: an update. Hepatology 2011;53:1020–2. [DOI] [PMC free article] [PubMed] [Google Scholar]
- [12].Heppner GH, Wolman SR. European organization for research and treatment of cancer. J Natl Cancer Inst 2000;30:169–169. [Google Scholar]
- [13].Palmieri VO, Santovito D, Marano G, et al. Contrast-enhanced ultrasound in the diagnosis of hepatocellular carcinoma. Radiol Med 2015;120:627–33. [DOI] [PubMed] [Google Scholar]
- [14].Liu J-J, Wang D, Li H-X, et al. Comparison of contrast-enhanced ultrasound and contrast-enhanced helical CT in the diagnosis of high echo-level small focal liver lesions. Int J Clin Exp Med 2016;9:8176–82. [Google Scholar]
- [15].Whiting P, Rutjes AWS, Reitsma JB, et al. The development of QUADAS: a tool for the quality assessment of studies of diagnostic accuracy included in systematic reviews. BMC Med Res Methodol 2003;3:25. [DOI] [PMC free article] [PubMed] [Google Scholar]
- [16].Lau J, Ioannidis JP, Schmid CH. Quantitative synthesis in systematic reviews. Ann Intern Med 1997;127:820–6. [DOI] [PubMed] [Google Scholar]
- [17].Zamora J, Abraira V, Muriel A, et al. Meta-DiSc: a software for meta-analysis of test accuracy data. BMC Med Res Methodol 2006;6:31. [DOI] [PMC free article] [PubMed] [Google Scholar]
- [18].Dai Y, Chen MH, Fan ZH, et al. Diagnosis of small hepatic nodules detected by surveillance ultrasound in patients with cirrhosis: Comparison between contrast-enhanced ultrasound and contrast-enhanced helical computed tomography. Hepatol Res 2008;38:281–90. [DOI] [PubMed] [Google Scholar]
- [19].Granito A, Galassi M, Piscaglia F, et al. Impact of gadoxetic acid (Gd-EOB-DTPA)-enhanced magnetic resonance on the non-invasive diagnosis of small hepatocellular carcinoma: a prospective study. Aliment Pharmacol Ther 2012;37:355–63. [DOI] [PubMed] [Google Scholar]
- [20].Kan M, Hiraoka A, Uehara T, et al. Evaluation of contrast-enhanced ultrasonography using perfluorobutane (Sonazoid®) in patients with small hepatocellular carcinoma: comparison with dynamic computed tomography. Oncol Lett 2010;1:485–8. [DOI] [PMC free article] [PubMed] [Google Scholar]
- [21].Leoni S, Piscaglia F, Golfieri R, et al. The Impact of vascular and nonvascular findings on the noninvasive diagnosis of small hepatocellular carcinoma based on the EASL and AASLD criteria. Am J Gastroenterol 2010;105:599–609. [DOI] [PubMed] [Google Scholar]
- [22].Quaia E, Alaimo V, Baratella E, et al. The added diagnostic value of 64-row multidetector CT combined with contrast-enhanced US in the evaluation of hepatocellular nodule vascularity: implications in the diagnosis of malignancy in patients with liver cirrhosis. Eur Radiol 2009;19:651–63. [DOI] [PubMed] [Google Scholar]
- [23].Rode A, Bancel B, Douek P, et al. Small nodule detection in cirrhotic livers: evaluation with US, spiral CT, and MRI and correlation with pathologic examination of explanted liver. J Comput Assist Tomogr 2001;25:327–36. [DOI] [PubMed] [Google Scholar]
- [24].Giorgio A, Ferraioli G, Tarantino L, et al. Contrast-enhanced sonographic appearance of hepatocellular carcinoma in patients with cirrhosis: comparison with contrast-enhanced helical CT appearance. Am J Roentgenol 2004;183:1319–26. [DOI] [PubMed] [Google Scholar]
- [25].Krishan A, Mittal D. Detection and classification of liver cancer using CT images. Int J Recent Technol Mech Elect Eng 2015;2:93–8. [DOI] [PubMed] [Google Scholar]
- [26].Piscaglia F, Lencioni R, Sagrini E, et al. Characterization of focal liver lesions with contrast-enhanced ultrasound. Eur Radiol 2003;13(Suppl):531–50. [DOI] [PubMed] [Google Scholar]
- [27].Strobel D, Bernatik T, Blank W, et al. Diagnostic accuracy of CEUS in the differential diagnosis of small (≤20 mm) and subcentimetric (≤10 mm) focal liver lesions in comparison with histology. Results of the DEGUM multicenter trial. Ultraschall in Der Medizin 2011;32:593–7. [DOI] [PubMed] [Google Scholar]
- [28].Kim TK, Lee KH, Khalili K, et al. Hepatocellular nodules in liver cirrhosis: contrast-enhanced ultrasound. Abdom Imaging 2011;36:244–63. [DOI] [PubMed] [Google Scholar]
- [29].Niu Y, Huang T, Lian F, et al. Contrast-enhanced ultrasonography for the diagnosis of small hepatocellular carcinoma: a meta-analysis and meta-regression analysis. Tumour Biol 2013;34:3667–74. [DOI] [PubMed] [Google Scholar]


