Supplemental Digital Content is available in the text
Keywords: fatty liver, identification, non-invasive, prediction models
Abstract
Several prediction models for fatty liver disease (FLD) are available with limited externally validation and less comprehensive evaluation. The aim was to perform external validation and direct comparison of 4 prediction models (the Fatty Liver Index, the Hepatic Steatosis Index, the ZJU index, and the Framingham Steatosis Index) for FLD both in the overall population and the obese subpopulation.
This cross-sectional study included 4247 subjects aged 20 to 65 years recruited from the north of Shanxi Province in China. Anthropometric and biochemical features were collected using standard protocols. FLD was diagnosed by liver ultrasonography. We assessed all models in terms of discrimination, calibration, and decision curve analysis.
The original models performed well in terms of discrimination for the overall population, with the area under the receiver operating characteristic curves (AUCs) around 0.85, while AUCs for obese individuals were around 0.68. Nevertheless, the predicted risks did not match well with the observed risks both in the overall population and the obese subpopulation. The FLI 2006 was 1 of the 2 best models in terms of discrimination (AUCs were 0.87 and 0.72 for the overall population and the obese subgroup, respectively) and had the best performance in terms of calibration, and attained the highest net benefit.
The FLI 2006 is overall the best tool to identify high risk individuals and has great clinical utility. Nonetheless, it does not perform well enough to quantify the actual risk of FLD, which need to be (re)calibrated for clinical use.
1. Introduction
Fatty liver disease (FLD) has estimated prevalence of 25%, 31%, and 24.5% in Canada, United States, and central China,[1–3] respectively. Moreover, nearly two-thirds of patients with obesity and type-2-diabetes mellitus (T2DM) exhibit FLD.[4,5] As a result of the obesity pandemic,[6] incidence of FLD is still rising and is continuously contributing to many chronic diseases.[7–10] Furthermore, the health-care costs for individuals with FLD are 25% higher than those without.[11] Early identification of these individuals could promote more effective interventions to delay the disease process and help prevent FLD-related complications, thereby reducing morbidity and healthcare costs.
Liver biopsy is the gold standard for diagnosing liver steatosis.[12] Nevertheless, it is an invasive and costly technique with a potential sampling variability,[13] which makes it impractical to be used as a screening test for the general population. By contrast, ultrasonography is an easy liver imaging technique and has no known side effects. Therefore, it is routinely performed in clinical practice.[14] Other non-invasive methods, including magnetic resonance imaging (MRI), transient elastography (TE), and computed tomography (CT), are expensive and not readily available, and therefore are not suitable for screening.
Several prediction models have been developed for FLD. Although there have been a few publications that built and externally validated such models, the evaluation of models is often less comprehensive. Only 1 study in Germany has validated 2 models in terms of discrimination and calibration,[15] but clinical utility has not been evaluated to date.[16] In addition, their performance in high-risk individuals who present with obesity has not been validated and compared. Therefore, in this paper, the usefulness of these models in the obese individuals has yet been studied.
We aimed to externally validate and compare the performance of the FLD screening models for all samples and obese subgroup in terms of calibration, discrimination, and clinical utility.
2. Materials and methods
2.1. Population and study design
From July 2013 to December 2013, the subjects of this cross-sectional study were enrolled from a large coalmine group located in the north of Shanxi Province in China, with an estimated 200,000 permanent staff in 87 coalmines. With an expected prevalence of FLD of 31.8%[17] in our population with mostly men coalminers, and an allowable error of 2.9%, a sample size of 4029 was estimated using the PASS software package (version 11.0 for Windows; NCSS LLC: Kaysville, UT).[18] Considering no response or other unknown situations, 4400 participants were recruited. A 2-stage process was used to select the study sample according to the baseline data including sex, date of birth, work type, which was provided by the management of coalmine group. In the first stage, 10 coal mines were randomly selected from the total 87 coal mines as primary sampling unit (PSU). In the second stage, a stratified random sampling method was applied based on the baseline characteristic of sex, age, and work type. Among the sampled participants, 106 were excluded because of uncompleted clinical information. Apart from that, the participants who had missing data on hepatic ultrasonography (n–39), a history of viral hepatitis, autoimmune hepatitis, or other forms of chronic liver disease were excluded (n–8). After removing those individuals, a total of 4247 participants aged 20 to 65 years remained for the statistical analysis.
2.2. Liver ultrasonography
Fatty liver was diagnosed according to the unified criteria proposed by the Chinese Liver Disease Association.[19] Liver ultrasound was assessed by 2 trained and board-certified radiologists who were specialized in hepatic imaging and blinded to clinical assessments and the biochemical analysis results. The high-resolution B-mode tomographic ultrasound system (Esaote Biomedica SpA, Gevona, Italy) with a 3.5-MHz probe, was used to diagnose fatty liver.
2.3. Clinical and laboratory assessments
Anthropometry was conducted by trained and certified investigators using standard protocols and techniques.[20] Weight and height were measured to the nearest 0.1 kg and 0.1 cm, with participants wearing no shoes and light weight clothing. Body mass index (BMI) was calculated as weight (kg) divided by squared height (m2). Waist circumference was measured to the nearest 0.1 cm at the midway between the lowest rib margin and iliac crest. Blood pressure was measured 3 times based on the recommendations for blood pressure[21] and the mean value was used for analysis. Alanine aminotransferase (ALT), aspartate aminotransferase (AST), gamma-glutamyl transpeptidase (GGT), fasting plasma glucose, high density lipoprotein cholesterol levels (HDL-C), triglyceride (TG), and serum cholesterol were measured by the SIEMENS ADVIA 1800 Automatic Biochemical analyzer (JEOL Ltd, Tokyo, Japan) after an overnight fast.
2.4. Definition of obesity, diabetes and hypertension
According to the Chinese Working Group on obesity, BMI <18.5 kg/m2 was considered underweight, 18.5 kg/m2 ≤ BMI < 24 kg/m2 was considered normal, 24 kg/m2 ≤ BMI < 28 kg/m2 was defined as overweight, and BMI ≥ 28 kg/m2 was considered obese.[22] Diabetes was defined as fasting blood glucose ≥126 mg/dL (7.0 mmol/L), or oral glucose tolerance test ≥200 mg/dL (11.1 mmol/L), or HbA1c ≥48 mmol/mol (6.5%) based on the American Diabetes Association 2013 criteria.[23] Patients were considered to have hypertension if they had systolic pressure (SBP) ≥140 mmHg, diastolic pressure (DBP) ≥90 mmHg, or received anti-hypertensive drug therapy.[24]
2.5. Non-invasive prediction models of FLD
We searched PubMed for all studies investigating risk prediction models for the risk of FLD using the following search string: ([“Fatty Liver” OR “Steatohepatitis” OR “Liver Steatosis”] AND [“risk score” OR “prediction model” OR “predictive model” OR “prediction rule” OR “risk assessment” OR “algorithm”]) NOT review [pt] AND English [LA]. The search resulted in 498 matches. Of these, we identified 4 models: the Fatty Liver Index (FLI 2006),[25] the Hepatic Steatosis Index (HSI 2010),[26] the ZJU index (ZJU 2015),[27] and the Framingham Steatosis Index (FSI 2016),[28] that have full prediction rule and consist of commonly used measures. All models were developed outside China, with the exception of ZJU 2015, which was developed on a large population from Zhejiang. Characteristics and equations of these 4 models based on our cohort study are summaries in Supplemental table 1 and Supplemental table 2 respectively.
2.6. Ethical approval
The study protocol was reviewed and approved by Shanxi Medical University Ethics Committee and all participants gave written consent.
2.7. Statistical analysis
We evaluated the predictive performance of the retrieved prediction models using measures of discrimination and calibration.[15,29–31] Discrimination is the ability of a model to distinguish those at high risk of FLD from those at low risk. And it was examined by calculating the area under the receiver operating characteristic (ROC) curve (AUC), with a larger AUC indicating a better prediction model. An AUC of 0.5 reflects no discriminative ability of the model, while 1.0 indicates perfect discrimination. Comparisons between the AUC of FLI2006 and those of the other 3 prediction models were conducted by using the method described by DeLong et al.[32] Sensitivity, specificity, positive and negative predictive value (PPV and NPV, respectively), and their corresponding 95% confidence intervals were estimated after identifying the optimal cut-off point for each ROC curve using the Youden index. Calibration indicates the agreement between the predicted risks and the observed frequencies of FLD and is commonly examined by calibration plots.[33] Flexible calibration curves can be generated based on nonparametric loess smoother. For a perfectly calibrated model, the predicted risks equal the observed frequencies for all groups (normally 10 groups) of predicted risks and the calibration plot follows the 45° straight line.[34] We also used the calibration intercept and slope to assess calibration. The calibration slope was estimated in the validation set by fitting a logistic regression model with the absence or the presence of FLD as the outcome variable and the linear predictor of the original prediction model as the independent variable. The calibration intercept was obtained using a logistic regression model with the regression coefficient of the linear predictor fixed at 1, that is, calibration-in-the-large. A calibration intercept of less than 0 indicates that the model's predicted probabilities in the validation set are systematically too high whereas an intercept of greater than 0 indicates too low. A calibration slope of smaller than 1 indicates the original prediction model is over-fitting the data whereas a slope of greater than 1 indicates under-fitting.[31] Additionally, the Hosmer–Lemeshow test[35] results were provided to show the difference of goodness of fit between these 4 models. Differences in the incidence of FLD between the development populations and an independently external validation population can lead to significant deviation between the predicted risks and the observed frequencies of FLD in the validation population.[36,37] For fair comparison, we recalibrated each prediction model by multiplying regression coefficients of the original model with the calibration slope and adding the calibration intercept to the intercept of the original prediction model.[38–40]
Decision curve analysis was performed to assess the clinical usefulness of our prediction models.[41] The analysis investigated potential clinical effects of prediction models by reporting its net benefit in comparison to the 2 alternative strategies: test all or test none. The model that has the highest net benefit is the most clinically useful model. If a model has the net benefit below the 2 alternative strategies, then using the model in clinical decision making can be considered as clinically harmful.
Finally, we validated the performance of these 4 models using 10-fold cross-validation,[30] which split the dataset into 10 subsets with each subset used once as the validation set and the remaining sets used as training.
To gauge the predictive performance of all screened models of obese individuals—the well-established high-risk population of FLD, we also validated and compared models’ performance in the obese subgroup.
All data were double-entered and managed by Epi info version 3.5.1 (CDC, Atlanta, GA). Statistical analyses were conducted with SAS 9.2 software (SAS Institute, Inc., Cary, NC) and R 3.2.4 for Windows (http://cran.r-project.org). A P value <.05 was considered statistically significant.
3. Results
3.1. Characteristics of study participants
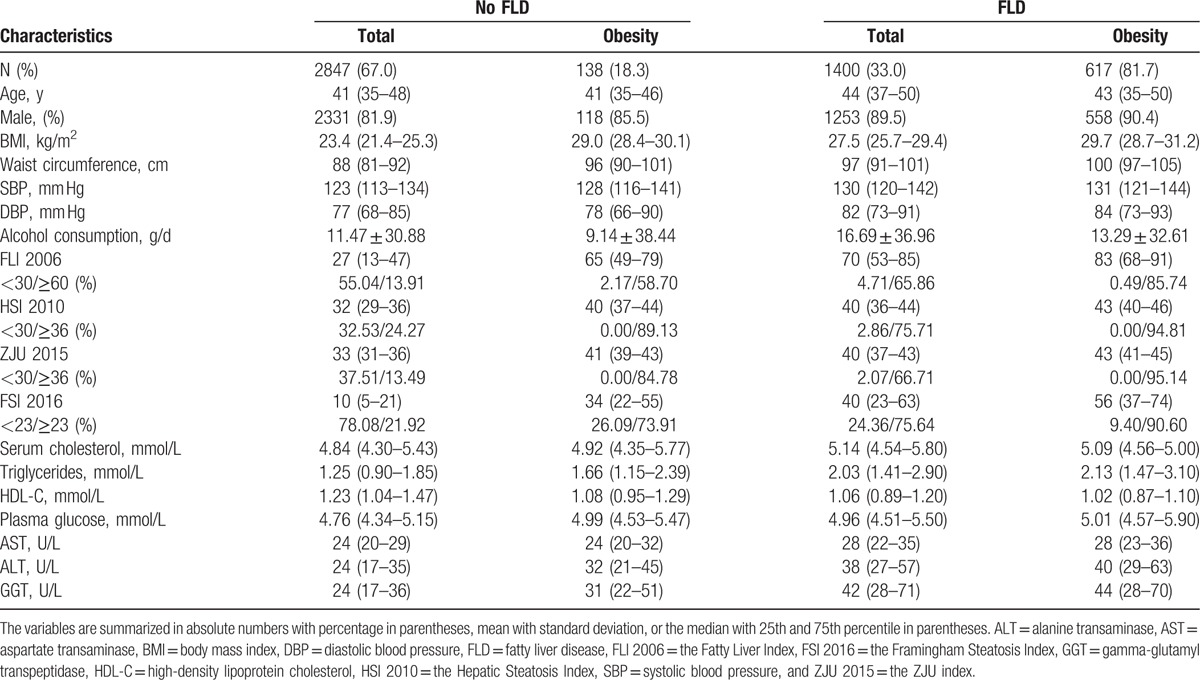
We studied 4247 subjects, including 755 obese individuals. The prevalence of ultrasonography-diagnosed FLD was 32.9% in our total dataset, while it was 81.7% in the obese subpopulation (Table 1). The proportion of subjects whose fatty liver scores were higher and lower than the cutoff points suggested in the original literature was also provided in Table 1.
Table 1.
Descriptive characteristics of participants with and without fatty liver disease (FLD).
3.2. Discrimination and calibration performance of 4 models
The original models performed well in terms of discriminative ability for the overall population, with AUC ranged from 0.83 (95% confidence interval from 0.82 to 0.84) to 0.87 (95% confidence interval from 0.86 to 0.88) (Table 2). AUC of FLI 2006 was significantly higher than those of HSI 2010 and FSI 2016 (P < .001), while it was not significantly different from the AUC of ZJU 2015 (Table 3). However, for obese individuals, all models attained low discriminative ability, with AUC ranged from 0.64 (95% confidence interval from 0.59 to 0.69) to 0.72 (95% confidence interval from 0.67 to 0.77). AUCs of HSI 2010 and ZJU 2015 were significantly lower than that of FLI 2006 (P < .05). After 10-fold cross-validation, AUCs of these 4 prediction models in the obese subgroup were 0.71, 0.62, 0.67, and 0.68, respectively, while AUCs of the overall population remained 0.87, 0.83, 0.87, and 0.85, respectively (Supplemental table 3). Similar performance was yielded at the optimal cutoff point for these 4 models (Table 4). The PPV for predicting FLD of these 4 models ranged from 60% to 64% and the NPV ranged from 87% to 89% for the overall population, with overlapping 95% CI. The recalibrating method that we used did not change the rank of the risk scores of FLD, and thus do not affect a model's discriminative ability. That is, the recalibrated models had the same AUC as the original prediction models. The 2 models with the highest AUC (i.e., FLI 2006, ZJU2015) included triglycerides, BMI, GGT, waist circumference, ALT, AST, fasting plasma glucose as predictors. The models with low accuracy were the models with few predictors (i.e., HSI 2010).
Table 2.
Discriminative ability of prediction models in predicting fatty liver disease (FLD).
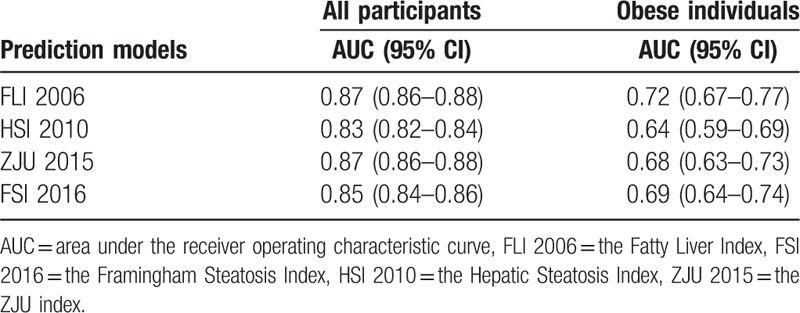
Table 3.
Comparisons of the area under the receiver operating characteristic curve (AUC).

Table 4.
Diagnostic performance of prediction models for the optimal cut-off value.

All other models overestimated the predicted risks of FLD (Fig. 1A–C the calibration intercepts, given the slope of 1, were −0.661, −1.998, and −1.250 for FLI 2006, HSI 2010, ZJU 2015, respectively), with the exception of the model FSI 2016, which estimated lower risk and had a calibration intercepts of 0.540. Furthermore, HSI 2010 had an extreme performance (calibration slope = 0.654). The calibration plots in Fig. 1 compared the predicted risks with the observed risks. The Hosmer–Lemeshow goodness-of-fit tests of the 4 models were statistically significant (P < .001) in the overall population (Table 5). This may not be surprising. Significance can be achieved even for very small differences only because of large sample sizes.[42–44] From considerable differences in the chi-squared values derived from the goodness-of-fit tests, it can be seen that calibration characteristics were best for FLI 2006 and poorest for HSI 2010 (with chi-squared values of 39.13 and 188.33, respectively). After adjusted for difference in the incidence of FLD between our external validation cohort and the development populations, all prediction models resulted in improved calibration (Supplemental figure 1a–d), compared with the original models. Because our dataset was also used to recalibrate the original models, intercepts and slopes of the recalibrated models were always equal to 0 and 1, respectively.[38] The calibration plots of FLI 2006 and ZJU 2015 were close to the ideal line throughout the risk spectrum for the recalibrated models, whereas the model HSI 2010 had sporadic overestimation and underestimation. When applied to obese subgroup, the FLI 2006 and ZJU 2015 models had acceptable calibration (Fig. 2A, C), as evidenced by the calibration plots, and the calibration intercepts, given slope = 1, were 0.425 and −0.627, respectively. However, the HSI 2010 and FSI 2016 models had poor calibration (Fig. 2B, D). All models showed no significant difference (P > .05) between the percentage of observed and predicted risk with the Hosmer–Lemeshow goodness-of-fit tests in the obese individuals. And the calibration characteristics remained best for FLI 2006 (with chi-squared value of 2.36) in the obese subgroup. Calibration of all recalibrated models was good in the obese subgroup (Supplemental figure 1e–h).
Figure 1.
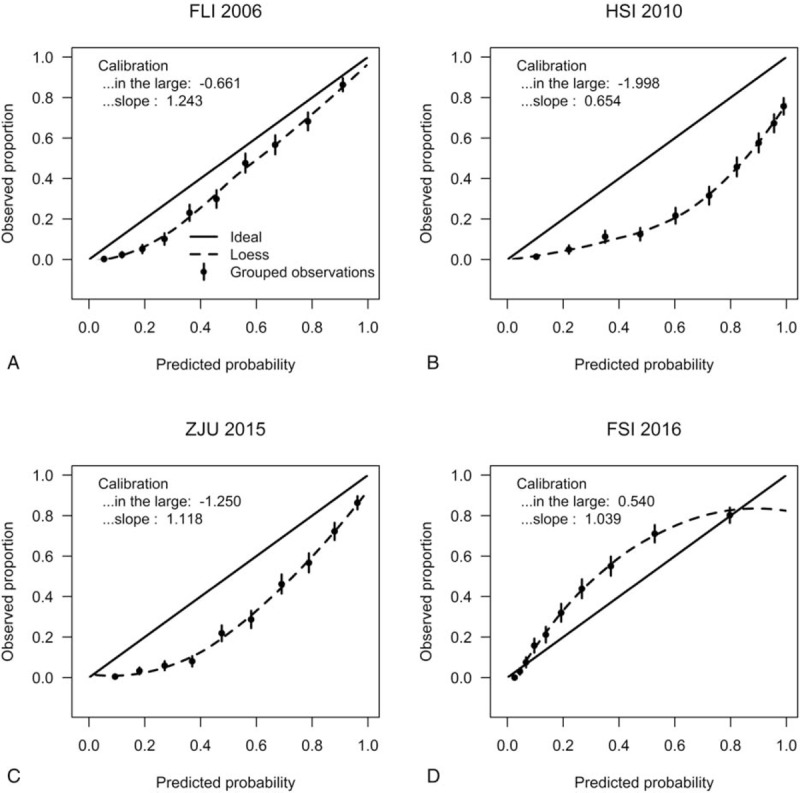
Calibration plots for the 4 prediction models for fatty liver disease (FLD) in the overall population. In case of perfect calibration, all groups of predicted probabilities are close to the diagonal dashed line. Vertical lines in grouped observations represent 95% confidence intervals. FLI 2006 = the Fatty Liver Index, FSI 2016 = the Framingham Steatosis Index, HSI 2010 = the Hepatic Steatosis Index, ZJU 2015 = the ZJU index.
Table 5.
Hosmer–Lemeshow goodness-of-fit (GOF) of prediction models in predicting fatty liver disease (FLD).
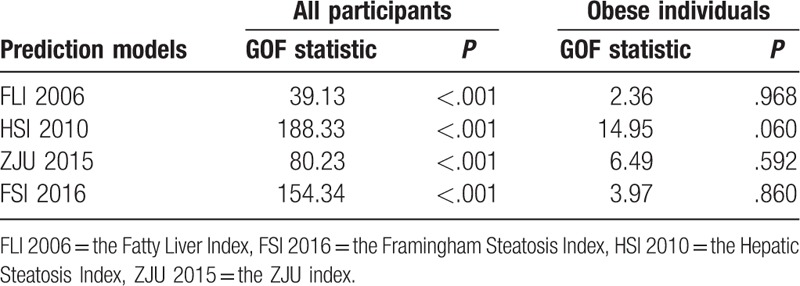
Figure 2.
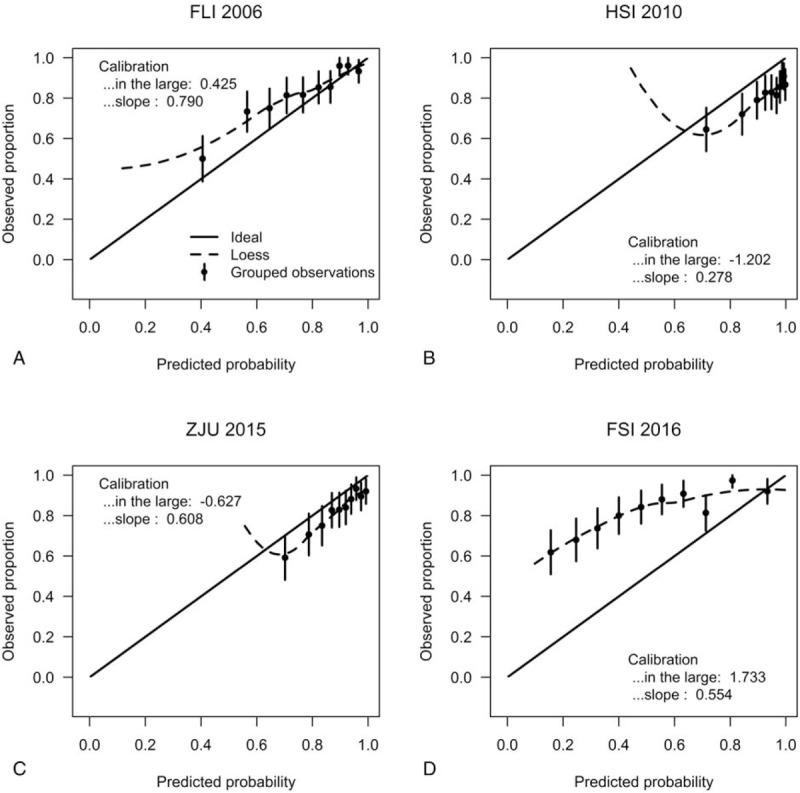
Calibration plots for the 4 prediction models for fatty liver disease (FLD) in the obese subpopulation. In case of perfect calibration, all groups of predicted probabilities are close to the diagonal dashed line. Vertical lines in grouped observations represent 95% confidence intervals. FLI 2006 = the Fatty Liver Index, FSI 2016 = the Framingham Steatosis Index, HSI 2010 = the Hepatic Steatosis Index, ZJU 2015 = the ZJU index.
3.3. Decision curve analysis
In the overall population, the FLI 2006 and ZJU 2015 models provided better net benefit compared with the other 2 models. We also found all 4 models outperformed an alternative strategy that tests all individuals (Fig. 3A). In addition, the decision curve for the model FLI 2006 showed a positive net benefit across all risk thresholds, while all other 3 models had lower net benefit than the alternative strategy “test none” for a subset of risk thresholds. For the obese participants, the FLI 2006 had the best performance (Fig. 3B). Its net benefit was greater than all other models and greater than the 2 alternative strategies.
Figure 3.
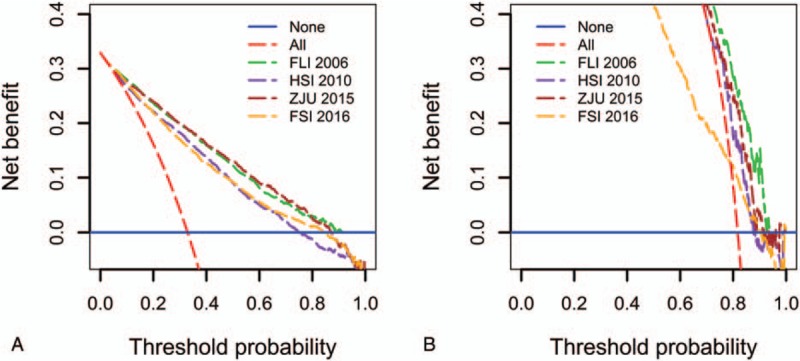
Decision curve analysis of the 4 prediction models for fatty liver disease (FLD) in the overall population (A) and the obese subpopulation (B). The solid blue line corresponds to the net benefit when no participant has FLD, while the red dashed line corresponds to the net benefit when all participants have FLD. The preferred model is the model with the highest net benefit at any given threshold. FLI 2006 = the Fatty Liver Index, FSI 2016 = the Framingham Steatosis Index, HSI 2010 = the Hepatic Steatosis Index, ZJU 2015 = the ZJU index.
4. Discussion
Our study has compared and externally validated accuracy and clinically utility of 4 prediction models for FLD in all 4247 samples, as well as the obese subpopulation. All 4 models discriminated well between individuals with FLD and those without in our population-based cohort, but calibration of all models was low. Among all 4 models, the FLI 2006 attained best performed with the highest discriminative ability and being clinically useful across all risk thresholds.
Our findings are similar to other external validation studies, all of which consistently show that the FLI 2006 perform well to identify those at high risk of fatty liver or nonalcoholic fatty liver disease, with AUCs over 0.785.[15,45–49] Furthermore, 4 previous studies[15,27,47,50] have externally validated the FLI 2006 and HSI 2010 models simultaneously and reported high AUCs (ranged from 0.732 to 0.890). These studies also showed that overall the FLI 2006 model had slightly better performance. It should be noted that the AUC of FLI 2006 in our study (0.87) was even higher than the AUC in the original population (0.84). This might be explained by different variable distributions between 2 populations.[40] For example, differences between variables like sex, age, and BMI in a externally validation study can in some situations lead to a higher AUC than in the original study. Additionally, the same calibration problem of the FLI 2006 and HSI 2010 models were found by Meffert et al.[15] The predicted risks in a new population can be different substantially from the observed risks, resulting in systematically overestimation or underestimation.[37] This may arise from the new population's characteristics that are not included in the prediction models, but indeed exercise an effect on the regression coefficients in the original model.[38] Apart from that, different study designs may be also responsible for the poor calibration. The FSI 2016 model, developed from a cross-sectional population, underestimated the risk, whereas other 3 case-control-based models tended to overestimate when applied to a general population. After correction of the models for differences in incidence of FLD between the development and validation populations, all prediction models resulted in good calibration.
Our study has 2 key strengths. Firstly, the external validation study is based on a large sample with standardized demographic, anthropometric, and laboratory measures. Secondly, our study is one of the first studies to validate and compared models for both population-based and obese-subgroup-based FLD screening in terms of calibration, discrimination, and clinical usefulness.
Nevertheless, there are some limitations of our study. Firstly, the diagnosis of FLD was based on the hepatic ultrasound method instead of liver biopsy. However, it is impractical to use liver biopsy as a screening test for a large numbers of individuals, therefore ultrasonography remains the first-line imaging technique for FLD in clinical practice.[51] Secondly, we lack information on viral hepatitis status and 8 participants were excluded because of the self-reported presence of hepatitis B surface antigen or anti-hepatitis C virus antibodies, which could be a source of misclassification. Nevertheless, the seropositivity of hepatitis B and C is low for the general population in North China (ranged from 2.74% to 6.1% and 1.1% to 3.0%, respectively), so the possibility of confounding due to viral hepatitis in our population is low.[52–54]
In conclusion, after recalibration, the FLI 2006 model reached high performance in our population. The FLI 2006 model consists of common predictors: triglycerides, BMI, GGT, waist circumference, and are easy to apply in clinical practice. This study underlines the need for ongoing (re)calibration of prediction models for their clinical use.
Acknowledgments
Authors would like to thank all coalmine workers who participated in our study. We also thank all interviewers for their assistance with data collections.
Supplementary Material
Footnotes
Abbreviations: ALT = alanine transaminase, AST = aspartate transaminase, AUC = area under the receiver operating characteristic curve, BMI = body mass index, DBP = diastolic blood pressure, FLD = fatty liver disease, FLI 2006 = the Fatty Liver Index, FSI 2016 = the Framingham Steatosis Index, GGT = gamma-glutamyl transpeptidase, HDL-C = high-density lipoprotein cholesterol, HSI 2010 = the Hepatic Steatosis Index, NPV = negative predictive value, PPV = positive predictive value, SBP = systolic blood pressure, ZJU 2015 = the ZJU index.
The study has been conducted with the support of the National Natural Science Foundation of China (item number: 81473073).
The authors have no conflicts of interest to disclose.
Supplemental Digital Content is available for this article.
References
- [1].Wells MM, Li Z, Addeman B, et al. Computed tomography measurement of hepatic steatosis: prevalence of hepatic steatosis in a Canadian population. Can J Gastroenterol Hepatol 2016;2016:4930987. [DOI] [PMC free article] [PubMed] [Google Scholar]
- [2].Browning JD, Szczepaniak LS, Dobbins R, et al. Prevalence of hepatic steatosis in an urban population in the United States: impact of ethnicity. Hepatology 2004;40:1387–95. [DOI] [PubMed] [Google Scholar]
- [3].Wang Z, Xia B, Ma C, et al. Prevalence and risk factors of fatty liver disease in the Shuiguohu district of Wuhan city, central China. Postgrad Med J 2007;83:192–5. [DOI] [PMC free article] [PubMed] [Google Scholar]
- [4].Targher G, Bertolini L, Padovani R, et al. Prevalence of nonalcoholic fatty liver disease and its association with cardiovascular disease among type 2 diabetic patients. Diabetes Care 2007;30:1212–8. [DOI] [PubMed] [Google Scholar]
- [5].Leite NC, Salles GF, Araujo AL, et al. Prevalence and associated factors of non-alcoholic fatty liver disease in patients with type-2 diabetes mellitus. Liver Int 2009;29:113–9. [DOI] [PubMed] [Google Scholar]
- [6].Kelly T, Yang W, Chen CS, et al. Global burden of obesity in 2005 and projections to 2030. Int J Obes (Lond) 2008;32:1431–7. [DOI] [PubMed] [Google Scholar]
- [7].Pearlman M, Loomba R. State of the art: treatment of nonalcoholic steatohepatitis. Curr Opin Gastroenterol 2014;30:223–37. [DOI] [PubMed] [Google Scholar]
- [8].Yeung EN, Treskes P, Martin SF, et al. Fibrinogen production is enhanced in an in-vitro model of non-alcoholic fatty liver disease: an isolated risk factor for cardiovascular events? Lipids Health Dis 2015;14:86. [DOI] [PMC free article] [PubMed] [Google Scholar]
- [9].Ozturk K, Uygun A, Guler AK, et al. Nonalcoholic fatty liver disease is an independent risk factor for atherosclerosis in young adult men. Atherosclerosis 2015;240:380–6. [DOI] [PubMed] [Google Scholar]
- [10].Chung GE, Choi SY, Kim D, et al. Nonalcoholic fatty liver disease as a risk factor of arterial stiffness measured by the cardioankle vascular index. Medicine (Baltimore) 2015;94:e654. [DOI] [PMC free article] [PubMed] [Google Scholar]
- [11].Baumeister SE, Volzke H, Marschall P, et al. Impact of fatty liver disease on health care utilization and costs in a general population: a 5-year observation. Gastroenterology 2008;134:85–94. [DOI] [PubMed] [Google Scholar]
- [12].Chalasani N, Younossi Z, Lavine JE, et al. The diagnosis and management of non-alcoholic fatty liver disease: practice Guideline by the American Association for the Study of Liver Diseases, American College of Gastroenterology, and the American Gastroenterological Association. Hepatology 2012;55:2005–23. [DOI] [PubMed] [Google Scholar]
- [13].Grandison GA, Angulo P. Can NASH be diagnosed, graded, and staged noninvasively? Clin Liver Dis 2012;16:567–85. [DOI] [PMC free article] [PubMed] [Google Scholar]
- [14].Chalasani N, Younossi Z, Lavine JE, et al. The diagnosis and management of non-alcoholic fatty liver disease: practice guideline by the American Gastroenterological Association, American Association for the Study of Liver Diseases, and American College of Gastroenterology. Gastroenterology 2012;142:1592–609. [DOI] [PubMed] [Google Scholar]
- [15].Meffert PJ, Baumeister SE, Lerch MM, et al. Development, external validation and comparative assessment of a new diagnostic score for hepatic steatosis. Am J Gastroenterol 2014;109:1404–14. [DOI] [PubMed] [Google Scholar]
- [16].Steyerberg EW, Vergouwe Y. Towards better clinical prediction models: seven steps for development and an ABCD for validation. Eur Heart J 2014;35:1925–31. [DOI] [PMC free article] [PubMed] [Google Scholar]
- [17].Wang Z, Xu M, Hu Z, et al. Sex-specific prevalence of fatty liver disease and associated metabolic factors in Wuhan, south central China. Eur J Gastroenterol Hepatol 2014;26:1015–21. [DOI] [PubMed] [Google Scholar]
- [18].Newcombe RG. Two-sided confidence intervals for the single proportion: comparison of seven methods. Stat Med 1998;17:857–72. [DOI] [PubMed] [Google Scholar]
- [19].Fan JG, Jia JD, Li YM, et al. Guidelines for the diagnosis and management of nonalcoholic fatty liver disease: update 2010: (published in Chinese on Chinese Journal of Hepatology 2010;18:163-166). J Dig Dis 2011;12:38–44. [DOI] [PubMed] [Google Scholar]
- [20].Physical status: the use and interpretation of anthropometry. Report of a WHO Expert Committee. World Health Organ Tech Rep Ser 1995;854:1–452. [PubMed] [Google Scholar]
- [21].Pickering TG, Hall JE, Appel LJ, et al. Recommendations for blood pressure measurement in humans and experimental animals: part 1: blood pressure measurement in humans: a statement for professionals from the Subcommittee of Professional and Public Education of the American Heart Association Council on High Blood Pressure Research. Circulation 2005;111:697–716. [DOI] [PubMed] [Google Scholar]
- [22].Zhou BF. Predictive values of body mass index and waist circumference for risk factors of certain related diseases in Chinese adults—study on optimal cut-off points of body mass index and waist circumference in Chinese adults. Biomed Environ Sci 2002;15:83–96. [PubMed] [Google Scholar]
- [23].Standards of medical care in diabetes–2013. Diabetes Care 2013;36(Suppl):S11–66. [DOI] [PMC free article] [PubMed] [Google Scholar]
- [24].Liu LS. [2010 Chinese guidelines for the management of hypertension]. Zhonghua Xin Xue Guan Bing Za Zhi 2011;39:579–615. [PubMed] [Google Scholar]
- [25].Bedogni G, Bellentani S, Miglioli L, et al. The Fatty Liver Index: a simple and accurate predictor of hepatic steatosis in the general population. BMC Gastroenterol 2006;6:33. [DOI] [PMC free article] [PubMed] [Google Scholar]
- [26].Lee JH, Kim D, Kim HJ, et al. Hepatic steatosis index: a simple screening tool reflecting nonalcoholic fatty liver disease. Dig Liver Dis 2010;42:503–8. [DOI] [PubMed] [Google Scholar]
- [27].Wang J, Xu C, Xun Y, et al. ZJU index: a novel model for predicting nonalcoholic fatty liver disease in a Chinese population. Sci Rep 2015;5:16494. [DOI] [PMC free article] [PubMed] [Google Scholar]
- [28].Long MT, Pedley A, Colantonio LD, et al. Development and validation of the Framingham Steatosis index to identify persons with hepatic steatosis. Clin Gastroenterol Hepatol 2016;14:1172–80. [DOI] [PMC free article] [PubMed] [Google Scholar]
- [29].Steyerberg EW. Clinical Prediction Models. New York: Springer; 2009. [Google Scholar]
- [30].Altman DG, Vergouwe Y, Royston P, et al. Prognosis and prognostic research: validating a prognostic model. BMJ 2009;338:b605. [DOI] [PubMed] [Google Scholar]
- [31].Su TL, Jaki T, Hickey GL, et al. A review of statistical updating methods for clinical prediction models. Stat Methods Med Res 2016;0:1–6. [DOI] [PubMed] [Google Scholar]
- [32].DeLong ER, DeLong DM, Clarke-Pearson DL. Comparing the areas under two or more correlated receiver operating characteristic curves: a nonparametric approach. Biometrics 1988;44:837–45. [PubMed] [Google Scholar]
- [33].Abbasi A, Peelen LM, Corpeleijn E, et al. Prediction models for risk of developing type 2 diabetes: systematic literature search and independent external validation study. BMJ 2012;345:e5900. [DOI] [PMC free article] [PubMed] [Google Scholar]
- [34].Van Calster B, Nieboer D, Vergouwe Y, et al. A calibration hierarchy for risk models was defined: from utopia to empirical data. J Clin Epidemiol 2016;74:167–76. [DOI] [PubMed] [Google Scholar]
- [35].Hosmer DW, Lemeshow S. Applied Logistic Regression. 2nd ed.New York: Wiley; 2000. [Google Scholar]
- [36].Janssen KJ, Vergouwe Y, Kalkman C J, et al. A simple method to adjust clinical prediction models to local circumstances. Can J Anaesth 2009;56:194–201. [DOI] [PMC free article] [PubMed] [Google Scholar]
- [37].Steyerberg EW, Borsboom GJ, van Houwelingen HC, et al. Validation and updating of predictive logistic regression models: a study on sample size and shrinkage. Stat Med 2004;23:2567–86. [DOI] [PubMed] [Google Scholar]
- [38].Janssen KJ, Moons KG, Kalkman CJ, et al. Updating methods improved the performance of a clinical prediction model in new patients. J Clin Epidemiol 2008;61:76–86. [DOI] [PubMed] [Google Scholar]
- [39].van Houwelingen HC. Validation, calibration, revision and combination of prognostic survival models. Stat Med 2000;19:3401–15. [DOI] [PubMed] [Google Scholar]
- [40].Vergouwe Y, Moons KG, Steyerberg EW. External validity of risk models: Use of benchmark values to disentangle a case-mix effect from incorrect coefficients. Am J Epidemiol 2010;172:971–80. [DOI] [PMC free article] [PubMed] [Google Scholar]
- [41].Vickers AJ, Elkin EB. Decision curve analysis: a novel method for evaluating prediction models. Med Decis Making 2006;26:565–74. [DOI] [PMC free article] [PubMed] [Google Scholar]
- [42].Livingston BM, MacKirdy FN, Howie JC, et al. Assessment of the performance of five intensive care scoring models within a large Scottish database. Crit Care Med 2000;28:1820–7. [DOI] [PubMed] [Google Scholar]
- [43].Kramer AA, Zimmerman JE. Assessing the calibration of mortality benchmarks in critical care: the Hosmer-Lemeshow test revisited. Crit Care Med 2007;35:2052–6. [DOI] [PubMed] [Google Scholar]
- [44].The ASA's statement on p-values: context, process, and purpose. Am Stat 2016;70:129–33. [Google Scholar]
- [45].Huang X, Xu M, Chen Y, et al. Validation of the fatty liver index for nonalcoholic fatty liver disease in middle-aged and elderly Chinese. Medicine (Baltimore) 2015;94:e1682. [DOI] [PMC free article] [PubMed] [Google Scholar]
- [46].Yang BL, Wu WC, Fang KC, et al. External validation of fatty liver index for identifying ultrasonographic fatty liver in a large-scale cross-sectional study in Taiwan. PLoS One 2015;10:e120443. [DOI] [PMC free article] [PubMed] [Google Scholar]
- [47].Fedchuk L, Nascimbeni F, Pais R, et al. Performance and limitations of steatosis biomarkers in patients with nonalcoholic fatty liver disease. Aliment Pharmacol Ther 2014;40:1209–22. [DOI] [PubMed] [Google Scholar]
- [48].Koehler EM, Schouten JN, Hansen BE, et al. External validation of the fatty liver index for identifying nonalcoholic fatty liver disease in a population-based study. Clin Gastroenterol Hepatol 2013;11:1201–4. [DOI] [PubMed] [Google Scholar]
- [49].Kim JH, Kwon SY, Lee SW, et al. Validation of fatty liver index and lipid accumulation product for predicting fatty liver in Korean population. Liver Int 2011;31:1600–1. [DOI] [PubMed] [Google Scholar]
- [50].Cheung CL, Lam KS, Wong IC, et al. Non-invasive score identifies ultrasonography-diagnosed non-alcoholic fatty liver disease and predicts mortality in the USA. BMC Med 2014;12:154. [DOI] [PMC free article] [PubMed] [Google Scholar]
- [51].Ratziu V, Bellentani S, Cortez-Pinto H, et al. A position statement on NAFLD/NASH based on the EASL 2009 special conference. J Hepatol 2010;53:372–84. [DOI] [PubMed] [Google Scholar]
- [52].Gao P, Wang H, Chen WX, et al. [A sero-epidemiological study of hepatitis B among general population in Beijing]. Zhonghua Liu Xing Bing Xue Za Zhi 2016;37:658–62. [DOI] [PubMed] [Google Scholar]
- [53].Zhang Q, Qi W, Wang X, et al. Epidemiology of Hepatitis B and Hepatitis C infections and benefits of programs for hepatitis prevention in Northeastern China: a cross-sectional study. Clin Infect Dis 2016;62:305–12. [DOI] [PubMed] [Google Scholar]
- [54].Niu Z, Zhang P, Tong Y. Age and gender distribution of Hepatitis C virus prevalence and genotypes of individuals of physical examination in WuHan, Central China. Springerplus 2016;5:1557. [DOI] [PMC free article] [PubMed] [Google Scholar]
Associated Data
This section collects any data citations, data availability statements, or supplementary materials included in this article.


