

Abstract
Mass spectrometry-based targeted proteomics (e.g., selected reaction monitoring, SRM) is emerging as an attractive alternative to immunoassays for protein quantification. Recently we have made significant progress in SRM sensitivity for enabling quantification of low nanograms per milliliter to sub-naograms per milliliter level proteins in nondepleted human blood plasma/serum without affinity enrichment. However, precise quantification of extremely low abundance proteins (e.g., ≤ 100 pg/mL in blood plasma/serum) using targeted proteomics approaches still remains challenging, especially for these samples without available antibodies for enrichment. To address this need, we have developed an antibody-independent deep-dive SRM (DD-SRM) approach that capitalizes on multidimensional high-resolution reversed-phase liquid chromatography (LC) separation for target peptide separation and enrichment combined with precise selection of target peptide fractions of interest, significantly improving SRM sensitivity by ~5 orders of magnitude when compared to conventional LC-SRM. Application of DD-SRM to human serum and tissue provides precise quantification of endogenous proteins at the ~10 pg/mL level in nondepleted serum and at <10 copies per cell level in tissue. Thus, DD-SRM holds great promise for precisely measuring extremely low abundance proteins or protein modifications, especially when high-quality antibodies are not available.
Graphical abstract
Mass spectrometry (MS)-based targeted proteomics (e.g., selected reaction monitoring (SRM)) has been proved as a powerful tool for quantitative protein analysis due to its high specificity/selectivity, reproducibility, accuracy, and multiplexing capabilities.1–4 It has therefore been widely used in systems biology and biomarker development studies.5–7 Compared with traditional antibody-based methods, such as ELISA and Western blotting, SRM has been demonstrated to provide comparable or better quantitative results. 8–10 In addition, SRM can quantify site-specific protein isoforms, protein truncation, and post-translational modifications (PTMs) from which antibodies often cannot distinguish with high specificity.9,11,12 However, SRM still suffers from insufficient sensitivity for precise quantification of low-abundance proteins in complex biological samples such as human blood plasma/serum or tissues. Conventional LC-SRM has a good linearity for protein concentrations at the range of ~4–5 orders of magnitude but only allows quantification of proteins at micrograms per milliliter levels in plasma/serum without immunoaffinity depletion of high-abundance proteins or other front-end sample processing.13,14
To achieve highly sensitive quantification of target proteins in complex biological samples, sample prefractionation/enrichment using either chromatography or antibody-based enrichment is often required to reduce sample complexity.3,15,16 Immunoaffinity depletion of high-abundance proteins from human biofluids is the most commonly used method, which allows a 10- to 20-fold improvement of SRM sensitivity depending on the type of depletion columns used, with the limit of detection (LOD) and limit of quantification (LOQ) at the protein concentration range of 25–100 ng/mL in blood plasma.1,17 To further improve SRM sensitivity, after immunoaffinity depletion other fractionation approaches such as strong cation exchange (SCX) chromatography are employed, achieving low nanograms per milliliter levels of SRM sensitivity in blood plasma/serum.1,18 However, immunoaffinity depletion of high-abundance proteins may affect quantification accuracy due to nonspecific binding of target proteins. Antibody-based affinity enrichment (e.g., stable isotope standards and capture by anti-peptide antibodies, or SISCAPA), when coupled to SRM, enables quantification of target proteins at low nanograms per milliliter levels in human plasma using a relatively small volume (~10 μL) of plasma sample,19 or ~100 pg/mL levels when the sample volume was increased to 1 ml.3 However, this method shares typical shortcomings of the antibody-based methods (e.g., relatively low multiplexing, unavailability of antibodies for many proteins, difficulties in generating high-quality antibodies for protein modifications, or isoforms).3,9 Recently, we developed an antibody-independent targeted MS method PRISM-SRM (high-pressure, high-resolution separations with intelligent selection and multiplexing SRM) which utilizes effective chromatographic enrichment for highly sensitive quantification of target proteins in complex samples.15,20 PRISM-SRM enables quantification of plasma proteins at the 50–100 pg/mL levels when combined with IgY14 depletion, or at sub-nanogram per milliliter to low nanograms to milliliter levels without immunoaffinity depletion.15,21 Despite all the aforementioned advances, precise targeted quantification of extremely low abundance proteins still remains a formidable challenge, especially for those proteins without available high-quality antibodies.
To address this need, we developed an antibody-independent deep-dive (DD)-SRM approach that capitalizes on two-dimensional (2D) high-resolution reversed-phase liquid chromatography (RPLC) separations prior to the final LC-SRM analysis for significantly increased sample loading, highly effective target peptide enrichment, and SRM online monitoring for precise selection of target peptide fractions of interest. DD-SRM was demonstrated to enable quantification of target proteins at ~10 pg/mL levels in blood plasma/serum and <10 protein copies per cell in human tissue. In contrast to other sensitive targeted proteomics approaches (e.g., SISCAPA-SRM) which rely on affinity enrichment to achieve ~100 pg/mL level sensitivity in human blood, DD-SRM is fully independent of affinity reagents but with ~10-fold higher sensitivity. Therefore, we envision that DD-SRM will have broad applications in precise quantification of extremely low abundance but functionally important proteins or PTMs in any sample types (e.g., plant and exotic species) that cannot be accessed by currently available methods.
MATERIALS AND METHODS
Materials
Urea, dithiothreitol (DTT), iodoacetamide, ammonium formate, trifluoroacetic acid (TFA), and formic acid (FA) were obtained from Sigma (St. Louis, MO, USA). Trypsin enzyme was purchased from Promega Corp. (Madison, WI, USA). Pure synthetic heavy peptides labeled with 13C/15N on C-terminal lysine and arginine (>97% in peptide purity and >99% in isotopic purity) and the unlabeled counterparts were from Thermo Scientific (San Jose, CA, USA). Human prostate specific antigen (PSA) protein was purchased from Sigma-Aldrich.
Samples
Pooled human female sera were purchased from BioChemed Services (Wincheser, VA, USA) and BioreclamationIVT (Baltimore, MD, USA). Clinical serum samples from sepsis patients were obtained from BioChemed Services. Human ovarian tumor samples were obtained from Oregon Health and Science University. The use of human samples was approved by the Institutional Review Boards of the Pacific Northwest National Laboratory in accordance with federal regulations.
SRM Assay Configuration
The selection of surrogate peptides for the target proteins, screening and characterization of the synthesized peptides, and selection of SRM transitions and optimization of collision energy followed the same methods as described in our previous studies.15,21
Serum Digestion and Response Curve Experiments
Human serum samples were subjected to trypsin digestion using the same method as described previously.21 The digested peptide concentration was measured using the BCA assay. For the response curve experiments, stocks of PSA protein digest were spiked into the digest of the pooled human female serum at concentrations of 0, 0.01, 0.025, 0.05, 0.1, 0.5, 1.0, 10.0, and 100.0 ng/mL; the pure synthetic PSA heavy peptide standards were spiked into the samples at a fixed amount of 100 fmol. The details about the sample preparation were described in Supporting Information section S1.1.
Tissue Sample Preparation
Ovarian tumors were homogenized and lysed in the lysis buffer (8 M urea, 60 mM NH4HC03, pH 8; 1 × Halt phosphatase inhibitor was also added as part of our standard procedure, but it is not required for the present study). After centrifugation at a speed of 15000g for 30 min at 4 °C, the supernatant was transferred to another vial. Protein concentration was measured using the BCA assay. The resulting ovarian tumor protein samples were then digested using the same method that was used for human serum. After digestion, pure heavy internal standard peptides with known concentrations were spiked into 1 mg of tissue digests for DD-SRM analysis.
Target Peptide Separation by Offline 2D-RPLC
In the first-dimension RPLC separation, a high-flow ACQUITY UPLC system (Waters Corp., Milford, MA, USA) was used with low-pH buffer A (0.1% FA in water) and buffer B (0.1% FA in 90% acetonitrile). Peptide mixtures were separated on a 4.6 mm inner diameter (i.d.) × 150 mm length, 2.5 μm C18 column (Waters) at a flow rate of 0.7 mL/min, using a 90 min gradient (3 min, 2% B; 7 min, 5% B; 20 min, 10% B; 60 min, 20% B; 70 min, 28% B; 85 min, 50% B; 90 min, 95% B). The eluent from the high-flow RPLC column was split into two flow streams (1:250 split ratio of flow rates) via a Tee union. The smaller fraction of eluent was sent to a TSQ Quantum Ultra triple quadrupole mass spectrometer (Thermo Scientific) for online SRM monitoring of landmark albumin peptides and the spiked-in heavy internal standard peptides. TSQ Quantum Ultra was operated with ion spray voltages of 2400 ± 100 V, a capillary offset voltage of 35 V, a skimmer offset voltage of −5 V, and a capillary inlet temperature of 220 °C. Both Q1 and Q3 were set at unit resolution of 0.7 fwhm, and Q2 gas pressure was 1.5 mTorr. A scan width of 0.002 m/z and a dwell time of 50 ms were used. The major fraction of the eluent was automatically collected every 45 s onto a deep 96-well plate using an automatic fraction collector (LEAP Technology, Carrboro, NC, USA). In serum sample analysis, eight peptides from the most abundant albumin protein in human serum were selected as internal RT standards to monitor RT shift in each run (Supporting Information section S1.4 and Table S1). In general, one more serum sample with the same batch of trypsin digestion and high heavy peptide spiked-in (~20 pmol) was run before or after real sample separation with the same conditions. Based on the RT alignment of albumin protein peptides and heavy peptides, fractions containing target peptides in the first-dimension separation were precisely located. The target peptide fractions from the first-dimension RPLC were concentrated to ~60 μL using a SpeedVac. These fractions were then further fractionated by a second-dimension high-pH reversed-phase separation system into another 96 fractions followed by selection of target peptide fractions of interest (via the online monitoring) for downstream LC-SRM analysis. This fractionation process resembles the high-resolution PRISM method, which was previously described in detail.5,15,22
LC-SRM Analysis
All fraction samples of interest from the second-dimension separation were analyzed using a nano-ACQUITY UPLC system (Waters) coupled online to a TSQ. Vantage triple quadrupole mass spectrometer (Thermo Scientific). The UPLC system was equipped with a nano-ACQUITY UPLC BEH 1.7 μm C18 column (100 μm i.d. × 10 cm). Buffer A (0.1% FA in water) and buffer B (0.1% FA in 90% acetonitrile) were used. A 4 μL aliquot of each sample was loaded onto the column at a flow rate of 1 μL/min for 6 min. Peptides were separated at a flow rate of 400 nL/min, using a binary gradient of 10–20% buffer B in 12 min, 20–25% buffer B in 9 min, 25–40% buffer B in 3 min, 40–95% in 1 min, and 95% for 5 min. The TSQ Vantage was operated in the same manner as the TSQ Quantum Ultra with a scan width of 0.002 m/z and dwell time of 50 ms for all SRM transitions. Tube lens voltages were obtained from automatic tuning and calibration without further optimization. All the samples were analyzed in triplicates.
ELISA Analysis of IL13
An ELISA kit for IL13 was purchased from Abcam (Cambridge, MA, USA). All the ELISA measurements were performed according to the manufacturer’s instructions. The standard IL13 protein from the same ELISA kit was spiked into a pooled human serum sample purchased from BioreclamationIVT (endogenous IL13 concentration was 0.32 pg/mL as determined by ELISA) at different IL13 concentrations (Supporting Information section S 1.5 and Table S2). The human serum samples were then measured by both the ELISA and DD-SRM assays for comparison.
Data Analysis
The Skyline software was used for all SRM data analysis.23 The raw data were initially imported into Skyline software for visualization of chromatograms of target peptides to determine the detectability of target peptides. For each peptide the best transition without matrix interference was used for precise quantification. Two criteria were used to determine the peak detection and integration: (1) same retention time and (2) approximately the same relative SRM peak intensity ratios across multiple transitions between endogenous (light) peptides and heavy peptide internal standards. Standard derivation (SD) and coefficient of variation (CV) were obtained from three MS technical replicates for each fraction sample. All the data were manually inspected to ensure correct peak detection and accurate integration. The signal-to-noise ratio (S/N) was calculated by the peak apex intensity over the highest background noise within a retention time region of ±15 s for the target peptides. The S/N ratio of surrogate endogenous peptides ≥10 is required for reliable quantification.
RESULTS
Concept of DD-SRM
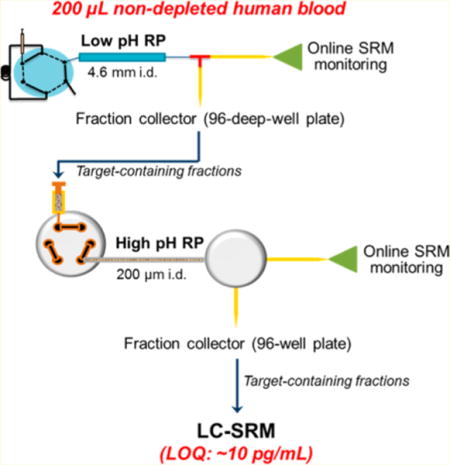
The concept of DD-SRM is depicted in Figure 1. Before LC-SRM analysis, target peptides are separated and enriched from complex biological samples (e.g., plasma/serum) by offline high-resolution 2D-RPLC separations with precise selection of target peptide fractions of interest via online SRM monitoring. First, a relatively large amount of peptide mixtures are separated and fractionated into 96 fractions by high-resolution high-flow RPLC at pH 2.5. Based on online SRM monitoring (or subsequent offline highly reproducible high-flow RPLC separations), target peptide fractions of interest can be located precisely. Second, the selected target fraction is further separated and fractionated into 96 fractions using high-resolution capillary RPLC at pH 10. The predefined target peptide fractions from the second-dimension separation were selected based on online SRM monitoring of heavy isotope-labeled internal standards. Lastly, the selected peptide fraction is loaded onto the third-dimensional capillary nanoflow RPLC at pH 2.5 and then analyzed by SRM for quantification.
Figure 1.
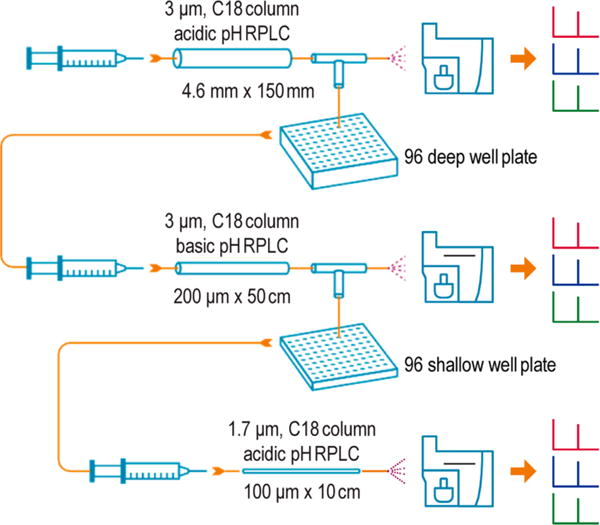
Schematic diagram of the DD-SRM workflow. Approximately 4 mg of peptide digest from nondepleted human blood plasma/serum with spiked-in heavy internal standard peptides is loaded onto a large 4.6 mm i.d. RPLC column and then separated into 96 fractions by high-resolution high-flow RPLC using pH 2.5 mobile phases. Based on online SRM monitoring results of multiple highly abundant human serum albumin peptides or heavy internal standard peptides, the target peptide fractions are located precisely using the calibrated retention time. The selected target peptide fraction is further fractionated into 96 fractions by high-resolution second-dimension capillary RPLC separation using pH 10.0 mobile phases, and the target peptide fraction of interest is again selected via online SRM monitoring. Approximately 4 μL of selected peptide fraction (total volume for each fraction is ~20 μL) is then loaded onto the third-dimensional capillary RPLC using pH 2.5 mobile phases and analyzed by SRM. DD-SRM takes full advantages of the partial orthogonality between low-pH and high-pH, high-resolution RPLC separations, precise selection of target peptide fractions via online SRM monitoring, and significantly increased loading capacity of a large i.d. column in the first-dimensional RPLC separation to achieve ultrahigh sensitivity for detection of low picograms per liter level proteins in nondepleted human blood plasma/serum.
The concept of DD-SRM is built on the following reasons: (1) the partial orthogonality between low- and high-pH RPLC separations provides high peak capacity that has been well documented in recent MS-based proteomics studies, and thus the combination of low–high–low pH RPLC would significantly reduce matrix background interference; (2) the consecutive implementation of three-dimensional RPLC separations (high-flow, microflow, and nanoflow LC) allows for exceptionally high initial sample loading (e.g., ~4 mg of peptide mixtures, equivalent to ~200 μL of human serum) as well as precise selection of target peptide fractions of interest by online SRM monitoring due to the compatibility of RP separation buffers with electrospray ionization; (3) when compared to strong cation/anion exchange chromatography (SCX/SAX), RPLC separation provides higher resolution and reproducibility and does not need additional sample cleanup to minimize sample handling for improved peptide recovery.24 All these features are contributing to the ability of DD-SRM to detect extremely low abundance proteins in complex biological samples.
Sensitivity and Reproducibility of DD-SRM
To provide an initial demonstration of the sensitivity and reproducibility for DD-SRM, we built a response curve of PSA spiked into pooled healthy female serum. Approximately 4 mg of serum digests (corresponding to ~200 μL of serum) were used for each data point. The digested PSA protein was spiked into the serum digests at concentrations of 0, 0.01, 0.025, 0.05, 0.1, 0.5, 1.0, 10.0, and 100.0 ng/mL, together with 100 fmol pure heavy internal standard LSEPAELTDAVK. The peptide mixtures from each concentration point were analyzed by DD-SRM with three technical replicates. Figure 2A shows the extracted ion chromatograms (XICs) of the transitions monitored for LSEPAELTDAVK at protein concentrations of 0–100 pg/mL. For the blank control sample, the exogenous PSA surrogate peptide was not detected, while it was clearly detected and quantifiable (S/N > 10) in the spiked-in samples with as low as 10 pg/mL PSA. This indicates that DD-SRM has the ability to detect and quantify low picograms per milliliter levels of target proteins in nondepleted human blood plasma/serum.
Figure 2.
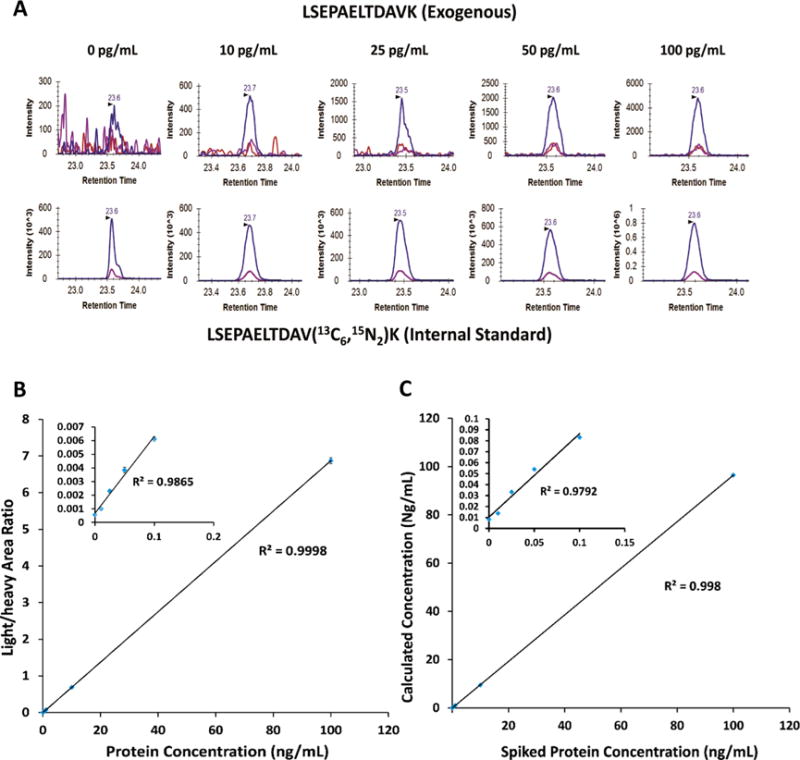
Evaluation of sensitivity, reproducibility and accuracy of DD-SRM using nondepleted human female serum samples spiked with exogenous PSA protein. (A) XICs of transitions monitored for LSEPAELTDAVK from PSA protein at various concentrations. A 100 fmol amount of heavy internal standard was spiked into all the human serum samples. Three highly responsive transitions, 636.8/943.5 (blue), 636.8/775.4 (red), and 636.8/846.5 (purple), were monitored, and the best responsive transition, 636.8/943.5 (blue), was used for peptide quantification. (B) Response curve of exogenous PSA in the pooled female serum at the concentrations ranging from 0 to 100 ng/mL. (C) Correlation between the calculated and the measured exogenous PSA concentrations. Inset plots show the details of the low-concentration points ranging from 0 to 100 pg/mL.
A linear dynamic range of over 4 orders of magnitude in PSA concentrations has been achieved with R2 = 0.99, and the CV was less than 5% (Figure 2B). As we demonstrated before, the absolute amounts of exogenous PSA proteins can be calculated from the peak area ratios of light to heavy peptides (L/H) and the accurate concentration of internal standard PSA peptide. They can be used to evaluate the peptide recovery and quantification accuracy.1,25 A good correlation (R2 = 0.99) between the calculated and the expected PSA concentrations was obtained (see Figure 2C), suggesting high quantification accuracy and sample recovery achievable in DD-SRM.
Quantification of Extremely Low Abundance Endogenous Proteins by DD-SRM
To demonstrate its ultrahigh sensitivity for quantification of endogenous proteins, we applied DD-SRM for measuring four extremely low abundance proteins (IL13, IL8, TNFα, and IL9) in a pooled healthy female human serum sample purchased from Biochemed (October 2015) (see Table S2). Based on previous reports in the literature, their concentrations ranged from 7 to 30 pg/mL in healthy human serum.26–28 The following surrogate peptides with the best performance from each protein were selected: ELCLDPK (IL8), SLLEIFQK (IL9), VNLLSAIK (TNFα), and DLLLHLK (IL13). The best transitions and collision energies were listed in Table S3. The heavy internal standards were spiked into 4 mg of human serum digests at concentrations of 1250 fmol for ELCLDPK, 900 fmol for SLLEIFQK, 350 fmol for VNLLSAIK, and 350 fmol for DLLLHLK The sensitivity of DD-SRM for detection of endogenous proteins was evaluated by comparison to that of our highly sensitive PRISM-SRM method (LOQ of low nanograms per milliliter in nondepleted plasma/serum).22 A 50 μg amount of serum digests (the optimal loading for PRISM-SRM) with the same spiked-in amount of heavy internal standards as DD-SRM was used for PRISM-SRM analysis. As shown in Figure 3, none of endogenous peptides were detected by PRISM-SRM, while all endogenous peptides can be readily detected by DD-SRM. Based on the L/H ratio and the known heavy internal standard concentrations, the four endogenous protein concentrations in human serum can be estimated as 20.7 pg/mL (IL8), 39.9 pg/mL (IL9), 46.8 pg/mL (TNFα), and 126.6 pg/mL (IL13). This result demonstrates that DD-SRM significantly improves sensitivity by increasing the sample loading and reducing the background interference with orthogonal multidimensional high-resolution LC separations.
Figure 3.
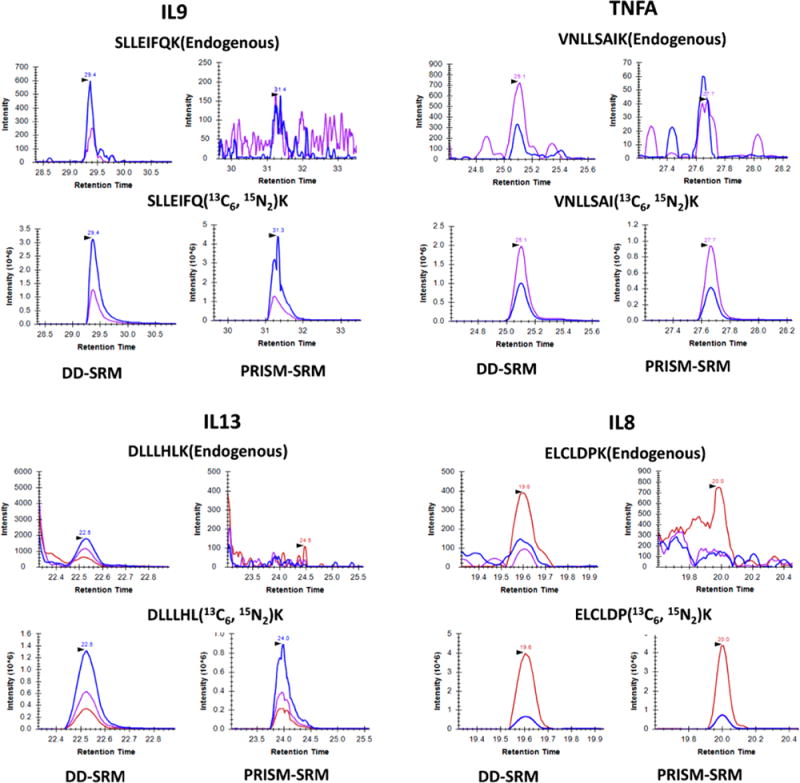
DD-SRM and PRISM-SRM analyses of four surrogate peptides from IL9, TNFα, IL13, and IL8 that were reported to be present at extremely low concentrations in serum. All four endogenous peptides were clearly detected by DD-SRM with high S/N ratios (16 for SLLEIFQK, 12 for VNLLSAIK, 20 for DLLLHLK, and 7 for ELCLDPK), whereas PRISM-SRM could not detect them from nondepleted serum. All transitions used for detection are shown as SLLEIFQK of 777.45/785.46 (blue) and 664.37/672.38 (purple); VNLLSAIK of 758.48/766.49 (blue) and 644.43/652.45 (purple); DLLLHLK of 623.42/631.44 (blue), 510.34/518.35 (purple), and 397.26/405.27 (red); and ELCLDPK of 244.17/252.18 (red), 632.31/640.32 (blue), and 472.28/480.29 (purple). With the use of the best responsive transition, the concentrations of the four endogenous proteins were calculated as 20.7 pg/mL (IL8), 39.9 pg/mL (IL9), 46,8 pg/mL (TNFα), and 126.6 pg/mL (IL13), respectively.
To demonstrate its broad utility, next DD-SRM was applied for quantification of extremely low abundance endogenous proteins in human ovarian tumor that cannot be detected by PRISM-SRM. A comparison between DD-SRM and PRISM-SRM was carried out by monitoring two surrogate peptides: SNVQPTAAPGQK from AURKB protein and IPYEEGPGPGPLAEVR from FOSB protein. A 50 μg amount of tissue digests and 1 mg of tissue digests were used for PRISM-SRM and DD-SRM, respectively, with the same spiked-in amount of heavy internal standards (30 fmol for SNVQPTAAPGQK and 200 fmol for IPYEEGPGPGPLAEVR). The best transitions and their collision energies of the two surrogate peptides were listed in Table S1. As shown in Figure 4, DD-SRM can reliably detect and quantify the two endogenous peptides. The calculated protein expression levels were ~40 copies per cell level for AURKB and ~10 copies per cell level for FOSB (see Supporting Information section S1.3 for the detailed calculation). Considering that there is still room for further increasing the sample loading amount, DD-SRM should be able to detect and quantify proteins expressed at the level of <10 protein copies per cell in human tissue. Such levels of sensitivity are much higher (≥700-fold) than that provided by conventional LC-SRM (~7500 copies per human cell without sample fractionation).29
Figure 4.
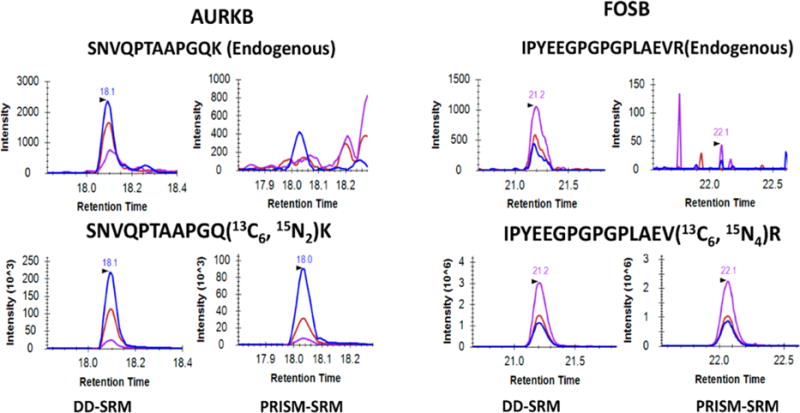
DD-SRM and PRISM-SRM analyses of two surrogate peptides from AURKB and FOSB that were expressed at extremely low levels in ovarian tumor. Both peptides were reliably detected by DD-SRM with high S/N ratios (40 for IPYEEGPGPGPLAEVR and 55 for SNVQPTAAPGQK); PRISM-SRM did not detect either peptide. IPYEEGPGPGPLAEVR 840.93/1049.6 (purple), 840.93/838.5 (red), and 840.93/1178.6 (blue); SNVQPTAAPGQK, 599.3/769.4 (blue), 599.3/429.2 (red), and 599.3/500.3 (purple). Based on the DD-SRM measurements, the expression levels for the two proteins are determined to be ~40 and ~10 copies per cell levels for AURKB and FOSB, respectively.
DD-SRM and ELISA Measurements for IL13
To evaluate the quantification accuracy of DD-SRM, IL13 protein concentrations from eight human serum samples (four sepsis and four normal) were measured by both the commercially available ELISA assay and DD-SRM. The ELISA results indicated that the majority of these serum samples have extremely low concentrations of IL13 (0.3–4.2 pg/mL); DD-SRM was only able to quantify IL13 in one sample (Figure 3) that has an ELISA-measured IL13 concentration of 39.4 pg/mL (Table S2). To obtain the correlation of the DD-SRM and ELISA results, the same IL13 standard protein that was used in creating the ELISA response curve was spiked into a healthy human serum sample with negligible level of IL13 (0.32 pg/mL; see Table S2) to generate five samples with IL13 concentrations ranging from 25 to 100 pg/mL. Excellent correlation was observed between the DD-SRM and ELISA measurements with R2 ~ 0.99, suggesting the robustness of the multistep DD-SRM analysis. However, the DD-SRM results were ~3 times higher than the ELISA results (Figure 5). This observation that the protein concentration measured by SRM is higher than that by ELISA is similar to our previous results for PSA quantification by PRISM-SRM and ELISA,21,22 as well as the comparisons of SRM to ELISA results for other proteins,30 due to various potential reasons, e.g., differences in the methods for quantitation of the peptide standards (used for SRM) and protein standards (used for ELISA), unexpected protein– protein interaction, or partial protein degradation or truncation that results in low to no activity to bind to the antibodies.
Figure 5.
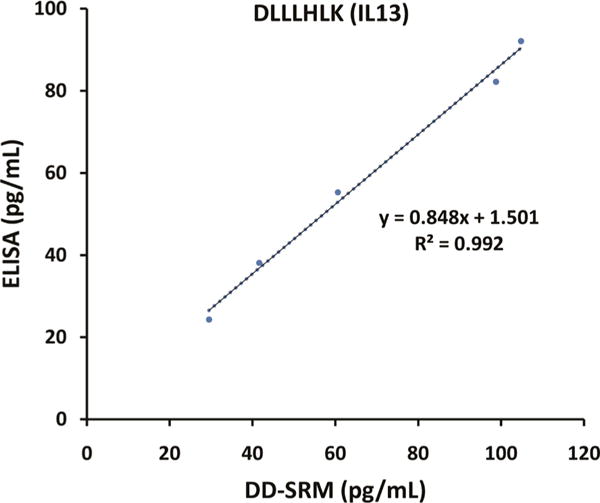
Correlation between the DD-SRM and ELISA measurements. Standard IL13 protein was spiked into a human serum sample with negligible endogenous IL13 (0.32 pg/mL) at different concentrations of 25, 40, 50, 75, and 100 pg/mL. The five serum samples were then analyzed by both ELISA and DD-SRM.
DISCUSSION
We have demonstrated that DD-SRM enables the detection and quantification of target proteins at ≤10 pg/mL levels in human blood or <10 copies per cell in human tissue without the use of affinity reagents, either for enrichment of targets or depletion of interfering proteins. When compared to direct PRISM-SRM which displays low nanograms per milliliter or sub-nanogram per milliliter sensitivity in nondepleted human blood, DD-SRM can provide ~100-fold enhancement in detection sensitivity due to significantly enhanced sample loading (~4 mg for DD-SRM vs ~45 μg for PRISM-SRM) as well as ultrahigh resolving power from serial orthogonal low– high–low pH RPLC separations. Furthermore, unlike immuno-SRM methods, such as SISCAPA-SRM which requires antipeptide antibodies and approximately 1 mL of human blood to achieve a sensitivity of ~100 pg/mL, DD-SRM has ~10-fold higher sensitivity than SISCAPA-SRM with ~5-fold less starting material (i.e., only ~200 μL of human blood). This can be primarily attributed to the high peptide recovery when multidimensional high-resolution LC separations are used for nearly lossless peptide enrichment. However, DD-SRM has much lower throughput than immuno-SRM in both number of samples and number of targets.
DD-SRM is currently limited to typically one to two target proteins because the enrichment of each individual target peptide requires ~2 h running time per peptide. With an increase in the number of target peptides the overall separation time will be proportionally increased (e.g., ~20 h for 10 target peptides). Improving sample throughput can be achieved by either optimization of the LC gradient for rapid elution of specific target peptides or target peptide fraction multiplexing via concatenation (but with the risk of sacrificing the resolving power of the high-resolution RPLC separation). We anticipate further improvement to ~20–30 min running time for DD-SRM is achievable for analyzing one target peptide, resulting in ~5-fold improvement in sample throughput when compared to current DD-SRM. Therefore, DD-SRM is ideal for quantification of extremely low abundance proteins in many different sample types, such as cytokines in human serum and transcription factors in human cells or tissues, particularly when high-quality antibodies are not available. However, DD-SRM is less practical for targeted analysis of many proteins in a large number of samples.
Many combinations of multidimensional LC separations have been used for reducing sample complexity to improve MS detection sensitivity (e.g., low-pH RP-SCX/SAX–low-pH RP). When compared to the multidimensional low-pH–high-pH–low-pH RP separations used in DD-SRM, the other separation combinations have lower peak capacity with resultant identification of fewer proteins and peptides, and the high salt content in the mobile phases interferes with online SRM monitoring by suppressing electrospray ionization.31,32 Online monitoring of the heavy internal standard peptides is also a problem following the first-dimension RPLC separation in DD-SRM, due to severe ion suppression from the tremendously abundant serum matrix (i.e., ~4 mg of serum digests). To address this issue, internal retention time (RT) standards were employed to identify the target peptide fractions of interest. The internal RT standards were previously used to normalize the RT for peptide identification and quantification in targeted proteomics analysis.33 Eight peptides from albumin, the most abundant protein in serum, were selected as internal RT standards based on their RT stability, high SRM signal, and their elution time across the entire LC elution profile (Table S1). High-flow UPLC demonstrated high reproducibility with only ~12 s of average RT shift. In our DD-SRM analysis, the eight internal standards were used to precisely locate target peptide fractions of interest in the first-dimension RPLC separation, and the selected target peptide fractions were then subjected to the second-dimension high-pH RPLC fractionation.
CONCLUSIONS
We have developed an antibody-independent ultrasensitive targeted MS method, DD-SRM, that capitalizes on multidimensional high-resolution RPLC separations for high-efficiency separation and enrichment of target peptides, and online SRM monitoring for precise selection of target peptide fractions of interest for LC-SRM analysis. DD-SRM provided precise quantification of target proteins at ≤10 pg/mL levels in human blood and <10 protein copies per cell levels in human tissue without the use of affinity reagents. Such levels of sensitivity are better than those of many analytically validated immunoassays. Furthermore, DD-SRM has high specificity and high accuracy and an excellent correlation with ELISA measurements. Given the difficulty in generating high-specificity antibodies for precise quantification of substoichiometric PTMs and protein isoforms in complex biological samples, DD-SRM holds great promise for reliable quantification of not only extremely low abundance proteins but also protein variants and PTMs when high-quality antibodies are not available.
Supplementary Material
Acknowledgments
Portions of the research were supported by NIH Grants U24CA160019, U24CA210955, P41GM103493, and DP3DK110844. The experimental work described herein was performed in the Environmental Molecular Sciences Laboratory, Pacific Northwest National Laboratory, a national scientific user facility sponsored by the United States of America Department of Energy under Contract DE-AC05-76RL0 1830.
Footnotes
Supporting Information
The Supporting Information is available free of charge on the ACS Publications website at DOI: 10.1021/acs.analchem.7b01878.
Details of PSA response curve experiment and calculation of endogenous protein concentration and copy number, peptides from human blood used for SRM monitoring, endogenous IL13 protein concentrations, and peptides/proteins and their transitions analyzed by DD-SRM (PDF)
Notes
The authors declare no competing financial interest.
References
- 1.Keshishian H, Addona T, Burgess M, Kuhn E, Carr SA. Mol Cell Proteomics. 2007;6:2212–2229. doi: 10.1074/mcp.M700354-MCP200. [DOI] [PMC free article] [PubMed] [Google Scholar]
- 2.Picotti P, Bodenmiller B, Mueller LN, Domon B, Aebersold R. Cell. 2009;138:795–806. doi: 10.1016/j.cell.2009.05.051. [DOI] [PMC free article] [PubMed] [Google Scholar]
- 3.Whiteaker JR, Zhao L, Anderson L, Paulovich AG. Mol Cell Proteomics. 2010;9:184–196. doi: 10.1074/mcp.M900254-MCP200. [DOI] [PMC free article] [PubMed] [Google Scholar]
- 4.Shi T, Su D, Liu T, Tang K, Camp DG, 2nd, Qian WJ, Smith RD. Proteomics. 2012;12:1074–1092. doi: 10.1002/pmic.201100436. [DOI] [PMC free article] [PubMed] [Google Scholar]
- 5.He J, Schepmoes AA, Shi T, Wu G, Fillmore TL, Gao Y, Smith RD, Qian WJ, Rodland KD, Liu T, Camp DG, Rastogi A, Tan SH, Yan W, Mohamed AA, Huang W, Banerjee S, Kagan J, Srivastava S, McLeod DG, Srivastava S, Petrovics G, Dobi A, Srinivasan A. J Transl Med. 2015;13:54. doi: 10.1186/s12967-015-0418-z. [DOI] [PMC free article] [PubMed] [Google Scholar]
- 6.Kim YJ, Sertamo K, Pierrard MA, Mesmin G, Kim SY, Schlesser M, Berchem G, Domon B. J Proteome Res. 2015;14:1412–1419. doi: 10.1021/pr5010828. [DOI] [PubMed] [Google Scholar]
- 7.Domon B, Gallien S. Proteomics: Clin Appl. 2015;9:423–431. doi: 10.1002/prca.201400136. [DOI] [PubMed] [Google Scholar]
- 8.Shi T, Fillmore TL, Gao Y, Zhao R, He J, Schepmoes AA, Nicora CD, Wu G, Chambers JL, Moore RJ, Kagan J, Srivastava S, Liu AY, Rodland KD, Liu T, Camp DG, 2nd, Smith RD, Qian WJ. Anal Chem. 2013;85:9196–9203. doi: 10.1021/ac402105s. [DOI] [PMC free article] [PubMed] [Google Scholar]
- 9.Overgaard M, Cangemi G, Jensen ML, Argraves WS, Rasmussen LM. Proteomics: Clin Appl. 2015;9:767–775. doi: 10.1002/prca.201400070. [DOI] [PubMed] [Google Scholar]
- 10.Cho GK, Drabovich AP, Batruch I, Diamandis EP. J Proteomics. 2011;74:2052–2059. doi: 10.1016/j.jprot.2011.05.025. [DOI] [PubMed] [Google Scholar]
- 11.Lesur A, Ancheva L, Kim YJ, Berchem G, van Oostrum J, Domon B. Proteomics: Clin Appl. 2015;9:695–705. doi: 10.1002/prca.201400158. [DOI] [PubMed] [Google Scholar]
- 12.Nie S, Yin H, Tan Z, Anderson MA, Ruffin MT, Simeone DM, Lubman DM. J Proteome Res. 2014;13:6058–6066. doi: 10.1021/pr500934u. [DOI] [PMC free article] [PubMed] [Google Scholar]
- 13.Lange V, Picotti P, Domon B, Aebersold R. Mol Syst Biol. 2008;4:222. doi: 10.1038/msb.2008.61. [DOI] [PMC free article] [PubMed] [Google Scholar]
- 14.Anderson L, Hunter CL. Mol Cell Proteomics. 2006;5:573–588. doi: 10.1074/mcp.M500331-MCP200. [DOI] [PubMed] [Google Scholar]
- 15.Shi T, Fillmore TL, Sun X, Zhao R, Schepmoes AA, Hossain M, Xie F, Wu S, Kim JS, Jones N, Moore RJ, Pasa-Tolic L, Kagan J, Rodland KD, Liu T, Tang K, Camp DG, Smith RD, Qan WJ. Proc Natl Acad Sci U S A. 2012;109:15395–15400. doi: 10.1073/pnas.1204366109. [DOI] [PMC free article] [PubMed] [Google Scholar]
- 16.Percy AJ, Simon R, Chambers AG, Borchers CH. J Proteomics. 2014;106:113–124. doi: 10.1016/j.jprot.2014.04.024. [DOI] [PubMed] [Google Scholar]
- 17.Nie S, Lo A, Wu J, Zhu J, Tan Z, Simeone DM, Anderson MA, Shedden KA, Ruffin MT, Lubman DM. J Proteome Res. 2014;13:1873–1884. doi: 10.1021/pr400967x. [DOI] [PMC free article] [PubMed] [Google Scholar]
- 18.Keshishian H, Addona T, Burgess M, Mani DR, Shi X, Kuhn E, Sabatine MS, Gerszten RE, Carr SA. Mol Cell Proteomics. 2009;8:2339–2349. doi: 10.1074/mcp.M900140-MCP200. [DOI] [PMC free article] [PubMed] [Google Scholar]
- 19.Whiteaker JR, Zhao L, Zhang HY, Feng LG, Piening BD, Anderson L, Paulovich AG. Anal Biochem. 2007;362:44–54. doi: 10.1016/j.ab.2006.12.023. [DOI] [PMC free article] [PubMed] [Google Scholar]
- 20.Shi T, Gao Y, Quek SI, Fillmore TL, Nicora CD, Su D, Zhao R, Kagan J, Srivastava S, Rodland KD, Liu T, Smith RD, Chan DW, Camp DG, 2nd, Liu AY, Qian WJ. J Proteome Res. 2014;13:875–882. doi: 10.1021/pr400912c. [DOI] [PMC free article] [PubMed] [Google Scholar]
- 21.Shi T, Sun X, Gao Y, Fillmore TL, Schepmoes AA, Zhao R, He J, Moore RJ, Kagan J, Rodland KD, Liu T, Liu AY, Smith RD, Tang K, Camp DG, Qian WJ. J Proteome Res. 2013;12:3353–3361. doi: 10.1021/pr400178v. [DOI] [PMC free article] [PubMed] [Google Scholar]
- 22.He J, Sun X, Shi T, Schepmoes AA, Fillmore TL, Petyuk VA, Xie F, Zhao R, Gritsenko MA, Yang F, Kitabayashi N, Chae SS, Rubin MA, Siddiqui J, Wei JT, Chinnaiyan AM, Qan WJ, Smith RD, Kagan J, Srivastava S, Rodland KD, Liu T, Camp DG., 2nd Mol Oncol. 2014;8:1169–1180. doi: 10.1016/j.molonc.2014.02.004. [DOI] [PMC free article] [PubMed] [Google Scholar]
- 23.MacLean B, Tomazela DM, Shulman N, Chambers M, Finney GL, Frewen B, Kern R, Tabb DL, Liebler DG, MacCoss MJ. Bioinformatics. 2010;26:966–968. doi: 10.1093/bioinformatics/btq054. [DOI] [PMC free article] [PubMed] [Google Scholar]
- 24.Wang Y, Yang F, Gritsenko MA, Wang Y, Clauss T, Liu T, Shen Y, Monroe ME, Lopez-Ferrer D, Reno T, Moore RJ, Klemke RL, Camp DG, Smith RD. Proteomics. 2011;11:2019–2026. doi: 10.1002/pmic.201000722. [DOI] [PMC free article] [PubMed] [Google Scholar]
- 25.Fortin T, Salvador A, Charrier JP, Lenz G, Lacoux X, Moria A, Choquet-Kastylevsky G, Lemoine J. Mol Cell Proteomics. 2009;8:1006–1015. doi: 10.1074/mcp.M800238-MCP200. [DOI] [PMC free article] [PubMed] [Google Scholar]
- 26.Robak T, Gladalska A, Stepien H, Robak E. Mediators Inflammation. 1998;7:347–353. doi: 10.1080/09629359890875. [DOI] [PMC free article] [PubMed] [Google Scholar]
- 27.Polyak SJ, Khabar KS, Rezeiq M, Gretch DR. J Virol. 2001;75:6209–6211. doi: 10.1128/JVI.75.13.6209-6211.2001. [DOI] [PMC free article] [PubMed] [Google Scholar]
- 28.Kleiner G, Marcuzzi A, Zanin V, Monasta L, Zauli G. Mediators Inflammation. 2013;2013:434010. doi: 10.1155/2013/434010. [DOI] [PMC free article] [PubMed] [Google Scholar]
- 29.Ebhardt HA, Sabido E, Huttenhain R, Collins B, Aebersold R. Proteomics. 2012;12:1185–1193. doi: 10.1002/pmic.201100543. [DOI] [PubMed] [Google Scholar]
- 30.Kaiser SE, Riley BE, Shaler TA, Trevino RS, Becker GH, Schulman H, Kopito RR. Nat Methods. 2011;8:691–696. doi: 10.1038/nmeth.1649. [DOI] [PMC free article] [PubMed] [Google Scholar]
- 31.Guar M, Olivova P, Daly AE, Gebier JC. J Sep Sci. 2005;28:1694–1703. doi: 10.1002/jssc.200500116. [DOI] [PubMed] [Google Scholar]
- 32.Dowell JA, Frost DG, Zhang J, Li L. Anal Chem. 2008;80:6715–6723. doi: 10.1021/ac8007994. [DOI] [PMC free article] [PubMed] [Google Scholar]
- 33.Parker SJ, Rost H, Rosenberger G, Collins BG, Malmstrom L, Amodei D, Venkatraman V, Raedschelders K, Van Eyk JE, Aebersold R. Mol Cell Proteomics. 2015;14:2800–2813. doi: 10.1074/mcp.O114.042267. [DOI] [PMC free article] [PubMed] [Google Scholar]
Associated Data
This section collects any data citations, data availability statements, or supplementary materials included in this article.