

Abstract
The purpose of this study was to study changes in glycosylation in tear and saliva obtained from control and ocular rosacea patients in order to identify potential biomarkers for rosacea. Tear fluid was collected from 51 subjects (28 healthy controls and 23 patients with ocular rosacea). Saliva was collected from 42 of the same subjects (25 controls and 17 patients). Pooled and individual samples were examined to determine overall glycan profiles and individual variations in glycosylation. O-and N- glycans were released from both patients and control subjects. Released glycans were purified and enriched by solid-phase extraction (SPE) with graphitized carbon. Glycans were eluted based on glycan size and polarity. SPE fractions were then analyzed by high-resolution mass spectrometry. Glycan compositions were assigned by accurate masses. Their structures were further elucidated by tandem mass spectrometric using collision-induced dissociation (CID), and specific linkage information was obtained by exoglycosidase digestion. N- and O-glycans were released from 20-μL samples without protein identification, separation, and purification. Approximately 50 N-glycans and 70 O-glycans were globally profiled by mass spectrometry. Most N-glycans were highly fucosylated, while O-glycans were sulfated. Normal tear fluid and saliva contain highly fucosylated glycans. The numbers of sulfated glycans were dramatically increased in tear and saliva of rosacea patients compared to controls. Glycans found in tear and saliva from roseatic patients present highly quantitative similarity. The abundance of highly fucosylated N-glycans in the control samples and sulfated O-glycans in ocular rosacea patient samples may lead to the discovery of an objective diagnostic marker for the disease.
Keywords: biomarkers, fucosylation, glycans, glycomic analysis, mucin, ocular rosacea, oligosaccharides, tear, saliva
INTRODUCTION
Rosacea is a widely prevalent, chronic cutaneous disorder characterized by transient or persistent central facial erythema, telangiectasia, papules, pustules, and sebaceous gland hypertrophy localized primarily on the convexities of the central face (cheeks, chin, nose and forehead). This condition affects 13 million Americans and has been reported to have a prevalence of 10% in Sweden. It is most frequently observed in fair-skinned patients; however, Asians and African Americans have also been diagnosed with this disorder. It may occur both in men and women, at any age, but the onset typically begins after age 30.1
Ocular rosacea represents a common subset of the disorder and is often the cause of chronic inflammatory eye disease. While up to 90% of patients with ocular rosacea may have subtle roseatic skin changes, in 20% of cases, the ocular signs precede characteristic skin involvement, making the diagnosis of ocular rosacea particularly challenging in these patients.2
Unfortunately, there is no diagnostic test for either cutaneous or ocular rosacea. No specific histologic or serologic markers have been established to date. Biochemical methods for the early and accurate detection of ocular rosacea could potentially provide both a diagnostic marker as well as an etiologic explanation. Identifying a specific marker for the disease will enable earlier and more effective treatment.
The search for a biomarker is a long and difficult process, involving the identification of a biomolecule that is both sensitive and specific to a disorder. First, the identification of the marker has to be reproducible in the population of interest (for example, rosacea patients). Second, testing in other populations (eg, non-roseatic blepharitis patients) is warranted in order to certify that the marker is specific to the condition. Additionally, different laboratories have to be capable of reproducing the results. This study is only the initial step in the long pathway toward the discovery of a biomarker for rosacea.
One of the major components of the tear film is mucin, which is a high-molecular-weight glycoprotein composed of tandem repeats of amino acids rich in serine (Ser) and threonine (Thr), which serve as sites for glycosylation.3,4 Glycosylation is the most common post-translational modification process by which saccharides are linked to lipids and proteins.4 Glycans attached to proteins in animal cells can be N-linked (bound to an asparagine side chain in an Asn-X-Thr or Asn-X-Ser amino acid consensus sequence with X ≠ proline), O-linked (with glycans attached to serine or threonine side chains) or glycosaminoglycans (bound to a serine side chain).4,5 Oligosaccharides found in mucins are composed of primarily O-linked oligosaccharides, but also of N-linked glycans. Fucosylation, a type of glycosylation, comprises the attachment of a fucose residue to N-glycans, O-glycans, and glycolipids. Sulfation is a post-translational modification process in which a sulfate group (SO3H) is attached to glycans. A review on mucins found in human ocular surface epithelia has been published.6
Our study is based on the fact that glycosylation is highly sensitive to the biochemical environment and has been implicated in many diseases.7,27 Saliva and tear are biological fluids that are readily accessible and act as a mirror that reflects the levels of natural and artificial substances in the body. However, the glycosylation of tear and saliva has not been well studied. In this study, we globally profiled glycans isolated from tear and saliva of controls and ocular rosacea patients.
We have previously shown a high abundance of O-linked oligosaccharides in the tear fluid of patients with rosacea.8 To the best of our knowledge, there are no reported studies of saliva in rosacea patients.
The objective of the present study was to perform glycomic analysis of tears and saliva of roseatic patients and compare them to normal patients in order to identify potential oligosaccharide markers for rosacea and to make an early and specific diagnosis possible. This may also enhance our understanding of this common and troublesome disease.
MATERIALS AND METHODS
Patient Selection
Tear fluid samples were collected from two groups of patients. Subjects with no ocular diseases comprised the control group. The test group consisted of patients with ocular rosacea. The diagnosis of ocular rosacea was based on the standard classification proposed by the National Rosacea Society Expert Committee.9 According to these criteria, the presence of one or more of the following signs with an axial facial distribution is indicative of rosacea: flushing or transient erythema, persistent erythema, papules and pustules, telangiectasia. Patients with epithelial defects and/or corneal ulcers/infiltrates and history of recent (<1 year) ocular surgery were not included. This research followed the tenets of the Declaration of Helsinki and was approved by the Institutional Review Board (IRB)/Ethics Committee. Informed consent was obtained from all subjects.
Tear Sample Collection
Tear fluid from the inferior tear meniscus of 51 subjects (23 patients with ocular rosacea and 28 controls with no ocular diseases) was collected after light stimulation, using 10-μL microcapillary tubes (Microcaps, Drummond Scientific Co, Broomall, PA). The method of tear sample collection had been previously described by our group8; however, for this study we used a slightly modified technique, as follows. 1) Under the slit lamp, a bright light was shone onto the patients’ eyes to stimulate tearing. 2) A microcapillary tube was held horizontally and its tip placed to touch the tear meniscus until the tube was completely filled or until the tear column inside the tube was no longer advancing. 3) The procedure was repeated in both eyes, and samples were transferred to a labeled microcentrifuge tube. 4) The samples were immediately frozen at −80°C until ready for biochemical analysis. During collection, the tip of the tube did not touch the eyelid or eyelashes. The patients were required not to instill eye drops of any kind for at least 1 hour prior to tear collection.
Saliva Sample Collection
Saliva was collected from 42 of the same subjects (17 ocular rosacea patients and 25 controls). Samples were obtained with the aid of disposable plastic pipettes (Samco Scientific, San Fernando, CA) and were collected by the following method. 1) Patients were asked to collect saliva under their tongue. 2) Sublingual saliva was drawn into the pipette by gentle suction. 3) The saliva sample was transferred from the pipette into a labeled microcentrifuge tube. 4) Immediately after the collection, the samples were frozen at −80°C until biochemical analysis. The subjects were required to cease eating, drinking, or using oral hygiene products at least 1 hour prior to saliva collection.
Glycan Release
For N-linked glycans, tears and saliva were added to 100 mM ammonium bicarbonate (NH4HCO3), including 5 mM dithiothreitol (DTT, from Promega) and heated to 100°C for 2 min to denature the protein. After cooling at room temperature, 2 μL of Peptide N-glycosidase F (PNGase F, New England Biolabs) were added, and the mixture (pH 7.5) incubated at 37°C for 24 hours in a water bath. The released glycans were desalted by solid phase extraction (SPE) using a graphitized carbon cartridge (GCC, from Alltech) prior to mass spectrometric (MS) analysis.
For O-linked glycans, alkaline borohydride solution (100 μL, mixture of 1.0 M sodium borohydride and 0.1 M sodium hydroxide) was directly added to tears and saliva. The mixture was incubated at 42°C for 12 hrs in a water bath. After the reaction, 1.0 M hydrochloric acid solution was slowly added in an ice bath to stop the reaction and destroy excess sodium borohydride.
Glycan Enrichment
Released N- and O-linked glycans were purified and enriched by SPE-GCC. Prior to use, a graphitized carbon cartridge (150 mg bed weight, 4 mL cartridge volume) was washed with nanopure water followed by 80% acetonitrile (AcN) in 0.05% (v/v) trifluoroacetic acid (TFA) (v/v) and again with nanopure water. Glycan solutions were applied to the GCC cartridge and subsequently washed with several cartridge volumes of nanopure water at a flow rate of 1 mL/min to remove salts. Glycans were eluted stepwise with 10% AcN in H2O (v/v), 20% AcN in H2O (v/v), and 40% AcN in 0.05% TFA in H2O (v/v). Each fraction was collected and concentrated in vacuo prior to MS analysis. Fractions were reconstituted in nanopure water prior to MS analysis.
Mass Spectrometric Analysis
Mass spectra were recorded on a Fourier transform-ion cyclotron resonance mass spectrometry (FT-ICR MS) with an external source HiResMALDI (IonSpec Corporation, Irvine, CA) equipped with a 7.0 Tesla magnet. The HiResMALDI was equipped with a pulsed Nd:YAG laser (355 nm). 2,5-Dihydroxy-benzoic acid (DHB) was used as a matrix (5 mg/100 mL in 50% AcN:H2O) for both positive and negative modes. A saturated solution of NaCl in 50% AcN in H2O was used as a cation dopant to increase signal sensitivity. The glycan solution (0.7 μL) was applied to the MALDI probe followed by matrix solution (0.7 μL). For the negative ion spectra, only DHB matrix was used, without using any dopant. The sample was dried under vacuum prior to MS analysis.
RESULTS
Pooled and individual samples were examined to determine overall glycan profiles and individual variations in glycosylation, respectively. Representative mass spectra of N- and O-glycans found in tears and saliva are shown in Figure 1. Approximately 50 N-glycans and 70 O-glycans were globally profiled. In general, N-glycans produced strong signals in the positive mode, indicating that most of them were neutral, while O-glycans primarily produced strong signals in the negative mode due to their acidic character. Indeed, we found that most N-glycans found in controls’ tears and saliva are highly fucosylated, having Hex:HexNAc:Fuc composition, while O-glycans found in tears and saliva obtained from rosacea patients were mainly sulfated. Those glycans are unique and unprecedented in human serum.10
Figure 1.

Representative MALDI-MS spectra of (A) N-glycans released from control tear and saliva (B) O-glycans released from tear and saliva obtained from roseatic patient. Most of N-glycans are fucosylated while O-glycans are sulfated. Each symbol represents a monosaccharide. Hexose = circle, N-Acetyl Hexoseamine = square, Fucose = triangle, Sulfate (SO3H) = S.
Sulfated O-glycans were abundant in saliva and tear of ocular rosacea patients. O-glycans commonly have 2Hex-NAc:1Hex motif, indicating the presence of mucin core 2 structure (GlcNAcβ1-6(Galβ1-3)GalNAc). Tandem MS suggests that the sulfate group is generally located in an internal position binding to HexNAc. Interestingly, the numbers of sulfated glycans were dramatically increased in roseatic patients’ saliva compared to control samples (Figure 2). Patients yielded distinctive clusters of glycan peaks that extend to higher masses. We also found that individual and pooled samples showed a very similar pattern in glycosylation changes (Figure 2a and 2b).
Figure 2.

(A) O-glycan profile of an individual saliva sample. Top part of the graph shows the control saliva sample (#18) while bottom shows patient saliva (#4). (B) In-depth profiling of O-glycans released from pooled control (n=8) and roseatic patient saliva (n=14). All mass spectra were analyzed in the negative ion mode. Sulfated glycans are abundant in saliva from roseatic patients. Individual glycan profiles are very similar to those observed in pooled samples.
For better comparison, the ocular rosacea patients and control group were further compared according to glycan abundances using normalized absolute peak intensity (NAPI) of glycans and the number of glycans (Figure 3). To determine whether differences between the patient and control groups were significant, standard unpaired, two-tailed, unequal variance T-tests were performed. More than 44 sulfated glycans were observed in rosacea patients’ saliva with high abundance, while sulfated glycans were almost undetectable in saliva of controls. We observed a very similar glycosylation pattern in tear of both control and patients, although the number of glycans was much smaller in tear samples than in saliva samples. This result is consistent with our previous study.8 Overall, 38 of the 44 sulfated glycans were present only in ocular rosacea patients’ samples, with significant differences (P<0.005), and could therefore be considered as potential biomarkers. Six of the 44 sulfated glycans were observed in both control and ocular rosacea patient groups. These results, including the list of potential biomarkers for ocular rosacea, are summarized in Table 1.
Figure 3.
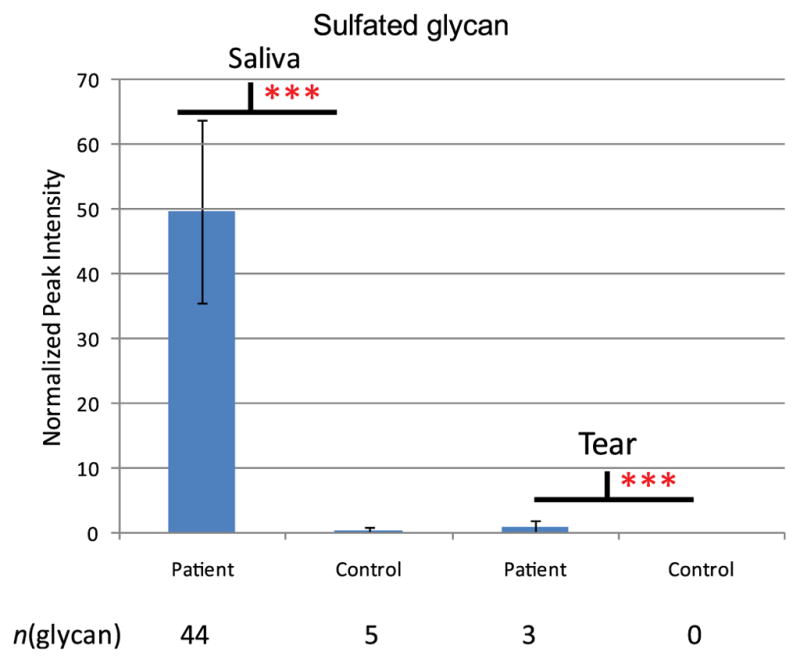
Sulfated glycan expression between patient and control group. Normalized intensities of glycans found in saliva and tear of control and ocular rosacea patient group were compared. T-test was performed and *** represents significant difference (p<0.005) between control and patient group.
Table 1.
The list of sulfated glycans found only in patients with ocular rosacea.
| Glycan Composition | |||||
|---|---|---|---|---|---|
| Observed m/z | Hex | HexNAc | Fuc | SO3H | NAPI |
| 829.240 | 2 | 2 | 0 | 1 | 3.75 ± 3.37 |
| 975.298 | 2 | 2 | 1 | 1 | 12.77 ± 14.59 |
| 1032.319 | 2 | 3 | 0 | 1 | 3.53 ± 3.83 |
| 1121.355 | 2 | 2 | 2 | 1 | 9.77 ± 6.78 |
| 1178.377 | 2 | 3 | 1 | 1 | 34.03 ± 14.42 |
| 1194.372 | 3 | 3 | 0 | 1 | 1.76 ± 0.58 |
| 1324.435 | 2 | 3 | 2 | 1 | 42.13 ± 2.74 |
| 1340.430 | 3 | 3 | 1 | 1 | 9.35 ± 1.66 |
| 1381.456 | 2 | 4 | 1 | 1 | 1.66 ± 0.58 |
| 1397.451 | 3 | 4 | 0 | 1 | 1.29 ± 0.13 |
| 1470.493 | 2 | 3 | 3 | 1 | 14.79 ± 2.85 |
| 1527.514 | 2 | 4 | 2 | 1 | 2.99 ± 0.55 |
| 1543.509 | 3 | 4 | 1 | 1 | 7.98 ± 1.65 |
| 1648.540 | 4 | 3 | 2 | 1 | 0.78 ± 0.13 |
| 1689.567 | 3 | 4 | 2 | 1 | 20.89 ± 10.55 |
| 1778.603 | 3 | 3 | 4 | 1 | 7.00 ± 1.56 |
| 1835.625 | 3 | 4 | 3 | 1 | 19.38 ± 7.10 |
| 1892.646 | 3 | 5 | 2 | 1 | 0.87 ± 0.17 |
| 1908.641 | 4 | 5 | 1 | 1 | 0.94 ± 0.29 |
| 1981.683 | 3 | 4 | 4 | 1 | 8.30 ± 3.19 |
| 2038.704 | 3 | 5 | 3 | 1 | 1.30 ± 0.29 |
| 2054.699 | 4 | 5 | 2 | 1 | 3.14 ± 1.46 |
| 2070.694 | 5 | 5 | 1 | 1 | 0.67 ± 0.04 |
| 2143.736 | 4 | 4 | 4 | 1 | 9.81 ± 4.90 |
| 2159.731 | 5 | 4 | 3 | 1 | 0.71 ± 0.21 |
| 2184.762 | 3 | 5 | 4 | 1 | 0.76 ± 0.12 |
| 2200.757 | 4 | 5 | 3 | 1 | 6.59 ± 3.41 |
| 2216.752 | 5 | 5 | 2 | 1 | 2.25 ± 1.07 |
| 2346.815 | 4 | 5 | 4 | 1 | 5.75 ± 2.88 |
| 2362.810 | 5 | 5 | 3 | 1 | 4.39 ± 2.17 |
| 2419.831 | 5 | 6 | 2 | 1 | 0.69 ± 0.34 |
| 2435.826 | 6 | 6 | 1 | 1 | 0.82 ± 0.06 |
| 2508.868 | 5 | 5 | 4 | 1 | 4.88 ± 2.93 |
| 2565.889 | 5 | 6 | 3 | 1 | 1.00 ± 0.47 |
| 2581.884 | 6 | 6 | 2 | 1 | 0.62 ± 0.12 |
| 2654.926 | 5 | 5 | 5 | 1 | 2.89 ± 1.42 |
| 2711.947 | 5 | 6 | 4 | 1 | 1.48 ± 0.66 |
| 2727.942 | 6 | 6 | 3 | 1 | 0.73 ± 0.25 |
NAPI represents normalized peak intensity measured by mass spectrometry.
Hex, HexNAc, and Fuc represent hexose, N-acetylhexoamine, and fucose, respectively.
Sulfated glycans can be considered a positive biomarker, being highly present or increased in ocular rosacea patients. Unlike sulfated glycans, fucosylated glycans were more dominant in tear and saliva of controls than in samples from ocular rosacea patients. Most fucosylated N-glycans are composed from bi-antennary to tetra-antennary (Hexn=4–6HexNAcn=3–5Fucn=0–7) and those were significantly decreased in both tears and saliva of patients (Figure 4). Again, pooled and individual samples presented similar glycan profiles.
Figure 4.

Comparison of N-glycans released from (A) saliva and (B) tear in control and patient with ocular rosacea. Most N-glycans from tear and saliva are fusocosylated.
Glycans from individual samples (control and patient group, respectively) were examined to determine glycan correlation between tears and saliva. Normalized intensities of glycan peak obtained from tears were plotted against normalized intensities of glycan peak obtained from saliva (Figure 5). The correlation coefficients (r) between the normalized intensity of glycans were in the range of 0.90 to 0.91, showing good correlation between tears and saliva in individual patients. However, interestingly, we did not observe any correlation between control saliva and tears. The results clearly show that glycans expressed from tear and saliva of ocular rosacea patients have quantitative similarity.
Figure 5.

Glycan correlation between saliva and tear in (A) control and (B) ocular rosacea patient.
DISCUSSION
Although considered a skin disease, rosacea often affects the eyes, causing chronic eyelid and ocular surface inflammation. Ocular involvement has been reported in 58% of patients with rosacea and corneal involvement in 33%.11 Ocular findings in rosacea are often nonspecific, the most common being Meibomian gland dysfunction (MGD) and blepharitis.2 Other ocular findings include dry eye, chronic conjunctivitis, recurrent chalazia, corneal vascularization and scarring, marginal corneal infiltrates, corneal ulceration and perforation,12 iritis, episcleritis and scleritis.1 We previously reported a rare case of spontaneous scleral perforation.13
Ocular rosacea may cause significant visual dysfunction and permanent loss of vision. The vision-threatening aspects of rosacea are virtually always associated with chronic, untreated disease, often in the context of misdiagnosis and inappropriate therapy. Ghanem et al reported that ocular rosacea cannot be diagnosed solely by ocular findings.2
The etiology of rosacea is still unknown, although many factors have been implicated in its pathogenesis. Several studies confirm an inflammatory mechanism.14,15 An elevated concentration of interleukin-1 and a greater activity of gelatinase B (MMP-9) were found in tear fluids of patients with ocular rosacea. However, elevated levels of MMP-9, in both latent and active forms, were also noted in the tears of patients with corneal transplant failure,16 revealing the unspecific character of this inflammation marker. An increased level of interleukin-1 was also described in tear fluid of patients with dry eye.17,18 Recently, cathelicidin, an antimicrobial peptide with pro-inflammatory action, was found to be expressed in greater levels in the skin of individuals with rosacea than in normal facial skin.19 These peptides promote leukocyte chemotaxis, angiogenesis, and extracellular matrix component expression. Vascular dilation and incompetence may also contribute to the signs and symptoms of rosacea.20 Microbial organisms such as Helicobacter pylori and Demodex folliculorum have been identified as possible causative factors in exacerbation of the disease.21–23 H. pylori expressing cytotoxin-associated A (CagA) was found in the majority of rosacea patients, and its eradication was shown to influence the clinical outcome of this disease.24,25
Our study employed the tear film as an investigatory tool in the diagnosis of roseatic disease of the eye. The tear film, composed of lipid, aqueous, and mucin layers, has many functions, including maintaining a smooth surface for light refraction, supplying the cornea with nutrients, and defending the ocular surface from pathogens. Mucins comprise one of the major components of tear fluid; these are heavily glycosylated glycoproteins expressed by mucosal epithelial cells. Up to 80% of their mass is comprised of carbohydrates.26 Ocular mucins provide lubrication to the ocular surface and promote tear stability, being crucial for the maintenance of the epithelial cells.
Changes in glycosylation in disease states are supported by 50 years of glycobiology. It has been shown that glycosylation is strongly affected by diseases such as cancer. Increased levels of fucosylation have been implicated in a number of pathologies, such as inflammatory conditions and cancer.27–29
Glycomics is the comprehensive study of all glycans expressed in biological systems, eg, tear fluid, serum, or saliva. As new methods for profiling the glycome are becoming more readily available, the search for biomarkers is intensifying. In the past, tear proteomic analysis has been more commonly used for disease diagnosis. However, the study of oligosaccharides in human tears and saliva has not been explored. Glycans offer some advantages as biomarkers, since their biosynthesis is more affected by diseases than proteins, and, technically, it is easier to identify and quantify oligosaccharide expression than protein expression.
To date, the analysis of human tears has been performed largely by investigating its protein components. There have been only a few studies on alteration of mucins in dry eye syndromes, but they identify a change in mucin gene expression and translation, as well as mucin post-translational processing. A study using real-time quantitative polymerase chain reaction revealed that the gel-forming mucin MUC5AC, secreted by goblet cells, is significantly lower in the conjunctival epithelium of patients with Sjögren syndrome.30 The glycosylation of mucins is also affected by dry eye syndromes. Another study on ocular cicatricial pemphigoid showed that the expression of glycosyltransferases that initiate O-glycosylation on mucins is altered in such patients, leading to a change in carbohydrate structures on the mucins.31
Since dry eye syndromes have been shown to alter glycans, the evaporative dry eye present in rosacea patients could have been responsible for the altered tear glycan profile in our patients. However, we found a similar glycan profile change in roseatic saliva; therefore, we speculate that this profile could be specific for rosacea disease itself, since rosacea patients do not have any particular oral disease.
We looked at saliva in this study because of the importance of mucin in salivary secretions. Saliva is produced and secreted by salivary glands (parotid, submandibular, sublingual, and minor salivary glands). In human whole saliva, mucins are the major components of total salivary proteins.32 Salivary mucins play an important role in mucosal integrity and lubrication, in speech, as well as in food-related functions, such as food preparation and digestion.33
Certain systemic diseases are known to affect the composition of saliva.34 Analysis of saliva may, therefore, be useful as a diagnostic tool for systemic disorders. Whole saliva is most frequently used for the evaluation of these diseases, and its collection is a noninvasive, nonpainful procedure that can be performed by individuals with limited training.
Commonly, ocular rosacea patients have dry eyes, and, therefore, collecting tears from these patients can be challenging. The first samples examined did not contain enough volume to be analyzed individually. For this reason and also to determine overall glycan profiles, the samples were pooled initially. Subsequently, individual samples were examined to observe individual variations in glycosylation. We found that the individual samples mirrored the pooled samples, showing very similar glycan profiles.
Most N-glycans were highly fucosylated, whereas O-glycans were sulfated. Sulfated O-glycans were abundant in tear and saliva of ocular rosacea patients, being greatly increased in patient saliva compared to controls. This result is consistent with our previous study, in which we analyzed O-glycan profile and showed abundance of these oligosaccharides in tear fluid of patients with rosacea.8 On the other hand, fucosylated N-glycans were present in control samples, being dramatically decreased in both patient tear and saliva. Highly novel glycans were characterized in this study and may be potential biomarkers for the disease.
We found that the saliva glycan profile largely reflects that of tears, with the number of glycans in saliva samples being much greater than that found in tear samples. Since it is frequently difficult to collect a sufficient volume of tears from rosacea patients, and since saliva and tears behave similarly, it may be possible to analyze only saliva samples from rosacea patients in the future. As a noninvasive, quick, and relatively simple diagnostic tool, salivary analysis provides advantages for biomarker discovery.34,35
Finally, we speculate that sulfation and glycosylation may play a role in the disease-producing mechanisms of rosacea. Sulfated O-linked oligosaccharides have been shown to play a role in cell signaling, adhesion, and inflammation. Changes in tear mucin structure and concentration may contribute to chronic inflammation and disease exacerbation.
CONCLUSION
We determined the glycan profile in rosacea patients’ saliva and tear compared with normal, nonroseatic controls. Our results show a reduction in fucosylated N-glycans and a dramatic increase in sulfated O-glycans in ocular rosacea patient samples. These are highly novel glycans and may potentially lead to an objective biomarker for this disease. Our results take us one step further toward finding a quick and definite diagnostic test for rosacea. These findings may also suggest that sulfation and fucosylation play a role in the physiology and progression of ocular rosacea.
Acknowledgments
This study was funded in part by Research to Prevent Blindness, Inc., New York, NY, and by CAPES (Brazil) grant to ACV. The sponsor or funding organizations had no role in the design or conduct of this research.
Footnotes
The authors have no commercial or proprietary interest in any concept or product discussed in this article.
References
- 1.Alvarenga LS, Mannis MJ. Ocular rosacea. Ocul Surf. 2005;3:41–58. doi: 10.1016/s1542-0124(12)70121-0. [DOI] [PubMed] [Google Scholar]
- 2.Ghanem VC, Mehra N, Wong S, Mannis MJ. The prevalence of ocular signs in acne rosacea: comparing patients from ophthalmology and dermatology clinics. Cornea. 2003;22:230–3. doi: 10.1097/00003226-200304000-00009. [DOI] [PubMed] [Google Scholar]
- 3.Blalock TD, Spurr-Michaud SJ, Tisdale AS, Gipson IK. Release of membrane-associated mucins from ocular surface epithelia. Invest Ophthalmol Vis Sci. 2008;49:1864–71. doi: 10.1167/iovs.07-1081. [DOI] [PMC free article] [PubMed] [Google Scholar]
- 4.Guzman-Aranguez A, Argüeso P. Structure and biological roles of mucin-type O-glycans at the ocular surface. Ocul Surf. 2010;8:8–17. doi: 10.1016/s1542-0124(12)70213-6. [DOI] [PMC free article] [PubMed] [Google Scholar]
- 5.Zaia J. Mass spectrometry and the emerging field of glycomics. Chem Biol. 2008;15:881–92. doi: 10.1016/j.chembiol.2008.07.016. [DOI] [PMC free article] [PubMed] [Google Scholar]
- 6.Mantelli F, Argüeso P. Functions of ocular surface mucins in health and disease. Curr Opin Allergy Clin Immunol. 2008;8:477–83. doi: 10.1097/ACI.0b013e32830e6b04. [DOI] [PMC free article] [PubMed] [Google Scholar]
- 7.Lebrilla CB, An HJ. The prospects of glycan biomarkers for the diagnosis of diseases. Mol Biosyst. 2009;5:17–20. doi: 10.1039/b811781k. [DOI] [PubMed] [Google Scholar]
- 8.An HJ, Ninonuevo M, Aguilan J, et al. Glycomics analyses of tear fluid for the diagnostic detection of ocular rosacea. J Proteome Res. 2005;4:1981–7. doi: 10.1021/pr0501620. [DOI] [PubMed] [Google Scholar]
- 9.Wilkin J, Dahl M, Detmar M, et al. Standard classification of rosacea: Report of the National Rosacea Society Expert Committee on the Classification and Staging of Rosacea. J Am Acad Dermatol. 2002;46:584–7. doi: 10.1067/mjd.2002.120625. [DOI] [PubMed] [Google Scholar]
- 10.An HJ, Miyamoto S, Lancaster KS, et al. Profiling of glycans in serum for the discovery of potential biomarkers for ovarian cancer. J Proteome Res. 2006;5:1626–35. doi: 10.1021/pr060010k. [DOI] [PubMed] [Google Scholar]
- 11.Starr PAJ, McDonald A. Oculo-cutaneous aspects of rosacea. Proc R Soc Med. 1969;62:9–11. [PMC free article] [PubMed] [Google Scholar]
- 12.Gracner B, Pahor D, Gracner T. Repair of an extensive corneoscleral perforation in a case of ocular rosacea with a keratoplasty. Klin Monbl Augenheilkd. 2006;223:841–3. doi: 10.1055/s-2006-926720. [DOI] [PubMed] [Google Scholar]
- 13.Vieira AC, Mannis MJ. Spontaneous scleral perforation in ocular rosacea. Vision Pan-America. 2009;8:149–51. [Google Scholar]
- 14.Sobrin L, Liu Z, Monroy D, et al. Regulation of MMP-9 activity in human tear fluid and corneal epithelial culture supernatant. Invest Ophthalmol Vis Sci. 2000;41:1703–9. [PubMed] [Google Scholar]
- 15.Afonso AA, Sobrin L, Monroy D, et al. Tear film gelatinase B activity correlates with IL-1 alfa concentration and fluorescein clearance. Invest Ophthalmol Vis Sci. 1999;40:2506–12. [PubMed] [Google Scholar]
- 16.Barro CD, Romanet JP, Fdili A, et al. Gelatinase concentration in tears of corneal-grafted patients. Curr Eye Res. 1998;17:174–82. doi: 10.1076/ceyr.17.2.174.5602. [DOI] [PubMed] [Google Scholar]
- 17.Solomon A, Dursun D, Liu Z, et al. Pro- and anti-inflammatory forms of interleukin-1 in the tear fluid and conjunctiva of patients with dry-eye disease. Invest Ophthalmol Vis Sci. 2001;42:2283–92. [PubMed] [Google Scholar]
- 18.Massingale ML, Li X, Vallabhajosyula M, et al. Analysis of inflammatory cytokines in the tears of dry eye patients. Cornea. 2009;28:1023–7. doi: 10.1097/ICO.0b013e3181a16578. [DOI] [PubMed] [Google Scholar]
- 19.Yamasaki K, Di Nardo A, Bardan A, et al. Increased serine protease activity and cathelicidin promotes skin inflammation in rosacea. Nat Med. 2007;13:975–80. doi: 10.1038/nm1616. [DOI] [PubMed] [Google Scholar]
- 20.Crawford GH, Pelle MT, James WD. Rosacea: I. Etiology, pathogenesis, and subtype classification. J Am Acad Dermatol. 2004;51:327–41. doi: 10.1016/j.jaad.2004.03.030. [DOI] [PubMed] [Google Scholar]
- 21.Georgala S, Katoulis AC, Kylafis GD, et al. Increased density of Demodex folliculorum and evidence of delayed hypersensitivity reaction in subjects with papulopustular rosacea. J Eur Acad Dermatol Venereol. 2001;15:441–4. doi: 10.1046/j.1468-3083.2001.00331.x. [DOI] [PubMed] [Google Scholar]
- 22.Lacey N, Delaney S, Kavanagh K, Powell FC. Mite-related bacterial antigens stimulate inflammatory cells in rosacea. Br J Dermatol. 2007;157:474–81. doi: 10.1111/j.1365-2133.2007.08028.x. [DOI] [PubMed] [Google Scholar]
- 23.Diaz C, O’Callaghan CJ, Khan A, Ilchyshyn A. Rosacea: a cutaneous marker of Helicobacter pylori infection? Results of a pilot study. Acta Derm Venereol. 2003;83:282–6. doi: 10.1080/00015550310016544. [DOI] [PubMed] [Google Scholar]
- 24.Utaş S, Ozbakir O, Turasan A, Utas C. Helicobacter pylori eradication treatment reduces the severity of rosacea. J Am Acad Dermatol. 1999;40:433–5. doi: 10.1016/s0190-9622(99)70493-7. [DOI] [PubMed] [Google Scholar]
- 25.Szlachic A, Siliwowski Z, Karczewska E, et al. Helicobacter pylori and its eradication in rosacea. J Physiol Pharmacol. 1999;50:777–86. [PubMed] [Google Scholar]
- 26.Moniaux N, Escande F, Porchet N, et al. Structural organization and classification of the human mucin genes. Front Biosci. 2001;6:D1192–206. doi: 10.2741/moniaux. [DOI] [PubMed] [Google Scholar]
- 27.An HJ, Kronewitter SR, de Leoz MLA, Lebrilla CB. Glycomics and disease markers. Curr Opin Chem Biol. 2009;13:1–7. doi: 10.1016/j.cbpa.2009.08.015. [DOI] [PMC free article] [PubMed] [Google Scholar]
- 28.de Leoz MLA, An HJ, Kronewitter S, et al. Glycomic approach for potential biomarkers on prostate cancer: profiling of N-linked glycans in human sera and pRNS cell lines. Dis Markers. 2008;25:243–58. doi: 10.1155/2008/515318. [DOI] [PMC free article] [PubMed] [Google Scholar]
- 29.Kirmiz C, Li B, An HJ, et al. A serum glycomics approach to breast cancer biomarkers. Mol Cell Proteomics. 2007;6:43–55. doi: 10.1074/mcp.M600171-MCP200. [DOI] [PubMed] [Google Scholar]
- 30.Argüeso P, Balaram M, Spurr-Michaud S, et al. Decreased levels of goblet cell mucin MUC5AC in tears of patients with Sjogren’s syndrome. Invest Ophthalmol Vis Sci. 2002;43:1004–11. [PubMed] [Google Scholar]
- 31.Argüeso P, Tisdale A, Mandel U, et al. The cell-layer and cell-type specific distribution of GalNAc-transferases in the ocular surface epithelia is altered during keratinization. Invest Ophthalmol Vis Sci. 2003;44:86–92. doi: 10.1167/iovs.02-0181. [DOI] [PubMed] [Google Scholar]
- 32.Tabak LA, Levine MJ, Mandel ID, Ellison SA. Role of salivary mucins in the protection of the oral cavity. J Oral Pathol. 1982;11:1–17. doi: 10.1111/j.1600-0714.1982.tb00138.x. [DOI] [PubMed] [Google Scholar]
- 33.Amerongen AVN, Bolscher JGM, Veerman ECI. Salivary mucins: protective functions in relation to their diversity. Glycobiology. 1995;5:733–40. doi: 10.1093/glycob/5.8.733. [DOI] [PubMed] [Google Scholar]
- 34.Kaufman E, Lamster IB. The diagnostic applications of saliva – a review. Crit Rev Oral Biol Med. 2002;13:197–212. doi: 10.1177/154411130201300209. [DOI] [PubMed] [Google Scholar]
- 35.Estrella RP, Whitelock JM, Packer NH, Karlsson NG. The glycosylation of human synovial lubricin: implications for its role in inflammation. Biochem J. 2010;429:359–67. doi: 10.1042/BJ20100360. [DOI] [PubMed] [Google Scholar]