

Abstract
Background
Obesity may be an important risk factor for end-stage renal disease (ESRD) but the association between the obesity measure waist circumference (WC) and ESRD remains poorly explored.
Study Design
Longitudinal population-based cohort
Setting and Participants
Participants in the REasons for Geographic and Racial Differences in Stroke (REGARDS) study (n=30, 239) with body mass index (BMI), WC, spot urine albumin-to-creatinine ratio (ACR), and estimated glomerular filtration rate (eGFR) measured at baseline (n=26, 960).
Predictor
Obesity as defined by an elevated WC or BMI
Outcomes and Measurements
Incident cases of ESRD were identified through linkage of REGARDS study participants with the United States Renal Data System.
Results
The mean baseline age was 64.8 years, 45.8% were male, 40.3% were black and 12.1% reported less than a high school education. Overall, 297 individuals developed ESRD (1.1%) during a median of 6.3 years. After adjustment for all covariates including WC, no significant association was noted between any BMI category and ESRD incidence compared to the referent group (BMI 18.5–24.9 kg/m2). Higher WC categories showed significantly increased hazard rates of ESRD with WC ≥ 108 cm in women and ≥ 122 cm in men (highest category) showing a 2.81-fold higher hazard rate (95% CI 1.89, 4.17) for ESRD after adjusting for age, sex, race, region, income and education compared to the referent group (< 80 cm in women and < 94 cm in men),. Further adjustment for BMI strengthened the associations between WC categories and ESRD incidence (HR 3.79; 95% CI 2.10, 6.86 for the highest WC category compared to referent group). However, no significant association was noted between any WC category and ESRD incidence after adjustment for obesity associated co-morbidities, baseline ACR and eGFR.
Limitations
The median follow-up period (6.3 years) may have been too short to adequately assess ESRD risk among adults with an eGFR > 60 ml/min/1.73 m2.
Conclusion
In this older cohort of adults followed for 6 years, obesity as measured by WC is associated with higher ESRD risk even with adjustment for BMI while obesity as measured by BMI is not associated with higher ESRD risk after adjustment for WC. However, the association between increased WC and ESRD risk is markedly attenuated and no longer statistically significant after adjustment for obesity related co-morbidities, eGFR and ACR.
Keywords: Adiposity, obesity, waist circumference, BMI, end-stage renal disease, chronic kidney disease, chronic renal failure, renal failure, USRDS, United States Renal Data System, dialysis
Introduction
Obesity is associated with chronic kidney disease (CKD) among adults and is an important risk factor for the development of end-stage renal disease (ESRD), defined as kidney failure requiring dialysis or transplantation.1–6 The association between obesity and kidney disease remains poorly understood and may be mediated by well-known risk factors for CKD that are shared with obesity including diabetes3, 5, 7 and hypertension.8–11 Fairly weak associations are noted between obesity, as defined by an elevated BMI, and early stages of incident CKD.3, 4, 12 Obesity may be estimated by body mass index (BMI), waist circumference (WC), waist-to-hip ratio or with direct measures of total body fat. In population-based studies and clinical practice, obesity is often assessed by an individual’s BMI. However, BMI is a composite measure of muscle mass, peripheral and abdominal adipose tissue and bone mass. The lack of specificity of BMI may account for the weak and inconsistent associations noted between incident CKD and obesity as assessed by BMI.3, 4, 12–15
Diabetes and hypertension are strongly associated with abdominal adiposity16–19 and WC may show stronger associations with ESRD risk compared to BMI. We have previously reported that abdominal adiposity, measured by WC, is associated with increased risk of mortality in individuals with CKD, while, after controlling for WC, higher BMI is associated with decreased mortality.20 This study examines the associations between obesity, as measured by BMI or WC, and incident ESRD in the population-based REasons for Geographic And Racial Differences in Stroke (REGARDS) cohort study.
Methods
Participants
The REGARDS study is a population-based prospective cohort of individuals aged 45 years and older designed to study reasons for the higher stroke mortality among blacks versus whites and in the Southeast region of the US.21, 22 REGARDS is a cohort study of a national sample, 20.9% of whom reside in the coastal plain of North Carolina (NC), South Carolina (SC), and Georgia (GA), 34.5% in the remainder of NC, SC, and GA and the southeastern states of Tennessee, Mississippi, Alabama, Louisiana and Arkansas, and 44.5% in the other 42 contiguous states. Black adults were oversampled; a total of 30,239 adults were recruited into the cohort between January 2003 and October 2007. Baseline data collection included a telephone interview followed by an in-home physical examination by trained staff.21 The physical exam included anthropomorphic measures (weight, height and WC), phlebotomy, and collection of a spot urine specimen. We excluded 3,279 participants, 10.8% of the cohort, who were missing data on the albumin-to-creatinine ratio (ACR), serum creatinine, BMI or WC measurements, or who had a BMI < 18.5 kg/m2, an eGFR < 15 ml/min/1.73 m2, or reported being treated for ESRD during the baseline telephone interview. The REGARDS study was approved by the institutional review boards of the participating institutions, and all participants provided verbal consent before the telephone interview was conducted and written informed consent before completion of the in-home study visit.
Kidney Function
Serum creatinine was calibrated to an international isotope dilution mass spectroscopic (IDMS)-traceable standard, measured by colorimetric reflectance spectrophotometry (Ortho Vitros Clinical Chemistry System 950IRC. Estimated glomerular filtration rate (eGFR) was calculated using the CKD-EPI equation.23 Albumin and creatinine were measured in a random spot urine specimen by nephelometry (BN ProSpec Nephelometer, Dade Behring, Marburg, Germany) and Modular-P chemistry analyzer (Roche/Hitachi, Indianapolis, IN), respectively. A spot urine ACR was calculated and moderate to severely increased urine albumin excretion was defined as an ACR ≥ 30 mg/g. Incident cases of ESRD were identified through linkage of REGARDS study participants with the United States Renal Data System (USRDS). This analysis included incident ESRD cases through August 31, 2012. The USRDS is a registry of ESRD and captures over 95% of all incident ESRD cases in the U.S.
Obesity Measures
BMI was calculated as weight (kg)/height (m2) and categorized as 18.5–24.9 (ideal); 25.0–29.9 (overweight), 30.0–34.9 (class I obesity), 35.0–39.9 (class II obesity) and ≥ 40 (class III obesity).24 Waist circumference was measured mid-way between the lowest rib and the iliac crest using a tape measure with the participant standing and was categorized in cm as < 80 in women and < 94 in men (referent group), 80–87.9 in women and 94–101.9 in men, 88–97.9 in women and 102–111.9 in men, 98–107.9 in women and 112–121.9 in men, and ≥ 108 in women and ≥ 122 in men.24
Covariates
Coronary artery disease, stroke, smoking status, education, and family income were ascertained by self-report during the telephone interview. Hypertension was defined as either self-reported use of antihypertensive medications or a systolic blood pressure (SBP) ≥ 140 mm Hg or a diastolic blood pressure (DBP) ≥ 90 mm Hg measured during the home examination, where SBP and DBP were the average of two measures taken in the seated position. We defined diabetes as a fasting glucose ≥ 126 mg/dL, or a non-fasting glucose ≥ 200 mg/dL, or current use of either oral hypoglycemic pills or insulin.
Statistical Analysis
Univariate statistics are reported as mean ± standard deviation (SD) or counts and proportions. Cox proportional hazards models were used to determine the independent associations between BMI and WC categories with ESRD. Follow-up time was censored at development of ESRD, death, or date of last follow-up phone contact, whichever occurred first. Separate models were created to examine BMI and WC as independent variables. Sequential models were created to examine changes in the parameter estimates with the adjustment for BMI or WC (Model 2), for obesity associated co-morbidities (Model 3) and for ACR (Model 4). Model 1 adjusted for age, sex, race, sampling region, household income and education. Model 2 then included WC or BMI as a covariate and Model 3 further adjusted for the presence of co-morbid conditions (coronary heart disease, stroke, hypertension and diabetes), and baseline eGFR. Model 4 then added log transformed baseline ACR to Model 3. The referent group was the lowest BMI group (BMI 18.5–24.9 kg/m2) for the analyses with BMI as the main independent variable and the lowest WC group (< 80 cm in women and < 94 cm in men) for the analysis with WC as the main independent variable. We tested for trends for ESRD risk across BMI and WC categories by substituting interval measures of these covariates.
Co-linearity between the categorical measures of BMI and WC was first tested by calculating the Spearman rank correlation coefficient between the two measures and then by calculating the tolerance value, which estimates the proportion of variance in a given predictor that is not explained by the other. Although BMI and WC were correlated (r=0.7877, p<0.0001), formal tests for co-linearity between WC and BMI showed a tolerance value of 0.3976. The reciprocal of the tolerance value (variance inflation factor) was 2.6346 with values ≥ 5 generally indicating co-linearity.25 The assumptions of the Cox proportional hazards models were examined by plotting the natural log of the cumulative hazard of ESRD by the natural log of time. A two sided p value of 0.05 was considered statistically significant.
Results
The mean (SD) baseline age of the REGARDS participants was 64.8 (9.4) years with 45.1% older than 65 years. Overall, 45.8% were male and 40.3% were black and 12.1% reported less than a high school education. Annual household income was reported as less than $20,000 by 17.3% of participants. The prevalence of co-morbid conditions included previous stroke in 6.0%, coronary heart disease in 17.4%, hypertension in 58.8% and diabetes in 20.7%. The mean (SD) WC was 92.8 (15.7) cm and 100.2 (13.2) cm among women and men, respectively (p<0.001), while mean BMI was 30.0 (6.8) kg/m2 and 28.6 (4.9) kg/m2 among men and women, respectively (p<0.001). Tables 1a and 1b show the baseline characteristics by BMI and WC categories. As BMI and WC increased, individuals tended to be younger, more likely to be female and black, have lower educational attainment and household income, and have increased prevalence of diabetes and hypertension (all p<0.001). The percentage of participants aged ≥ 65 years ranged from as high as 52.2% in the lowest BMI category to 6.3% in the highest BMI category. Across WC categories, the percentage of participants aged ≥ 65 years ranged from 48.3% among women and men with WC 88.0–97.9 cm and 102–111.9 cm, respectively, to 35.7% among women and men with WC ≥ 108 cm and ≥ 122 cm, respectively.
Table 1a.
Baseline Characteristics of the Study Population by Body Mass Index (BMI) Categories†
| BMI Categories in kg/m2 | |||||
|---|---|---|---|---|---|
| 18.5–24.9 | 25.0–29.9 | 30.0–34.9 | 35.0–39.9 | ≥ 40 | |
| N | 6453 | 10165 | 6043 | 2677 | 1622 |
| Age (years) | 66.3 (10.2) | 65.5 (9.3) | 64.0 (8.8) | 62.4 (8.4) | 61.0 (7.8) |
| % Age > 65 years | 52.2 | 48.9 | 42.8 | 33.7 | 6.3 |
| % Female | 55.1 | 46.0 | 54.9 | 65.1 | 76.8 |
| % Black | 29.2 | 36.4 | 46.3 | 54.5 | 63.8 |
| % Less than High School education | 9.9 | 11.2 | 13.0 | 15.2 | 17.8 |
| % Low Income | 15.8 | 15.0 | 17.5 | 22.7 | 28.0 |
| % Prior Stroke | 5.8 | 6.0 | 5.7 | 6.5 | 6.5 |
| % Coronary Heart disease | 16.4 | 18.2 | 18.5 | 18.9 | 15.0 |
| % Hypertension | 44.5 | 55.9 | 66.9 | 74.3 | 80.4 |
| % Diabetes | 10.3 | 17.0 | 27.1 | 36.4 | 44.2 |
| ACR2 (mg/g) | 7.2 (4.7, 14.4) | 7.0 (4.5, 13.8) | 7.5 (4.6, 16.5) | 8.1 (5.0, 21.3) | 8.8 (5.0, 22.2) |
| eGFR3 ml/min/1.73 m2 | 84.6 (18.5) | 84.3 (19.0) | 85.6 (19.7) | 87.8 (21.0) | 89.4 (22.7) |
p<0.001 for all comparisons across BMI categories except for prior stroke (p=0.6)
ACR = albumin/creatinine ratio in mg/g measured in a random urine specimen
eGFR = estimated glomerular filtration rate using the CKD-Epi formula
Table 1b.
Baseline Characteristics of the Study Population by Sex-Specific Waist Circumference (WC) Categories1
| Waist Circumference Categories in cm | |||||
|---|---|---|---|---|---|
| Women< 80 Men< 94 |
Women 80–87.9 Men 94–101.9 |
Women 88–97.9 Men 102–111.9 |
Women 98–107.9 Men 112–121.9 |
Women ≥ 108/ Men ≥ 122 |
|
| N | 7607 | 6188 | 6393 | 3740 | 3032 |
| Age (years) | 64. 9 (9.8) | 65.5 (9.5) | 65.3 (9.2) | 64.4 (9.1) | 62.8 (8.3) |
| % Age > 65 years | 45.2 | 48.1 | 48.3 | 42.9 | 35.7 |
| % Female | 42.9 | 46.7 | 56.9 | 68.6 | 77.6 |
| % Black | 32.4 | 35.1 | 41.4 | 49.6 | 57.4 |
| % Less than High School education | 32.4 | 35.1 | 41.4 | 49.6 | 57.4 |
| %Low Income 2 | 9.0 | 10.4 | 13.2 | 13.6 | 19.1 |
| % Prior Stroke | 12.9 | 14.1 | 17.9 | 21.4 | 28.5 |
| % Coronary Heart disease | 4.9 | 6.0 | 6.1 | 6.6 | 7.6 |
| % Hypertension | 15.8 | 17.7 | 19.3 | 18.9 | 17.9 |
| % Diabetes | 9.2 | 15.0 | 23.1 | 30.1 | 45.1 |
| ACR (mg/g) | 6.5 (4.3, 12.5) | 7.1 (4.6, 14.3) | 7.5 (4.8, 15.4) | 8.3 (5.0, 19.4) | 9.3 (5.2, 25.7) |
| eGFR (ml/min/1.73 m2) | 85.8 (17.9) | 84.5 (18.7) | 84.6 (19.7) | 85.6 (21.1) | 87.1 (22.4) |
p<0.001 for all comparisons across WC categories
ACR = albumin/creatinine ratio in mg/g measured in a random urine specimen
eGFR = estimated glomerular filtration rate using the CKD-Epi formula
Albuminuria was noted in 18.9% of participants while 14.8% had an eGFR< 60 ml/min/1.73m2. Figure 1 shows the percentage of participants with moderate to severely increased ACR and eGFR < 60 ml/min/1.73 m2 by BMI and WC categories. Prevalence of both moderate to severely increased ACR and eGFR < 60 ml/min/1.73 m2 differed significantly by BMI and WC categories (p < 0.001 for all comparisons). Among participants in the highest BMI category, 20.7% had moderate to severely increased urine albumin excretion and 12.0% had eGFR < 60 ml/min/1.73 m2. In the highest WC category, 22.5% had moderate to severely increased urine albumin excretion and 13.2% had eGFR < 60 ml/min/1.73 m2.
Figure 1.
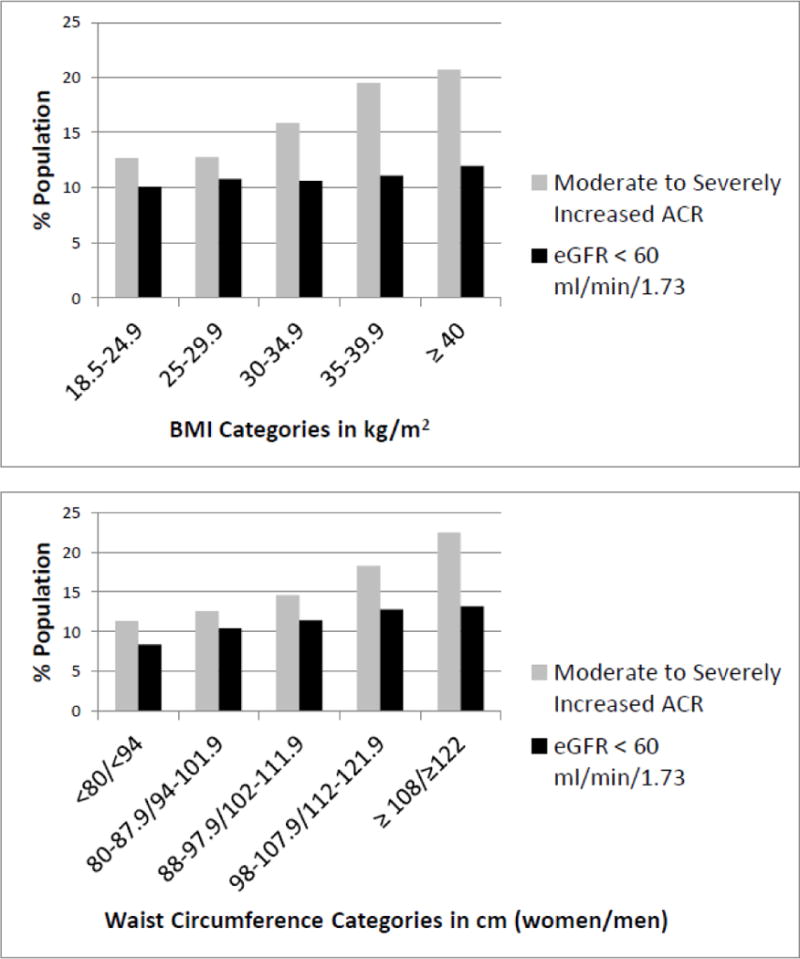
Percentage of moderate to severely increased albumin-to-creatinine ratios (ACR) and estimated glomerular filtration rate (eGFR) < 60 ml/min/1.73m2 by BMI categories in kg/m2 (top) and by waist circumference categories in cm (bottom). Moderate to severely increased ACR defined as an ACR ≥ 30 mg/g in a spot urine sample. P <0.001 for all comparisons across categories of waist circumference and BMI
Overall, 297 individuals developed ESRD (1.1%) during a median (interquartile range) follow-up of 6.3 (5.1 to 7.6) years. Table 2 shows the frequency and incidence rate of ESRD by BMI and WC categories. ESRD rates ranged from as low as 113.5 cases per 100,000 person-years among those with BMI between 18.5 – 24.9 kg/m2 to as high as 212.4 cases per 100,000 person-years among those with BMI between 35.0–39.9 kg/m2. ESRD rates showed a fairly linear increase across increasing WC categories from 83.6 cases per 100,000 person-years in the lowest category WC category to 250.6 cases per 100,000 person-years in the highest WC category.
Table 2.
ESRD Cumulative Incidence and ESRD Rate among the REGARDS Participants by Body Mass Index (BMI) and Waist Circumference (WC) Categories
| BMI Categories in kg/m2 | |||||
|---|---|---|---|---|---|
| 18.5–24.9 | 25.0–29.9 | 30.0–34.9 | 35.0–39.9 | ≥ 40 | |
| ESRD cases | 55 | 94 | 82 | 40 | 26 |
| % ESRD1 | 0.9 | 0.9 | 1.4 | 1.5 | 1.6 |
| ESRD Rate per 100,000 person-years1 | 116.1 | 124.9 | 185.5 | 206.3 | 224.4 |
| Waist Circumference Categories in cm | |||||
| Women < 80 Men< 94 |
Women 80–87.9 Men 94–101.9 |
Women 88–97.9 Men 102–111.9 |
Women 98–107.9 Men 112–121.9 |
Women ≥ 108 Men ≥ 122 |
|
| ESRD cases | 52 | 64 | 79 | 45 | 57 |
| % ESRD1 | 0.7 | 1.0 | 1.2 | 1.4 | 1.9 |
| ESRD Rate per 100,000 person-years1 | 92.9 | 140.0 | 168.6 | 164.8 | 259.4 |
p<0.001 for all comparisons across WC and BMI categories
In the model adjusted for age, sex, race, region, income and education, a BMI of 30–34.9, 35–39.9 and ≥ 40 kg/m2 was associated with higher ESRD incidence compared to the referent group 18.5–24.9 with hazard ratios of 1.41 (95% CI 1.00, 1.99), .1.55 (95% CI 1.03, 2.38), and 1.66 (95% CI 1.02, 2.68), respectively (Figure 2). After adjustment for WC and obesity associated co-morbidities and eGFR, BMI categories ≥ 35 kg/m2 were associated with significantly lower ESRD risk compared to the referent group with hazard ratios of 0.48 (95% CI 0.27, 0.86) for BMI 35–39.9 kg/m2 and 0.47 (95% CI 0.24, 0.92) for BMI ≥ 40 kg/m2. Further adjustment for ACR led to no significant associations between BMI categories and ESRD incidence.
Figure 2. Multivariable adjusted hazard ratio for end-stage renal disease by BMI and waist circumference (WC) categories.
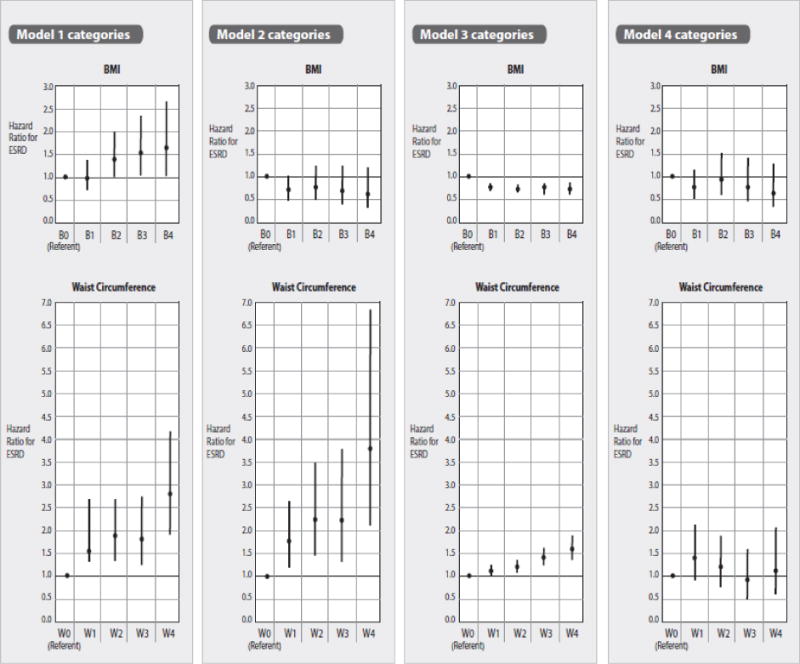
B0, B1, B2 B3, B4 corresponds to BMI in kg/m2 18.5–24.9 (referent group), 25.0–29.9, 30.0–34.9, 35.0–39.9 and ≥ 40. W0, W1, W2, W3, W4 corresponds to waist circumference cm < 80 in women and < 94 in men (referent group), 80–87.9 in women and 94–101.9 in men, 88–97.9 in women and 102–111.9 in men, 98–107.9 in women and 112–121.9 in men, and ≥ 108 in women and ≥ 122 in men. Model 1 adjusted for age, gender, race, sampling region, household income and education. Model 2 added WC or BMI as a covariate to Model 1; Model 3 added presence of co-morbid conditions (coronary heart disease, stroke, hypertension and diabetes) and eGFR to Model 2. Model 4 added log transformed baseline ACR to Model 3.
Associations between the WC categories and ESRD incidence were somewhat stronger compared to the associations between BMI categories and WC categories. In Model 1, which adjusted for age, sex, race, region, income and education, all WC categories were associated with significantly higher ESRD risk compared to the referent group. Participants with a WC ≥ 108 cm in women and ≥ 122 cm in men (highest category) had a 2.81 fold higher hazard rate for ESRD (95% CI 1.89, 4.17) compared to the WC referent group (< 80 cm in women and < 94 cm in men). Further adjustment for BMI strengthened the associations between WC categories and ESRD incidence with the highest WC category showing a 3.79 fold higher ESRD rate compared to the referent group (95% CI 2.10, 6.86). However, after adjustment for obesity associated co-morbidities and baseline ACR and eGFR, no significant association was noted between any WC category and ESRD incidence (Figure 2).
Discussion
This study demonstrates differences in the associations between BMI and WC with incident ESRD among adults in the general population. In particular, increased WC was associated with a higher rate of ESRD after adjustment for BMI while BMI was not associated with higher ESRD rates after adjustment for WC. Postulated factors which mediate the association between obesity and CKD include inflammation, insulin resistance,26 activation of the renin-angiotensin-aldosterone27 and sympathetic nervous systems,28 increased oxidative stress,29 and high caloric intake.30 These factors may lead to hypertension, diabetes and increased urine albumin excretion given the strong link between central adiposity and the metabolic syndrome.31–34 A higher risk of CKD mediated by metabolic syndrome and obesity is supported by previous findings from the REGARDS cohort. Panwar et al demonstrated that the association between high BMI and ESRD risk depends on the metabolic health status of the individual.35 Obesity, as defined by an elevated BMI, was associated with an increased risk for ESRD only among the REGARDS participants with metabolic syndrome. In fact, ESRD risk was lower among obese individuals who were metabolically healthy compared to non-obese individuals with metabolic syndrome.35
Increased urine albumin excretion reflects an increased risk for both ESRD and mortality36 with significantly increased risk noted with ACR levels > 10 mg/g.37. In this study, the association between WC and ESRD was attenuated after adjustment for obesity related co-morbidities and baseline ACR levels. Our findings are similar to results from a subcohort of Women’s Health Initiative (WHI), which included 20, 117 postmenopausal women with a mean follow-up period of 11.6 years.38 The mean age of this WHI cohort was 63.9 years at baseline and 38.3% were African American; WC was categorized as > 88 cm vs. ≤ 88 cm. After adjustment for age, baseline eGFR, race, education, smoking status, and site, a WC > 88 cm was associated with a 2.68 fold higher rate of ESRD compared to WC ≤ 88 cm. However, this association was markedly attenuated after adjustment for diabetes and hypertension (HR 1.49; 95% CI 1.08, 2.06). In REGARDS, abdominal adiposity as measured by WC was associated with significantly higher risk of ESRD compared to the referent group but this association was no longer statistically significant after adjustment for obesity associated co-morbidities, eGFR and ACR. It should be noted that these analyses of WC and ESRD in the WHI subcohort did not include ACR as a covariate because it was not available. The overall prevalence of morbid obesity (WC ≥ 108 cm in Women and ≥ 122 cm in men or BMI ≥ 40 kg/m2) in the REGARDS cohort was substantially higher among women compared to men, findings which reflect sex differences in severe obesity prevalence in the total U.S. adult population.39
Elevated BMI has previously been shown to be associated with incident ESRD.5, 7 Hsu and his associates examined the relationship between BMI and incident ESRD in over 300,000 subjects who volunteered for screening health checkups during years 1964–1985 in a large health care system and were followed for 15–34 years.5 They demonstrated that among individuals with baseline kidney disease, a BMI ≥ 40 kg/m2 was associated with a 3-fold higher risk of ESRD compared to individuals with an ideal BMI (18.5–24.9 kg/m2). This association was even stronger among adults without CKD at baseline.5 The discrepant findings between the study by Hsu et al and this study which focused on REGARDS participants may reflect one or more factors. Participants in the study by Hsu et al were young, (between the ages of 18 to 34 years at baseline) and fairly lean with over half of the participants having an ideal BMI at baseline. In contrast, the baseline mean age of the REGARDS participants was 64.8 years and the average baseline BMI was 29 kg/m2 with the majority of REGARDS participants being either overweight or obese. Also, the length of follow-up, which ranged from 15 to 34 years, in the study by Hsu et al was substantially longer compared to the follow-up period in the REGARDS study. Also, the time period for the cohort utilized in the study by Hsu et al began during years 1964–1985 and treatment of both diabetes and hypertension has changed dramatically since the 1980s. Finally, our fully adjusted models accounted for WC and ACR. While these factors may all account for the differing associations between BMI categories and incident ESRD noted between these two studies, clearly further examination of the associations between BMI, WC and ESRD in younger populations is warranted.
The limitations of this study include the limited follow-up period which may have been too short to adequately assess ESRD risk among adults with an eGFR > 60 ml/min/1.73 m2. Collinearity between WC and BMI may have influenced the parameter estimates for the associations between obesity measures and ESRD incidence that are adjusted for BMI or WC. However, the inverse association between obesity as measured by BMI and ESRD risk after adjustment for WC may be due to the fact that BMI reflects not only peripheral and abdominal adiposity but also muscle mass. The associations between BMI and WC and ESRD mirror associations previously shown between these adiposity measures and mortality in the REGARDS cohort.20 In participant data pooled from the Atherosclerosis Risk in Communities Study and the Cardiovascular Health Study, obesity measured by waist-to-hip ratios was associated with higher mortality while obesity measured by BMI was not.40 The strengths of this study include the large number of both white and black adults with a wide range of socioeconomic backgrounds who were recruited from the Southeast and other U.S. regions. Additional studies are needed to investigate associations between adiposity measures and ESRD risk in other racial/ethnic groups such as Hispanics and Asians.
Increased WC is associated with heightened risk of ESRD while higher BMI is associated with lower ESRD risk after adjustment for WC. The association between increased WC and ESRD appears to be mediated by obesity related co-morbidities and higher ACR values.
Acknowledgments
This research project is supported by a cooperative agreement U01 NS041588 from the National Institute of Neurological Disorders and Stroke, National Institutes of Health, Department of Health and Human Services. The content is solely the responsibility of the authors and does not necessarily represent the official views of the National Institute of Neurological Disorders and Stroke or the National Institutes of Health. Representatives of the funding agency have been involved in the review of the manuscript but not directly involved in the collection, management, analysis or interpretation of the data.
Additional funding was provided by an investigator-initiated grant-in-aid from Amgen Corporation. Amgen did not have any role in the design and conduct of the study, the collection, management, analysis, and interpretation of the data, or the preparation or approval of the manuscript. The manuscript was sent to Amgen for review prior to submission for publication. Partial support was obtained through an investigator-initiated grant (DGW) from Amgen Corporation, which played no role in the design, interpretation or reporting of the data”
The authors would like to thank Tom Mattix for his assistance with graphics.
Footnotes
Disclosures: none
Author contributions: HK and WM take responsibility that this study has been reported honestly, accurately, and transparently; that no important aspects of the study have been omitted, and that any discrepancies from the study as planned (and, if relevant) have been explained.
Study design: HK, WM, OG, DW, RT, and BP; Data interpretation: HK, OG, RT, DW, SJ, PM, BP, and DS. Statistical analysis: OG, SJ, and DS. Each author provided important intellectual input into the study for the manuscript and for the manuscript revisions. All authors accept accountability for the overall work.
References
- 1.Chen J, Muntner P, Hamm LL, et al. The metabolic syndrome and chronic kidney disease in U.S. adults. Ann Intern Med. 2004;140(3):167–174. doi: 10.7326/0003-4819-140-3-200402030-00007. [DOI] [PubMed] [Google Scholar]
- 2.Chen J, Muntner P, Hamm LL, et al. Insulin resistance and risk of chronic kidney disease in nondiabetic US adults. J Am Soc Nephrol. 2003;14(2):469–477. doi: 10.1097/01.asn.0000046029.53933.09. [DOI] [PubMed] [Google Scholar]
- 3.Kramer H, Luke A, Bidani A, Cao G, Cooper R, McGee D. Obesity and prevalent and incident CKD: the Hypertension Detection and Follow-Up Program. Am J Kidney Dis. 2005;46(4):587–594. doi: 10.1053/j.ajkd.2005.06.007. [DOI] [PubMed] [Google Scholar]
- 4.Gelber RP, Kurth T, Kausz AT, et al. Association between body mass index and CKD in apparently healthy men. Am J Kidney Dis. 2005;46(5):871–880. doi: 10.1053/j.ajkd.2005.08.015. [DOI] [PubMed] [Google Scholar]
- 5.Hsu CY, McCulloch CE, Iribarren C, Darbinian J, Go AS. Body mass index and risk for end-stage renal disease. Ann Intern Med. 2006;144(1):21–28. doi: 10.7326/0003-4819-144-1-200601030-00006. [DOI] [PubMed] [Google Scholar]
- 6.Hsu CY, Iribarren C, McCulloch CE, Darbinian J, Go AS. Risk factors for end-stage renal disease: 25-year follow-up. Arch Intern Med. 2009;169(4):342–350. doi: 10.1001/archinternmed.2008.605. [DOI] [PMC free article] [PubMed] [Google Scholar]
- 7.Hsu CY, Iribarren C, McCulloch CE, Darbinian J, Go AS. Risk factors for end-stage renal disease: 25-year follow-up. Arch Intern Med. 2009;169(4):342–350. doi: 10.1001/archinternmed.2008.605. [DOI] [PMC free article] [PubMed] [Google Scholar]
- 8.Liu K, Ruth KJ, Flack JM, et al. Blood pressure in young blacks and whites: relevance of obesity and lifestyle factors in determining differences. The CARDIA Study. Coronary Artery Risk Development in Young Adults. Circulation. 1996;93(1):60–66. doi: 10.1161/01.cir.93.1.60. [DOI] [PubMed] [Google Scholar]
- 9.Wilson PW, D’Agostino RB, Sullivan L, Parise H, Kannel WB. Overweight and obesity as determinants of cardiovascular risk: the Framingham experience. Arch Intern Med. 2002;162(16):1867–1872. doi: 10.1001/archinte.162.16.1867. [DOI] [PubMed] [Google Scholar]
- 10.Kaufman JS, Durazo-Arvizu RA, Rotimi CN, McGee DL, Cooper RS. Obesity and hypertension prevalence in populations of African origin. The Investigators of the International Collaborative Study on Hypertension in Blacks. Epidemiology. 1996;7(4):398–405. doi: 10.1097/00001648-199607000-00010. [DOI] [PubMed] [Google Scholar]
- 11.Kaufman JS, Owoaje EE, James SA, Rotimi CN, Cooper RS. Determinants of hypertension in West Africa: contribution of anthropometric and dietary factors to urban-rural and socioeconomic gradients. Am J Epidemiol. 1996;143(12):1203–1218. doi: 10.1093/oxfordjournals.aje.a008708. [DOI] [PubMed] [Google Scholar]
- 12.Fox CS, Larson MG, Leip EP, Culleton B, Wilson PW, Levy D. Predictors of new-onset kidney disease in a community-based population. JAMA. 2004;291(7):844–850. doi: 10.1001/jama.291.7.844. [DOI] [PubMed] [Google Scholar]
- 13.Othman M, Kawar B, El Nahas AM. Influence of obesity on progression of non-diabetic chronic kidney disease: a retrospective cohort study. Nephron Clin Pract. 2009;113(1):16–23. doi: 10.1159/000228071. [DOI] [PubMed] [Google Scholar]
- 14.Khedr A, Khedr E, House AA. Body mass index and the risk of progression of chronic kidney disease. Journal of Renal Nutrition. 2011;21(6):455–461. doi: 10.1053/j.jrn.2010.12.001. [DOI] [PubMed] [Google Scholar]
- 15.Brown R, Mohsen A, Green D, et al. Body mass index has no effect on rate of progression of chronic kidney disease in non-diabetic patients. Nephrology, dialysis, transplantation: official publication of the European Dialysis and Transplant Association - European Renal Association. 2012 doi: 10.1093/ndt/gfr757. [DOI] [PubMed] [Google Scholar]
- 16.Harris MM, Stevens J, Thomas N, Schreiner P, Folsom AR. Associations of fat distribution and obesity with hypertension in a bi-ethnic population: the ARIC study. Atherosclerosis Risk in Communities Study. Obes Res. 2000;8(7):516–524. doi: 10.1038/oby.2000.64. [DOI] [PubMed] [Google Scholar]
- 17.Wang Y, Rimm EB, Stampfer MJ, Willett WC, Hu FB. Comparison of abdominal adiposity and overall obesity in predicting risk of type 2 diabetes among men. Am J Clin Nutr. 2005;81(3):555–563. doi: 10.1093/ajcn/81.3.555. [DOI] [PubMed] [Google Scholar]
- 18.Chen L, Peeters A, Magliano DJ, et al. Anthropometric measures and absolute cardiovascular risk estimates in the Australian Diabetes, Obesity and Lifestyle (AusDiab) Study. European Journal of Cardiovascular Prevention & Rehabilitation. 2007;14(6):740–745. doi: 10.1097/HJR.0b013e32816f7739. [DOI] [PubMed] [Google Scholar]
- 19.Ghandehari H, Le V, Kamal-Bahl S, Bassin SL, Wong ND. Abdominal obesity and the spectrum of global cardiometabolic risks in US adults. Int J Obes. 2009;33(2):239–248. doi: 10.1038/ijo.2008.252. [DOI] [PubMed] [Google Scholar]
- 20.Kramer H, Shoham D, McClure LA, et al. Association of waist circumference and body mass index with all-cause mortality in CKD: The REGARDS (Reasons for Geographic and Racial Differences in Stroke) Study. Am J Kidney Dis. 2011;58(2):177–185. doi: 10.1053/j.ajkd.2011.02.390. [DOI] [PMC free article] [PubMed] [Google Scholar]
- 21.Howard VJ, Cushman M, Pulley L, et al. The reasons for geographic and racial differences in stroke study: objectives and design. Neuroepidemiology. 2005;25(3):135–143. doi: 10.1159/000086678. [DOI] [PubMed] [Google Scholar]
- 22.Warnock DG, McClellan W, McClure LA, et al. Prevalence of chronic kidney disease and anemia among participants in the Reasons for Geographic and Racial Differences in Stroke (REGARDS) Cohort Study: baseline results. Kidney Int. 2005;68(4):1427–1431. doi: 10.1111/j.1523-1755.2005.00553.x. [DOI] [PubMed] [Google Scholar]
- 23.Levey AS, Stevens LA, Schmid CH, et al. A new equation to estimate glomerular filtration rate. Ann Intern Med. 2009;150(9):604–612. doi: 10.7326/0003-4819-150-9-200905050-00006. [DOI] [PMC free article] [PubMed] [Google Scholar]
- 24.Obesity: preventing and managing the global epidemic: report of a WHO consultation on obesity. Geneva: Jun 3–5, 1997. 1998. [PubMed] [Google Scholar]
- 25.Farrar DE, Glauber RR. Multicollinearity in regression analysis: The problem revisited. The Review of Economics and Statistics. 1967;49(1):92–107. [Google Scholar]
- 26.Bastard JP, Maachi M, Lagathu C, et al. Recent advances in the relationship between obesity, inflammation, and insulin resistance. Eur Cytokine Netw. 2006;17(1):4–12. [PubMed] [Google Scholar]
- 27.Thethi T, Kamiyama M, Kobori H. The link between the renin-angiotensin-aldosterone system and renal injury in obesity and the metabolic syndrome. Curr Hypertens Rep. 2012;14(2):160–169. doi: 10.1007/s11906-012-0245-z. [DOI] [PMC free article] [PubMed] [Google Scholar]
- 28.Kalil GZ, Haynes WG. Sympathetic nervous system in obesity-related hypertension: mechanisms and clinical implications. Hypertension Research - Clinical & Experimental. 2012;35(1):4–16. doi: 10.1038/hr.2011.173. [DOI] [PMC free article] [PubMed] [Google Scholar]
- 29.Furukawa S, Fujita T, Shimabukuro M, et al. Increased oxidative stress in obesity and its impact on metabolic syndrome. J Clin Invest. 2004;114(12):1752–1761. doi: 10.1172/JCI21625. [DOI] [PMC free article] [PubMed] [Google Scholar]
- 30.Afshinnia F, Wilt TJ, Duval S, Esmaeili A, Ibrahim HN. Weight loss and proteinuria: systematic review of clinical trials and comparative cohorts. Nephrology Dialysis Transplantation. 2010;25(4):1173–1183. doi: 10.1093/ndt/gfp640. [DOI] [PubMed] [Google Scholar]
- 31.Kramer H, Reboussin D, Bertoni AG, et al. Obesity and albuminuria among adults with type 2 diabetes: the Look AHEAD (Action for Health in Diabetes) Study. Diabetes Care. 2009;32(5):851–853. doi: 10.2337/dc08-2059. [DOI] [PMC free article] [PubMed] [Google Scholar]
- 32.Foster MC, Hwang SJ, Massaro JM, et al. Association of subcutaneous and visceral adiposity with albuminuria: the Framingham Heart Study. Obesity. 2011;19(6):1284–1289. doi: 10.1038/oby.2010.308. [DOI] [PMC free article] [PubMed] [Google Scholar]
- 33.Sharma K. The link between obesity and albuminuria: adiponectin and podocyte dysfunction. Kidney Int. 2009;76(2):145–148. doi: 10.1038/ki.2009.137. [DOI] [PubMed] [Google Scholar]
- 34.Thoenes M, Reil JC, Khan BV, et al. Abdominal obesity is associated with microalbuminuria and an elevated cardiovascular risk profile in patients with hypertension. Vascular Health & Risk Management. 2009;5(4):577–585. doi: 10.2147/vhrm.s5207. [DOI] [PMC free article] [PubMed] [Google Scholar]
- 35.Panwar B, Hanks LJ, Tanner RN, et al. Obesity, metabolic health, and risk of end-stage renal disease. Kidney international. 2014 Dec 17; doi: 10.1038/ki.2014.384. [Epub ahead of print] [DOI] [PMC free article] [PubMed] [Google Scholar]
- 36.Astor BC, Matsushita K, Gansevoort RT, et al. Lower estimated glomerular filtration rate and higher albuminuria are associated with mortality and end-stage renal disease. A collaborative meta-analysis of kidney disease population cohorts. Kidney Int. 2011;79(12):1331–1340. doi: 10.1038/ki.2010.550. [DOI] [PMC free article] [PubMed] [Google Scholar]
- 37.Chronic Kidney Disease Prognosis Consortium. Matsushita K, van der Velde M, et al. Association of estimated glomerular filtration rate and albuminuria with all-cause and cardiovascular mortality in general population cohorts: a collaborative meta-analysis. Lancet. 2010;375(9731):2073–2081. doi: 10.1016/S0140-6736(10)60674-5. [DOI] [PMC free article] [PubMed] [Google Scholar]
- 38.Franceschini N, Gouskova NA, Reiner AP, et al. Adiposity patterns and the risk for ESRD in postmenopausal women. Clin J Am Soc Nephrology. 2014 doi: 10.2215/CJN.02860314. [DOI] [PMC free article] [PubMed] [Google Scholar]
- 39.Sturm R, Hattori A. Morbid obesity rates continue to rise rapidly in the United States. Int J Obes. 2013;37(6):889–891. doi: 10.1038/ijo.2012.159. [DOI] [PMC free article] [PubMed] [Google Scholar]
- 40.Elsayed EF, Sarnak MJ, Tighiouart H, et al. Waist-to-hip ratio, body mass index, and subsequent kidney disease and death. Am J Kidney Dis. 2008;52(1):29–38. doi: 10.1053/j.ajkd.2008.02.363. [DOI] [PMC free article] [PubMed] [Google Scholar]