

Abstract
The current study examined the relation between infant sustained attention and infant EEG oscillations. Fifty-nine infants were tested at six (N=15), eight (N=17), ten (N=14), and twelve (N=13) months. Three attention phases, stimulus orienting, sustained attention, and attention termination, were defined based on infants’ heart rate changes. Frequency analysis using simultaneously recorded EEG focused on infant theta (2 – 6 Hz), alpha (6 – 9 Hz), and beta (9 – 14 Hz) rhythms. Cortical source analysis of EEG oscillations was conducted with realistic infant MRI models. Theta synchronization was found over fontal pole, temporal, and parietal electrodes during infant sustained attention for 10- and 12-months. Alpha desynchronization was found over frontal, central and parietal electrodes during sustained attention. This alpha effect started to emerge at 10 months and became well established by 12 months. No difference was found for the beta rhythm between different attention phases. The theta synchronization effect was localized to the orbital frontal, temporal pole, and ventral temporal areas. The alpha desynchronization effect was localized to the brain regions composing the default mode network including the posterior cingulate cortex and precuneus, medial prefrontal cortex, and inferior parietal gyrus. The alpha desynchronization effect also was localized to the pre- and post-central gyri. The present study demonstrates a connection between infant sustained attention and EEG oscillatory activities.
Keywords: infant sustained attention, theta and alpha oscillations, EEG source analysis
Infant sustained attention is characterized by a deceleration in heart rate (HR) and an increase in brain arousal and attention allocation capacity (Richards, 2008). Infant visual attention has been studied with measures of changes in the power spectral density (PSD or power) of EEG oscillations in different frequency bands. Researchers have found an increase in infant theta PSD during anticipatory attention (Orekhova, Stroganova, & Posikera, 1999) and attenuation in infant alpha PSD during attention to external stimulus (Orekhova, Stroganova, & Posikera, 2001). Infant EEG oscillations also have been studied as the neural correlates of infant cognitive processes, such as memory encoding (Bell, 2001, 2002) and motion perception and execution (Marshall, Young, & Meltzoff, 2011). Theta and alpha rhythmic activities are robust electrical indices of brain arousal and attention allocation in adulthood (Ergenoglu et al., 2004; Sauseng et al., 2005; Sauseng, Hoppe, Klimesch, Gerloff, & Hummel, 2007). A recent study by Thorpe, Cannon, and Fox (2016) localized the cortical sources of infant alpha rhythm during motion execution. However, the cortical sources of infant theta and alpha rhythms during visual attention remain unclear. Previous infant and adult literature both suggest a potential relation between infant sustained attention and infant theta and alpha oscillations. The current study examined this relation and demonstrated how it develops from six to twelve months of age. This study also examined the cortical sources of infant theta and alpha oscillatory activity during infant visual attention.
Infant EEG oscillations and infant attention
Two frequently studied infant EEG rhythms, theta and alpha rhythms, undergo substantial development during infancy. The frequency ranges used to define infant theta and alpha rhythms are approximately 2 to 6 Hz and 6 to 9 Hz respectively (Bell, 2002; Marshall et al., 2011; Orekhova et al., 1999, 2001). Marshall et al. (2002) reported a longitudinal study looking at the development of the PSD and the peak frequency for infant theta and alpha rhythms. There was a general decrease of the PSD in the theta band from 5 to 24 months and a concurrent increase of the PSD in the alpha band during this age (Marshall et al., 2002). Marshall and colleagues also found that infants did not show a clear pattern of alpha activity before 10 to 12 months of age. In contrast, infant theta activity emerged at younger ages.
Infant attention has been associated with infant theta oscillations. Orekhova and colleagues (1999) studied the relation between 8- to 11- month-old infants’ visual attention and their theta activity. Infants were tested under experimental conditions designed to elicit “external” and “anticipatory” attention. External attention was elicited when infants were watching an adult blowing soap bubble. Anticipatory attention was elicited when infants were waiting for an experimenter in the peek-a-boo game. Increase in the theta PSD was found when infants were anticipating a person compared to paying attention to an object or watching a “reappeared” person during the game. This effect was mainly shown in the frontal pole (AF3) and temporal (T6) electrodes. The authors referred this effect to “theta synchronization” and interpreted it as reflecting the distinct activity in the anterior attention system underlying the executive control of attention.
The experimental paradigm employed in Orekhova et al. (1999) has been used to study infant attention and alpha oscillations (Orekhova et al., 2001). Infants were observed to show an attenuation of the alpha PSD at the central and parietal electrodes during visual attention to an object. This pattern of alpha attenuation also was found when 8- to 11-month-old infants watching an adult blowing soap bubbles compared to being placed in total darkness (Stroganova et al., 1999). The attenuation of the alpha PSD was referred to “alpha desynchronization” in these studies. The authors suggested that this alpha desynchronization effect over posterior electrodes might be related to the inhibition effects in the parietal attention network. There was increased alpha PSD found in the frontal electrodes during visual attention to an object compared to being in total darkness. The inconsistence between the alpha activity in the frontal and posterior electrodes might suggest the frontal and posterior brain regions play different roles in these cognitive processes.
Infant EEG oscillations and other cognitive processes
Infant alpha rhythm has been studied as a neural correlate of infant high-level cognitive processes. For example, Bell and colleagues have studied the relation between infant alpha rhythmic activity and children’s performance in the A-Not-B task (e.g., Bell, 2001, 2002). A typical A-Not-B task requires infants to search for a hidden object in a familiar box or a new box, which relies on infants’ working memory and inhibitory control capacity. Bell and colleagues observed an increase of the alpha PSD predominately in the frontal electrodes when infants were engaged in working memory process compared to baseline (Bell, 2001, 2002; Bell & Wolfe, 2007). Alpha activity additionally discriminated infants correct and incorrect responses during the task (Bell, 2002). Bell (2002) also looked at infant beta (~ 10 – 13 Hz) rhythm, but no clear link was found between infant beta rhythm and memory encoding. Attenuation of the alpha PSD has been found during infants’ processing of ratio-dependent numbers. Libertus, Pruitt, Woldorff, and Brannon (2009) found that processing novel numbers was accompanied by an attenuation of the alpha PSD over parietal electrodes in 7-month-old infants. The authors argued that this effect was driven by the greater amount of attention allocated to novel numbers.
EEG oscillations in the frequency band of 6 to 9 Hz show distinct activation during infant motion observation and execution. This activity is referred to the infant mu rhythm. It is most prominent over central electrodes, although its activity can also be measured in the frontal and parietal electrodes (Marshall et al., 2011). Infant mu activity shares the same frequency range as infant alpha activity, but has a different functional role. Infant mu activity is elicited during motion observation and execution (Fox et al., 2016). Marshall and colleagues have consistently found attenuated PSD of infant mu rhythm during infants’ execution and observation of body acts (Marshall, Saby, & Meltzoff, 2013; Marshall et al., 2011; see Marshall & Meltzoff, 2011, for review). The changes in the event-related mu activity has been referred to the “event-related desynchronization” (ERD) in these studies. Infant mu ERD was thought to arise from the greater activation in the pre- and post-central gyri and was interpreted as reflecting the developmental origin of the mirror neuron system (Fox et al., 2016; Marshall & Meltzoff, 2011).
EEG oscillations and attention in adulthood
The relation between theta oscillations and sustained attention and attention allocation in adults has been well documented. A study by Sauseng and colleagues (2007) compared participants’ theta PSD between pressing buttons in novel sequences and memorized sequences. An increase of the theta PSD at frontal-midline electrodes has been found during execution of novel sequential finger movements compared to memorized movements and resting state. The increase of the theta PSD during task performance was argued as indicating the increased demands for sustained attention and attention allocation during working memory process (Gomarus, Althaus, Wijers, & Minderaa, 2006; Sauseng et al., 2007; see Klimesch, 1999, for review). This theta effect has been localized using EEG cortical source analysis to the anterior and posterior cingulate cortex including the cingulate motor area (Onton, Delorme, & Makeig, 2005; Sauseng et al., 2007).
Alpha attenuation is another robust neural index of attention allocation and increased brain arousal in adulthood. Thut, Niezel, Brandt, and Pascual-Leone (2006) examined participants’ alpha activity following an auditory cue that indicated the location of the presence of the target. An attenuation of the alpha PSD was found in the contralateral parieto-occipital electrodes following the cue and target presentation. This pattern of changes in the alpha PSD has been suggested as reflecting the top-down control of spatial attention (e.g., Sauseng et al., 2005; Worden, Foxe, Wang, & Simpson, 2000). The alpha attenuation effect might also suggest the releasing of the task-relevant areas from inhibition (Klimesch, Sauseng, & Hanslmayr, 2007; Rihs, Michel, & Thut, 2007). Attenuated alpha PSD also has been related to higher brain excitation and arousal. Ergenoglu et al. (2004) examined the effects of alpha oscillatory activity on the perception of near-threshold visual stimuli and on the ERPs elicited by these stimuli. It was found that pre-stimulus attenuation of the alpha PSD was accompanied by increased behavioral performance and higher amplitudes of ERPs.
Adult alpha oscillations are correlated to the activity in attention related brain networks. The EEG and fMRI signals were simultaneously recorded during resting wakefulness in a study by Mantini, Perrucci, Gratta, Romani, and Corbetta (2007). Positive correlations have been shown between the PSD of the alpha rhythm and the blood oxygen level-dependent (BOLD) signals in the default mode network (DMN). The DMN includes the medial prefrontal cortex, posterior cingulate cortex and precuneus, and the inferior parietal lobule (Raichle et al., 2001; Shulman et al., 1997). These brain regions of the DMN become distinctly active and correlated to each other during resting state (low arousal) but less active during sustained attention and task performance (high arousal; Raichle et al., 2001; Shulman et al., 1997). The finding by Mantini et al. (2007) suggested that the DMN and the alpha rhythm are related in adults. The more demanding the task the stronger the deactivation occurs in the DMN and in the alpha rhythm (Knyazev, Slobodskoj-Plusnin, Bocharov, & Pylkova, 2011). Positive correlations have been found between the alpha PSD and the BOLD signals in another attention related network, the cingulo-opercular (CO) network (Sadaghiani et al., 2010). The CO network becomes more active during tonic alertness before target onsets, i.e., when participants are prepared for responses to targets (Sadaghiani, Hesselmann, & Kleinschmidt, 2009).
Cortical generators of infant theta and alpha rhythms
A recent study by Thorpe and colleagues (2016) sheds light on the cortical sources of infants’ alpha and mu rhythm during motion action tasks. The EEG was recorded while 12-month-old infants were executing grasping and touching actions with a toy. Current density reconstruction (CDR) technique and age-appropriate average MRI templates (Richards, et al., 2016) were utilized to perform source analysis. The authors found distributed frontoparietal patterns of the cortical sources for infant mu and alpha rhythms. Precental, postcentral, and supramarginal gyri contained the majority of the source volumes of event-related mu and alpha desynchronization. This study employed a typical paradigm used to elicit infant mu activity and there were effects found in both central and posterior electrodes (Thorpe et al., 2016). It was difficult to distinguish the cortical sources for the alpha and the mu activities in the 6 – 9 Hz frequency band. Thus, there is a need for the study of the cortical sources of infant alpha activity during visual attention.
The neural generators of infant theta and alpha rhythms during visual attention are still unclear. To our knowledge, investigation of the cortical sources of infant theta rhythm has not been conducted. The only infant age tested in Thorpe et al. (2016) was 12-month-olds. Thus, the alpha sources found in Thorpe et al. (2016) need to be studied at different ages during infant visual attention.
Measurements and functions of infant sustained attention
Richards and colleagues have articulated a model of infant attention phases closely related to changes in HR during infant’s looking (Richards, 2008). This model posits that visual fixation consists of multiple attention phases: stimulus orienting, sustained attention, and attention termination (Colombo, 2002; Reynolds & Richards, 2008). Infant’s looking or stimulus orienting toward a stimulus in Richards’ model is similar to the “external attention” defined in the studies by Orekhova and colleagues (Orekhova et al., 1999, 2001). Infants’ attention to a stimulus and high-level cognitive functions measured by previous research (e.g., Bell, 2002; Libertus et al., 2009; Marshall et al., 2011; Stroganova et al., 1999) may involve the kind of visual engagement and stimulus processing occurred during infant sustained attention. Sustained attention is characterized by subject-initiated visual engagement, improved ability to allocate attention, and enhanced brain arousal (Reynolds & Romano, 2016). Thus, infant sustained attention might be accompanied by an increase in the theta PSD and an attenuation in the alpha PSD. Infant inattention is consistent with the attention phases, where infants disengage from the stimulus, information processing is limited, and infants are more likely to shift fixation elsewhere. Infant inattention might be associated with a decrease in the theta PSD and an increase in the alpha PSD compared to infant sustained attention. We propose that oscillatory properties in frequency bands that have been associated with infant attention and cognitive functions should be linked to attention phases defined by HR changes.
The neural correlates of infant sustained attention have been studied with event-related potentials (ERPs) measures. Infant sustained attention has been found to enhance infant ERPs components subserving different brain functional networks (Guy, Zieber, & Richards, 2016; Reynolds & Richards, 2005; Xie & Richards, 2016a, b). The changes in these ERP components provide evidence for the consequences of infant sustained attention effects on brain activity. Measuring EEG oscillatory properties in frequency rhythms should provide a way to understand the neural mechanisms underlying the effects of infant sustained attention.
Current Study
The primary goal of the current study was to examine the effect of infant sustained attention on EEG oscillations in infants from 6 to 12 months. Three attention phases, stimulus orienting, sustained attention, and attention termination, were defined based on infant HR recorded while the infants were watching Sesame Street clips (Richards, 2010; Xie & Richards, 2016a). Infant theta and alpha PSD were analyzed separately for the three different attention phases. Infants at 6, 8, 10, and 12 months of age were tested to cover a key period for the development of infant theta and alpha activities (Marshall et al., 2002). We expected infants would show increase of the theta PSD and attenuation of the alpha PSD during sustained attention based on previous infant and adult research. We also hypothesized that these effects would be more likely to be found in the older ages because of the relatively delayed development of infant theta and alpha rhythmic activity (Marshall et al., 2002) compared to the development of infant sustained attention (Richards, 2008). We also examined the infant beta rhythm whose functional significance has not been sufficiently identified in the literature (Cuevas, Cannon, Yoo, & Fox, 2014). However, we did not find significant effects of age or attention on infant beta activity, and thus report these findings in the Supplemental Information.
A second goal of the current study was to investigate the cortical sources of infant theta, alpha, and beta rhythms during different attention phases. Cortical source analysis of the scalp-level PSD was conducted for these frequency rhythms with the CDR technique and realistic head models obtained from the Neurodevelopmental MRI Database (Richards, Sanchez, Phillips-Meek, & Xie 2016; Richards & Xie, 2015; Xie & Richards, 2016b). An accurate MRI model that describes the materials inside the head and their relative conductivity is beneficial for source analysis of EEG and ERPs (Michel et al., 2004; Reynolds & Richards, 2009). The CDR amplitude was compared between different attention phases for each frequency band. Increase in the theta CDR amplitude and attenuation in the alpha CDR amplitude were hypothesized to occur in sustained attention over inattention.
The comparisons of the CDR amplitude were conducted for brain areas or networks made of brain regions of interest (ROIs) based on the existing literature described in previous sections. Hypothesized brain areas for infant theta effect included the frontal pole, temporal pole, and ventral temporal regions based on infant EEG findings on the scalp (Orekhova et al.,1999). Hypothesized sources for infant theta effect also included the cingulate cortex based on adult source analysis findings (Onton et al., 2005; Sauseng et al., 2007). Infant alpha effect was expected to show in the attention related brain networks based on adult literature (the DMN and CO networks; Knyzazev et al., 2011; Mantini et al., 2007; Sadaghiani et al., 2010) and in the pre- and post-central gyri based on infant source analysis findings (Thorpe et al., 2016).
Method
Participants
Sixty-eight participants were tested ranging in age from 6 to 12 months, and were categorized into four groups: 6 (N = 18, M = 184.4 days, SD = 15.51), 8 (N = 17, M = 239.4, SD = 15.02), 10 (N = 16, M = 289.3, SD = 14.53), or 12 (N = 17, M = 350.6, SD = 13.77) months of age. Participants were born full term with no known developmental anomalies. An additional nine participants were tested but data collection ended because the infants became fussy. Two participants did not finish the experiment due to equipment failure (e.g., programs crashed). Attrition rate was 13.92%. Data from nine participants who finished the experiment were excluded from analyses due to excessive artifacts (e.g., eye or body movements and noise). Thus, the final sample reported in the current study contained these numbers of participants for each group: 6 (N = 15), 8 (N = 17), 10 (N = 14), and 12 (N = 13) months.
Apparatus and Stimuli
A color monitor, two cameras, and computers were used for stimulus presentation and video recording. Participants were seated on their mothers’ laps 55cm away from a 29” LCD monitor in a darkened room. This LCD monitor was used for stimulus presentation. A camera was located above the monitor to record the participants’ face. A second camera was located behind the participants so that the presentation on the monitor was recorded. These video recordings were used for behavioral judging. Microsoft Visual C ++ programs were used for presentation and experimental control.
Stimuli used in the study included seven Sesame Street dancing and singing sequences made from the movie, “Sesame Street’s 25th Anniversary”. Stimuli also included seven moving and talking/singing Sesame Street characters (e.g., “Elmo”). Each scene only had one Sesame Street character at a time. The character in a scene might talk (or sing) at one location, disappear from the scene, move from one location to another on the screen, or disappear as it was moving across the screen. These characters were placed over a static background that was used to improve infant engagement. There were four backgrounds upon which the character was presented (Mallin & Richards, 2012). These Sesame Street videos and characters have been consistently used to elicit different attention phases during infants’ looking (e.g., Courage, Reynolds, & Richards, 2006; Mallin & Richards, 2012).
Procedure
One randomly selected Sesame Street movie sequence was presented at the beginning of each experimental block. When the infant was looking toward this movie, a randomly selected Sesame Street character was presented on either left or the right side of the monitor. The character stayed at that location talking for 8 – 12 s. The dancing character then moved to the other location and stayed there for 8 – 12 s, and then was moved to the original side for an additional 8 – 12 s. The character might also disappear, i.e., hide behind the scene for a few seconds. However, the data collected during the disappearance of the character was not used for the current analyses. A new character was then introduced with these procedures. This lasted until two min had elapsed, and then was repeated with a new Sesame Street movie and character sequences.
Judgment of Visual Fixation
Infant looking was judged based on review of the video recordings. A single experimenter determined if the infant was looking toward the video presentation. Looking away from the presentation was marked by the observer. Data was only used for further analyses when infants were looking toward the presentation.
ECG Recording and HR Defined Attention Phases
The ECG data was recorded with two Ag-AgCL electrodes placed on the infant’s chest. The R-R intervals were the latency between the R waves of two heartbeats. They were used to compute the inter-beat-intervals (IBIs). The IBI had an inverse association with HR, such that HR deceleration corresponded to lengthening of the IBI and HR acceleration corresponded to shortening of the IBI.
Attention phases were defined based on HR (IBI) changes during infants’ looking. The phase of stimulus orienting was defined as the period between the onset of a look and a significant HR deceleration. The criterion for a significant HR deceleration was five successive beats with IBIs longer than the median of five preceding IBIs. The phase of sustained attention was defined as the time when there was a significant deceleration of HR below the prestimulus level and the HR remained at the lowered level. The phase of attention termination was defined as a period that HR returned to the baseline level. The criterion for the return of HR to its prestimulus level was five consecutive IBIs shorter than the median of five prestimulus IBIs.
EEG Recording, Preprocessing, and Frequency Analysis
EEG was recorded simultaneously with the ECG recording. The Electrical Geodesics Incorporated (EGI, Eugene, OR) EEG system was used for the EEG recording. 34 participants’ data were recorded with the 128 channel “Geodesic Sensor Net” (GSN) and 25 participants’ data were recorded with the 128-channel “HydroCel Geodesic Sensor Net” (HGSN). The EEG was measured from 124 channels in the electrode net and two Ag-AgCl electrodes that were used to measure electrooculogram (EOG). The EEG was recorded with 20 K amplification at a 250 Hz sampling rate with band-pass filters set from 0.1 – 100 Hz and 100 kΩ. The EEG recording was referenced to the vertex, and then algebraically recomputed to an average reference.
The EEG recordings were preprocessed using the EEGLAB toolbox (Delorme & Makeig, 2004) in MATLAB (R2015b, the Mathworks, Inc.). Preprocessing included segmentation, inspection for artifacts, and channel interpolation. EEG data was segmented into 1s epochs. The EEG epochs were inspected for artifacts (ΔEEG > 200 μV or ΔEEG > 100 μV within 50 ms). Independent component analysis (ICA) was conducted additionally to correct eye movement artifacts (Supplemental Information for details). If there were fewer than 12 channels that were missing or had bad data channel interpolation was conducted using the five closest channels. Each attention phase had to have at least 10 clean trials for the data to be included for further analyses (DeBoer, Scott, & Nelson, 2007).
Frequency analysis was conducted to assess the power spectral density, PSD (i.e., power) for each frequency rhythms and for each attention phase with the Fieldtrip (FT; Oostenveld et al., 2011) toolbox. Fast Fourier Transform (FFT) was applied on EEG epochs with a 1s-width Hanning window and 50% overlap (i.e., Welch’s method, Welch, 1967). The PSD was calculated for theta (2 – 6 Hz), alpha (6 – 9 Hz), and beta (9 – 14 Hz) rhythms. The PSD obtained from frequency analysis was calculated for seven prespecified clusters, the Frontal Pole, Frontal, Central, Anterior Temporal, Posterior Temporal, Parietal, and Occipital-Inion. Each cluster was created as the average of a group of GSN or HGSN electrodes that were surrounding certain 10–10 electrode positions used in previous research (Table 1). The PSD from 0 to 20 Hz was additionally estimated to provide an overview of the changes in the PSD by frequency and allowed us to assess whether the presence of spectral peaks for alpha rhythm increases from 6 to 12 months of age (Marshall et al., 2002). The details about the frequency analysis are described in the Supplemental Information.
Table 1.
Channel clusters and corresponding 10 – 10 positions and GSN (HGSN) electrodes.
| Clusters | 10–10 Positions | GSN electrodes | HGSN electrodes |
|---|---|---|---|
| Frontal Pole | N1, AF9, F9, FP1 N2, AF10, F10, FP2, Nz, FPz | 1 2 3 8 9 10 14 15 16 17 18 19 22 23 24 26 27 33 34 39 116 121 122 125 126 | 1 2 3 8 9 10 14 15 16 17 18 21 22 23 25 26 32 33 38 121 122 125 126 |
| Frontal | F1, F3, F5, F2, F4, F6, Fz | 3 4 5 6 11 12 13 20 21 24 25 28 29 35 112 113 117 118 119 123 124 | 3 4 5 6 11 12 13 19 20 23 24 26 27 28 111 112 116 117 118 123 124 |
| Central | FC1, FC3, FC5, C1, C3, C5, FC2, FC4, FC6, C2, C4, C6, FCz, Cz | 6 7 13 21 28 29 30 31 32 35 36 37 38 41 42 43 47 48 55 81 88 94 99 103 104 105 106 107 110 111 112 113 117 118 119 123 | 6 7 13 20 27 28 29 30 31 34 35 36 37 40 41 42 46 55 80 87 93 102 103 104 105 106 109 110 111 112 116 117 118 123 |
| Anterior Temporal | FP7, FP8, FP9, FP10, T7, T8, T9, T10 | 1 33 34 35 39 40 41 44 45 46 47 49 103 109 110 114 115 116 117 120 121 122 | 1 32 33 34 38 39 40 43 44 45 48 49 108 109 113 114 115 116 119 120 121 122 |
| Posterior Temporal | TP7, TP8, TP9, TP10, P7, P8, P9, P10 | 45 46 47 49 50 51 52 56 57 58 59 64 65 92 93 96 97 98 99 100 101 102 103 108 109 114 | 39 40 44 45 46 49 50 51 56 57 58 59 64 91 95 96 97 99 100 101 102 107 108 109 113 114 115 |
| Parietal | P1, P3, P5, P2, P4, P6, Pz | 43 48 51 52 53 54 59 60 61 62 68 79 80 86 87 92 93 94 98 99 | 47 51 52 53 54 59 60 61 62 67 77 78 79 85 86 91 92 97 98 |
| Occipital-Inion | PO3, O1, I1, PO4, O2, I2, POz, Oz, Iz | 60 61 65 66 67 68 70 71 72 73 75 76 77 78 79 83 84 85 86 89 90 91 | 60 62 65 66 67 69 70 71 72 74 75 76 77 82 83 84 85 89 90 91 |
Cortical Source analysis
The cortical source analysis of the PSD for frequency bands was conducted with the FT toolbox. The steps of source analysis are selection of anatomical MRI, construction of realistic head models, distributed source reconstruction, and segmenting source activity in the whole brain into ROIs. Details about each step are described in the Supplemental Information and in Xie and Richards (2016b).
An anatomical MRI close in head size and age was selected for each infant from the Neurodevelopmental MRI Database (Richards et al., 2016; Richards & Xie, 2015) to create the realistic head models. MRIs were segmented into component materials and the gray matter and eyes were used as source volumes. A finite element method (FEM) model with 2 mm spatial resolution was created. A forward model was created for each MRI with the FEM model, source volumes, and an electrode placement map (Richards, Boswell, Stevens, & Vendemia, 2015). The forward model was then used to estimate the lead field matrix and the spatial filter matrix (inverse of the lead field matrix).
Cortical source analysis was conducted using the current density reconstruction (CDR) technique with the head models, lead field matrix, and the spatial filter matrix. Distributed source reconstruction of the PSD for each frequency band was conducted with exact-LORETA (eLORETA; Pascual-Marqui, et al., 2011) as the constraint. This process resulted in a CDR amplitude in μA/mm3 for each source voxel.
Anatomical brain MRIs were segmented into ROIs using the LONI Probabilistic Brain Atlas (LPBA; Shattuck et al., 2008), the Hammers Brain Atlas (Hammers et al., 2003), and the Harvard-Oxford Atlas included in FSL (Smith et al., 2004). Five brain areas were defined using groups of ROIs for the comparison of cortical activation of the theta rhythm between attention phases and ages. They included the orbital frontal lobe, temporal pole, ventral temporal area, dorsal anterior cingulate gyrus, and the posterior cingulate gyrus. Three brain areas were defined for the source analysis of the alpha rhythm. They included the pre- and post-central gyri, the DMN, and the CO network. Details about the construction of these ROIs were provided in Table 2 and 3 and the Supplemental Information document.
Table 2.
Brain networks used for the cortical source analysis of the theta rhythm and brain ROIs used to compose the networks from the LPBA (Shattuck et al., 2008), Hammers (Hammers et al., 2003), and Harvard-Oxford (Smith et al., 2004) atlases.
| Brain Networks | ROIs |
|---|---|
| Orbital Frontal Lobe | Hammers: Anterior, lateral, medial, and posterior orbital gyri, Rectus (Straight) gyrus |
| Temporal Pole | Hammers: Anterior part of the superior temporal gyrus, Medial and lateral part of the anterior temporal lobe |
| Ventral Temporal Area1 | LPBA: Fusiform and Inferior temporal gyri Hammers: Fusiform and inferior temporal gyri |
| Dorsal Anterior Cingulate Gyrus2 | LPBA: cingulate gyrus Hammers: anterior cingulate gyrus Harvard-Oxford: anterior cingulate and paracingulate gyri |
| Posterior Cingulate Gyrus | Hammers: Posterior Cingulate Cortex |
Notes:
The ventral temporal area was generated ad hoc after a post-hoc examining the Age X Attention effects and 3D rendered data (Figure 5) on the areas near the ventral temporal areas.
The dorsal anterior cingulate cortex contains the anterior cingulate gyrus (Hammers), cingulate gyrus (LPBA), and the paracingulate and anterior cinglulate gyri (Harvard-Oxford). All of these areas were masked to be superior and anterior to the anterior commissure.
Table 3.
Brain networks used for the cortical source analysis of the alpha rhythm and brain ROIs used to compose the networks from the LPBA (Shattuck et al., 2008), Hammers (Hammers et al., 2003), and Harvard-Oxford (Smith et al., 2004) atlases.
| Brain Networks | ROIs |
|---|---|
| Pre- and Post-Central Gyri (Sensorimotor) | LPBA: Precentral and Postcentral gyri |
| DMN | LPBA: Precuneus, Inferior Parietal Cortex (Angular and Supramarginal gyri) Hammers: Posterior Cingulate Cortex Constructed: Medial Prefrontal Cortex1 |
| Cingulo-opercular2 | Hammers: Insular Constructed: Dorsal Anterior Cingulate Cortex3 |
Note:
The medial prefrontal cortex consists of the ventral and dorsal medial prefrontal cortex. The ventral medial prefrontal cortex incorporates the straight/rectus gyrus (Hammers and LPBA), medial orbital gyus (Hammers), middle orbitalfrontal gyrus (LPBA), and the medial frontal cortex (Havard-Oxford). The dorsal medial prefrontal cortex incorporates the medial part of the frontal pole (Harvard-Oxford) that is anterior and superior to f the genu of corpus callosum.
The CO network also includes the thalamus. However, it may be inappropriate to use EEG cortical source analysis to measure its activity. So, the thalamus is excluded from the analysis.
The dorsal anterior cingulate cortex contains the anterior cingulate gyrus (Hammers), cingulate gyrus (LPBA), and the paracingulate and anterior cinglulate gyri (Harvard-Oxford). All of these areas were masked to be superior and anterior to the anterior commissure.
Design for Statistical Analysis
Statistical analysis was conducted with mixed-design ANOVAs that were performed using the Proc GLM function in the SAS software (SAS institute Inc, Cary, NC). The PSD of each frequency band was analyzed as the dependent variable for scalp-level power spectrum analysis. The independent variables included attention phase (3: stimulus orienting, sustained attention, and attention termination) and channel cluster (7: Frontal Pole, Frontal, Central, Anterior Temporal, Posterior Temporal, Parietal, and Occipital-Inion) as within-subject factors, and age (4: 6, 8, 10, and 12 months) as a between-subject factor. The Mauchly’s sphericity test was conducted before the univariate analyses to test the sphericity assumption. Post hoc tests (e.g., multiple comparisons) following main effects were Scheffé corrected. All significant tests were reported at p < 0.05.
The average CDR amplitude for each brain area or network was analyzed as the dependent variable for cortical source analysis. Independent variables included attention phase and age. Statistical analyses for source activation (i.e., CDR amplitude) selectively focused on the factors that showed significant results in the scalp-level power spectrum analysis. This ROI-based analysis of cortical source activation has been used in previous infant source analysis research (Guy et al., 2016; Xie & Richards, 2016b). This type of parametric analysis is preferred over clusterwise inferences for controlling the family-wise error (FWE) rate because no smoothing and spatial correction were conducted and fewer comparisons were performed (Eklund, Nichols, & Knutsson, 2016).
Results
The final number of accepted trials in the spectral analyses varied across the three attention conditions. More trials were obtained for sustained attention (M = 174.49, 95% CI [140.15 196.26]) than stimulus orienting (M = 85.62, 95% CI [72.40 98.84]) and attention termination (M = 66.16, 95% CI [44.99 87.33]). All three conditions ended up with sufficient number of clean trials that was greater than the recommended number of trials in infant EEG/ERP literature (DeBoer et al, 2007). Thus, the difference between the number of trials for each attention phase was not expected to contribute to the effects described below.
The overview of the PSD from 0 to 20 Hz in the seven channel clusters is illustrated in Figure 1. Figure 1A was made from the data from subjects (N = 25) that showed a peak for their alpha rhythm in at least one channel cluster. There were one (6.67%) subject at 6 months, seven subjects (41.18%) at 8 months, nine subjects (64.29%) at 10 months, and eight (66.67%) subjects at 12 months showing a peak for alpha. Figure 1B was made of the data from the subjects (N = 34) showing no alpha peak. These figures show that the PSD for theta band was largest in the Frontal Pole, Occipital-Inion, and Temporal clusters and smallest in the Central and Frontal Clusters. Subjects showed a clear peak within the theta frequency band. Alpha power showed a different scalp distribution, especially for those subjects with a peak. It was largest in the Occipital-Inion cluster and smallest in the Anterior Temporal cluster. Figure 1A also showed that the alpha peak was primarily found in the Frontal, Central, and Parietal clusters. Infant beta rhythm did not show a peak and was largest in the Frontal Pole cluster.
Figure 1.
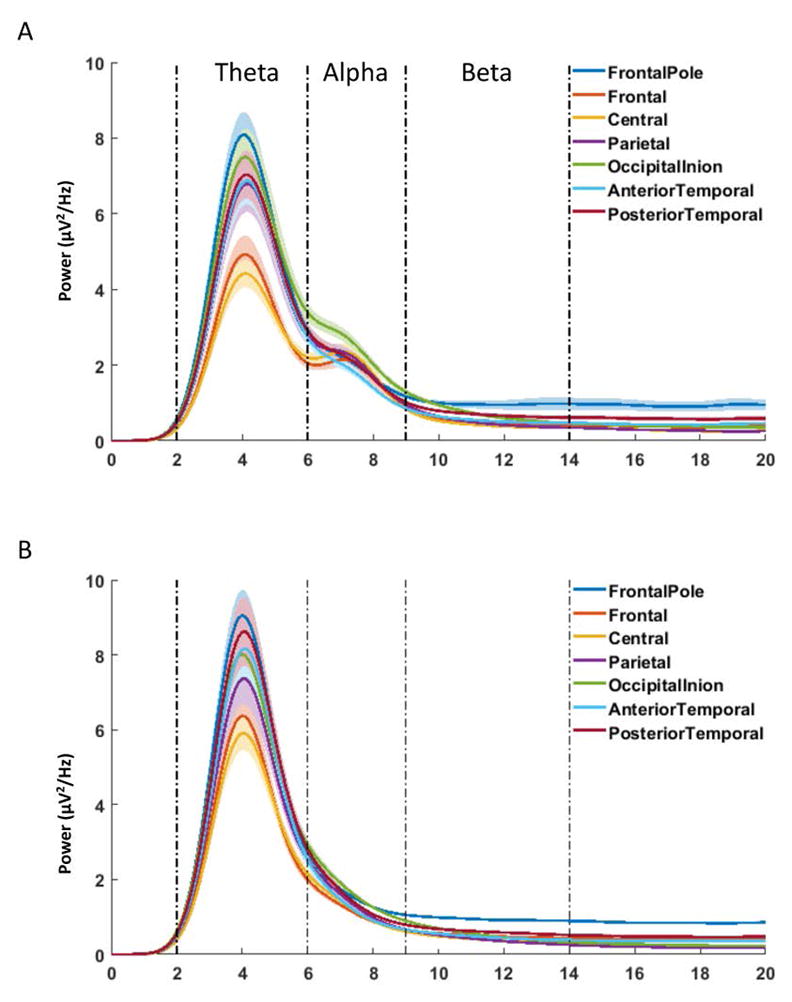
Power spectral density (PSD) by frequency from 0 to 20 Hz, separately for the seven channel clusters. Semi-transparent shades indicate the standard error of means (SEMs). A. PSD by frequency using data from subjects (N = 25) that showed a peak for their alpha rhythm in at least one channel cluster. B. PSD by frequency using the data from the rest of the subjects (N = 34) showing no alpha peak. Infant theta, alpha, and beta frequency bands show different scalp distribution of the PSD, especially among the participants showing an alpha peak.
Theta Power Spectrum Analysis Results
An analysis was conducted to determine the effects of attention phase, channel cluster, and age on infant theta activity. The Mauchly’s sphericity test showed that the assumption of sphericity was not violated for the factor of the attention phase, chi-square = 2.62, p = 0.269. Thus, the theta PSD was analyzed as a function of these three factors with a mixed-design ANOVA. This analysis revealed an interaction of attention phase and age, F (6, 94) = 2.81, p = 0.0148. Follow-up analyses showed that the age effect, i.e., increase of theta power with age, occurred only during sustained attention, F (3, 376) = 15.03, p < 0.0001. Figure 2A illustrates the topographical distribution for the theta PSD during the three attention phases for all four ages. It shows that the theta PSD became more prominent with age, especially for sustained attention. Theta activity was primarily shown in the frontal pole, temporal, and occipital regions.
Figure 2.


Illustration of infant theta activity on the scalp during different attention phases across ages. A. Topographical maps for the distribution of the theta PSD separately during the three attention phases for all four age groups. Participants at 8, 10 and 12 months showed greater theta PSD in the frontal, temporal, and parietal regions. Also, there was an increase in the PSD compared to the two younger ages, especially for sustained attention. B. Bar graphs for the theta PSD in the Frontal Pole, Anterior Temporal, Posterior Temporal, and the Parietal clusters across ages as a function of attention phases: stimulus orienting (SO; black), sustained attention (SA; white), attention termination (AT; gray). *P < 0.05.
There was also a significant interaction of attention phase and channel cluster on the theta PSD, F (12, 564) = 2.29, p = 0.0076, and a three-way interaction between attention phase, channel cluster, and age, F (36, 564) = 2.50, p < 0.001. Post hoc tests with Scheffé adjustment showed that greater theta PSD was found in the Frontal Pole, Anterior Temporal, Posterior Temporal, and Parietal clusters compared to the theta PSD in the Frontal and Central clusters. The 10-month-olds had greater theta PSD during sustained attention than stimulus orienting and attention termination in the Frontal Pole and Parietal clusters, as well as greater PSD during sustained attention than stimulus orienting in the Anterior and Posterior clusters. Infants at 12-months showed greater theta PSD for both sustained attention and stimulus orienting than attention termination in the Frontal Pole, Anterior Temporal, and Posterior Temporal clusters, as well as greater PSD for sustained attention than attention termination in the Parietal cluster. These effects were not shown in the other clusters nor the other ages. Figure 2B illustrates the changes of the theta PSD in the four channel clusters as a function of attention phase, separately for the four age groups. The theta PSD started to show a pattern of increase of the PSD during sustained attention at 8 months and the effect reached the significance level for 10 and 12 months.
Alpha Power Spectrum Analysis Results
An analysis was conducted to determine the effects of attention phase, channel cluster, and age on infant alpha activity. The Mauchly’s sphericity test showed that the assumption of sphericity was not violated for the factor of the attention phase, chi-square = 0.648, p = 0.723. The alpha PSD was analyzed as a function of these three factors with a mixed-design ANOVA. The analysis revealed a main effect of age, F (3, 55) = 3.12, p = 0.0331. Follow-up comparisons showed that the alpha PSD for the two older ages was greater than that for the two younger ages. Figure 3A depicts the topographical distribution of infant alpha PSD during the three attention phases across ages. It shows the increase of the alpha PSD with age. Infant alpha activity was primarily shown in the central, parietal, and occipital regions, which differs with the topographical distribution of infant theta rhythm (cf. Figure 2A and 3A).
Figure 3.


Illustration of infant alpha activity on the scalp during different attention phases across ages. A. Topographical maps for the distribution of the alpha PSD during the three attention phases for the four age groups. Attenuated alpha PSD during sustained attention can be seen in the frontal, central, and parietal regions for 12 months and in the central region for 10 months. There was an increase of the alpha PSD with age. B. Bar graphs for the alpha PSD in the Frontal, Central, Parietal, and the Occipital-Inion clusters across ages as a function of attention phases: stimulus orienting (SO; black), sustained attention (SA; white), attention termination (AT; gray). The sustained attention effect was shown in the Frontal, Central, and the Parietal clusters. The alpha PSD is most prominent in the Occipital-Inion cluster. (*) P < 0.07, *P < 0.05.
The mixed-design ANOVA on the alpha PSD also revealed a significant interaction between attention phase, age, and channel cluster, F (36, 564) = 2.04, p = 0.004. This three-way interaction was driven by the significant interaction of attention phase and age in the Frontal (p = 0.0416), Central (p = 0.0443), and Parietal (p = 0.0301) clusters. Post hoc comparisons showed that the 10-month-old showed smaller alpha PSD during sustained attention than attention termination in the Central cluster. The 12-month-olds showed smaller alpha PSD during sustained attention than stimulus orienting and attention termination in the Frontal and Central clusters, as well as smaller alpha PSD during sustained attention than attention termination in the Parietal cluster. No significant result involving the attention effect was found for the two younger ages. Figure 3B includes bar graphs for the alpha PSD in the Frontal, Central, Parietal, and Occipital-Inion clusters as a function of age and attention phase. The figure shows that infant alpha PSD increased with age. The sustained attention effect started to emerge at 10 months and became well established at 12 months. There was no attention effect shown in the Occipital-Inion cluster; however, the alpha PSD was more prominent in this cluster than the other three clusters.
Cortical source analysis section
Statistical analyses on cortical source activation (i.e., CDR amplitude) focused on the effects shown in the scalp-level power analysis. No effect involving attention phase was found for the two younger ages in the PSD analyses, and thus only the data for 10 and 12 months were included in the statistical analyses of CDR amplitude.
Theta source analysis results
Statistical analyses were performed to determine the effects of attention phase and age on the CDR amplitude for theta rhythm in the orbital frontal lobe, ventral temporal area, temporal pole, dorsal anterior cingulate gyrus, and the posterior cingulate gyrus. The CDR amplitude was analyzed as a function of the two factors in mixed-design ANOVAs. A main effect of attention phase was found in the orbital frontal lobe, F (2, 42) = 3.29, p = 0.047. No interaction was found between age and attention phase, and thus the two ages were combined in the post hoc comparisons. The CDR amplitude in the orbital frontal lobe was greater during sustained attention than stimulus orienting and attention termination. There also was a main effect of attention phase found in the ventral temporal area, F (2, 42) = 3.78, p = 0.031, and in the temporal pole, F (2, 42) = 3.21, p = 0.05. Greater CDR amplitude was found during sustained attention than the other two attention phases in these regions. No significant effect of sustained attention was found in the dorsal anterior cingulate gyrus or the posterior cingulate gyrus.
These effects of sustained attention on theta source activation are illustrated in Figure 4. The 3D images in Figure 4A display the difference in the CDR amplitude between sustained attention and attention termination in age-appropriate average MRI templates. Data from 6 and 8 months were included for comparison. The sustained attention effect started to emerge at 8 months and was clearly shown at 10- and 12-months in the temporal pole, orbital frontal lobe, and ventral temporal regions. Bar graphs in Figure 4B display the average CDR amplitudes in these three brain areas for the 10- and 12-months groups. Both ages showed the greater CDR amplitude for sustained attention.
Figure 4.

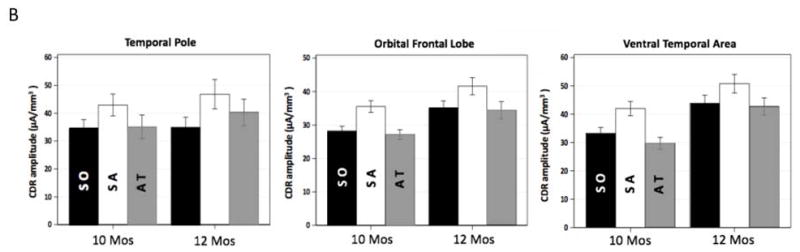
Development of the effect of sustained attention on infant theta source activation. A. 3D displays for the difference in CDR amplitude between sustained attention and attention termination separately for the four ages. Age-appropriate average MRI templates were used for the display for each age. Sustained attention effect was primarily shown in the temporal pole, orbital frontal, and ventral temporal regions, especially for 10 and 12 months. B. Bar graphs for the average CDR amplitudes in these brain networks for 10 and 12 months. Error bars represent SEMs.
Alpha rhythm source analysis results
Statistical analyses were performed to determine the effects of attention phase and age on alpha source activation in the pre- and post-central gyri, the DMN and the CO networks. The average CDR amplitude in these regions was analyzed as a function of the two factors. A marginal interaction of attention phase and age was found in the pre- and post-central gyri, F (2, 42) = 3.07, p = 0.053, and the DMN, F (2, 42) = 3.40, p = 0.0424. Follow-up analyses showed a main effect of attention phase for 12 months but not for 10 months in the pre- and post-central gyri, F (1, 12) = 6.17, p = 0.0078, and the DMN, F (1, 12) = 3.74, p = 0.0408. Post hoc comparisons showed that the CDR amplitude in the pre- and post-central gyri was lower during sustained attention than stimulus orienting and attention termination. The CDR amplitude in the DMN was lower during sustained attention than attention termination. The effect of attention phase did not reach the significance level for the CO network.
These sustained attention effects on alpha source activation are illustrated in Figure 5. The 3D images in Figure 5A display the difference in the CDR amplitude between sustained attention and attention termination. The sustained attention effect was primarily shown at 12 months in the components of the DMN (i.e., inferior parietal gyus, medial PFC, PCC and precuneus) and in the pre- and post-central gyri. Bar graphs in Figure 5B show that attenuated activity in cortical sources during sustained attention was found for the DMN and the pre- and post-central gyri.
Figure 5.

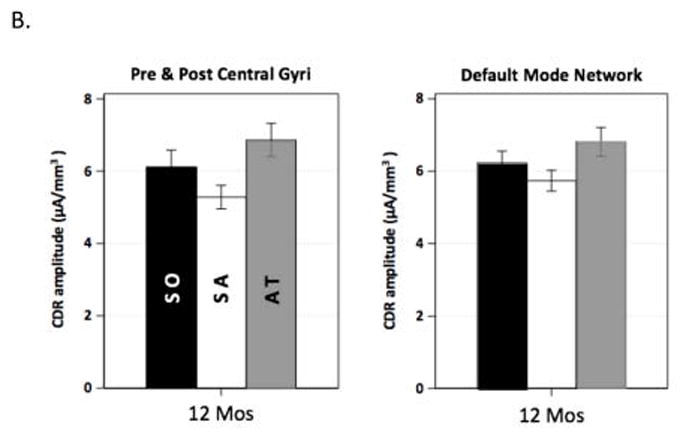
Development of the effect of sustained attention on infant alpha source activation. A. 3D displays for the difference in CDR amplitude between sustained attention and attention termination separately for the four ages. Sustained attention effect was most prominent for the 12 months in the inferior parietal gyrus, medial PFC, PCC and precuneus, and the pre and post central gyri. B. Bar graphs for the average CDR amplitudes in the two brain networks for 12 months. The default mode network includes the ROIs of the inferior parietal gyrus, medial PFC, and PCC and precuneus.
Discussion
The present study investigated the relation between infant sustained attention and infant EEG oscillatory activities and how this relation develops in the second half of the first year. Our primary goal was to examine the effect of infant sustained attention on infant theta, alpha, and beta band PSD. We hypothesized that infant would show amplification of the theta PSD and attenuation of the alpha PSD during sustained attention and these effects would increase with age. Our results supported these hypotheses. Increase of the theta PSD during sustained attention was clearly shown from 10 months. Attenuation of the alpha PSD during sustained attention started to emerge at 10 months and became well established at 12 months. Infants theta, alpha, and beta rhythms were found to show different distributions on the scalp. No effect involving attention phase or age was found for the beta rhythm.
Our second goal was to determine the cortical sources of the theta and alpha effects found on the scalp. We found that the increase of the theta PSD during sustained attention was primarily localized to the orbitofrontal lobe, temporal pole, and ventral temporal lobe. The attenuation of the alpha PSD during sustained attention was predominantly found in the pre- and post-central gyri and in the components of the DMN.
The relation of theta synchronization to infant sustained attention
Increased infant theta PSD during sustained attention might reflect the function of the anterior attention system and the development of attention control. Our finding of the increase of the theta PSD during sustained attention is consistent with the finding of the distinct pattern of infant theta activity during anticipatory attention in a peek-a-boo game (Orekhova et al., 1999). Both of the studies found the increase of the theta PSD in the frontal pole and temporal electrodes. Oreknova et al. (1999) interpreted this change as the theta synchronization effect that reflected the effect of the anterior attention system on executive control of attention. Our current finding supports this interpretation given that infant sustained attention is accompanied by enhanced voluntary control of attention (Colombo, 2001; Reynolds & Romano, 2016). The present finding also is consistent with the correlation of adult theta oscillations to attention allocation. The increase of the theta PSD in adulthood is accompanied by the increased demands for allocation of attention during highly selective cognitive processes, such as working memory (Gomarus et al., 2006; Sauseng et al., 2007). The current study suggests the developmental origin of this relation might emerge from 10 months of age.
The relation between increased infant theta PSD and infant sustained attention is well established by 10 months of age. Infants started to show a pattern of increased theta PSD during sustained attention at 8 months and this effect became well established from 10 months of age (Figure 2). Our finding of the early emergence of the theta synchronization effect is consistent with the findings from previous infant research (Orekhova et al., 1999; Marshall et al., 2002). Compared to the more delayed development of infant alpha rhythm, infant theta rhythm may be a more reliable neural index of infant cognitive processes in the first few months of life.
The increased theta PSD during sustained attention is likely to be generated by the orbital frontal, temporal pole, and ventral temporal regions. The localization of the theta effect into these regions is consistent with the topographical maps of infant theta activity shown on the scalp (Figure 2). This pattern of theta source activation is consistent with the finding by Orekhova et al. (1999) that infant theta synchronization was mainly shown at frontal pole (AF3) and posterior temporal (T6) sites.
The source localization of infant theta effect does not replicate the findings in adulthood. The increase of the theta PSD in frontal-midline electrodes during working memory and sustained attention has been localized to the anterior, medial and posterior cingulate gyri (Onton et al., 2005; Sauseng et al., 2007). These regions did not show a distinct pattern for the theta effect during sustained attention in the current study. This inconsistency suggests the infant theta rhythm plays a different role in cognitive processes than the adult theta rhythm. An alternative explanation is that infant theta rhythm undergoes substantial changes during its development in infancy. Infant theta rhythm may not show the same pattern of source distribution as what has been found in adulthood until later in life. This is the first study that examines the cortical sources of infant theta oscillations. Future investigation on the source localization of infant theta rhythm and its relation to high-level cognitive processes could clarify the emerging cortical sources of the theta, and attention-based theta synchronization.
The relation of alpha rhythm and infant sustained attention
The current findings on infant alpha rhythm establish a connection between attenuated alpha PSD and infant sustained attention. The attenuation of the alpha PSD found in the frontal, central and posterior electrodes during sustained attention is consistent with the alpha attenuation found during infant visual attention to external stimulus (Orekhova et al., 2001; Stroganova et al., 1999). This attenuated alpha PSD during sustained attention might reflect the releasing of the task-relevant areas from inhibition (Klimesch et al., 2007; Orekhova et al., 2001). This inhibition mechanism provides an alternative explanation for the improved behavioral performance and heightened brain activation (e.g., ERPs) during sustained attention (Marllin & Richards, 2012; Richards, 1997, 2003; Xie & Richards, 2016a, b). In other words, the effects of sustained attention on information processing may result from the inhibition of task-irrelevant areas in addition to the increased brain arousal and attention allocation.
The effects of sustained attention on infant alpha oscillations develop dramatically from 6 to 12 months of age. There was an increment of infant alpha PSD from 6 to 12 months. The effect of sustained attention on infant alpha activation started to emerge at 10 months and became well established by 12 months. This interaction between the effect of sustained attention and age might due to the dramatic changes in the development of infant alpha rhythm. Evidence for this interpretation arises from a longitudinal study showing that infant did not show a clear pattern of alpha rhythm before 10 to 12 months of age (Marshall et al., 2002). The finding by Marshall and colleagues is consistent with our finding that few infants at 6 months showed an alpha peak and only approximately 40% of the infants at 8 months showed an alpha peak. There is evidence for the emergence of sustained attention effect at 3 to 6 months of age (Colombo, 2001; Richards, 2008). Sustained attention continues to develop during the first year (Richards, 2010). Therefore, it is plausible that the interaction between sustained attention and age resulted from the intertwined development of infant alpha oscillations and infant sustained attention.
The relation between infant alpha oscillations and sustained attention is comparable to the relation of infant alpha oscillations to high-level cognitive processes. Attenuation of the infant alpha PSD has been found during motion perception and execution (mu rhythm; Fox et al, 2016; Marshall et al., 2011) and mathematic processing (Libertus et al., 2009). These findings confirm that infant sustained attention plays an important role in information processing (Colombo, 2001). In contrast, increase of the infant alpha PSD has been found during anticipation of an experimenter in a peek-a-boo game (Orekhova et al., 2001) and during working memory encoding, especially in the frontal electrodes (Bell, 2001, 2002; Bell & Wolfe, 2007). Infants were engaged in different tasks in these studies. Thus, the inconsistency between these findings suggests that infant alpha oscillations in different scalp areas have different functional significance between tasks.
The present finding of the attenuated alpha PSD during sustained attention is analogous to the existing adult literature. Attenuated alpha activity in adults has been correlated to spatial attention allocation (Sauseng et al., 2005; Thut et al., 2006; Worden et al., 2000) and increased brain excitation (Ergenoglu et al., 2004). Infant sustained attention is characterized by increased brain arousal and attention allocation (Richards, 2008, 2010). The current study demonstrates the developmental origin of the relation between alpha oscillations and attention allocation and brain arousal. Infant alpha rhythm may serve as a neural index in the future study of infant visual attention, especially for infants older than 10 months of age.
Cortical source analysis of infant alpha activity sheds light on the potential role that the DMN plays in infant sustained attention. Infant alpha effect during sustained attention was localized to the brain regions that are components of the DMN, including the PCC/precuneus, medial PFC, and inferior parietal gyrus (Table 3). Positive correlation has been found between the activity in the DMN and the alpha PSD in adults (Mantini et al., 2007). The current finding from the source analysis indicates the early emergence of this correlation by 12 months of age. The current study provides evidence for the neural origin of the function of the DMN in infancy. Enhanced brain arousal and attention allocation during infant sustained attention might be accompanied by attenuated activity in the DMN regions. The finding of the function of the DMN at 12 months is also in line with previous fMRI research with sleeping infants (Gao et al., 2009, 2011). Gao and colleagues found that a primitive and incomplete DMN was present in 2-week-olds. This early emergence of the DMN was followed by a marked increase in the number of brain regions in the DMN that exhibited functional connectivity at 12 months of age.
Another attention related network, the CO network, did not show distinct cortical source activation during infant sustained attention. The CO network becomes more active during tonic alertness before target onsets (Sadaghiani et al., 2009, 2010). The current experimental design did not involve a particular target event. This might cause the absence of distinct source activation in the CO network. An alternative explanation is that the connections between the frontal brain areas and the thalamus in the CO network have not fully developed in the first few months of life. Unfortunately, a major component of the CO network, the thalamus, cannot be adequately measured with cortical source analysis.
The finding of the infant alpha attenuation effect being localized to the pre- and post-central gyri substantially matches the finding by Thorpe et al. (2016). In that study, infant mu rhythm during motion execution was localized to the same areas using similar source analysis methods (cf., Nyström, 2008). The Sesame Street video clips used in the current study contained dancing and moving characters. Motion perception was likely to occur during the processing of these video presentations. It is plausible that infant motion perception was enhanced during sustained attention. However, it should be noted that the paradigm used in the current study is quite different than those used to study infant motion perception and execution with human models (e.g., Marshall et al., 2011; Thorpe et al., 2016). Future research should be conducted to investigate the functional significance of the sensorimotor area in infant sustained attention.
Supplementary Material
Highlights.
This study established a connection between infant sustained attention and infant EEG oscillatory activities. Increase of the theta power spectral density (PSD) and attenuation of the alpha PSD were found during infant sustained attention.
This study demonstrated how this relation between infant sustained attention and EEG oscillations developed from 6 to 12 months of life. Infants started to show the pattern of the theta effect during sustained attention at 8 months and the theta effect was significantly found at 10 and 12 months. Infant alpha effect during sustained attention started to emerge at 10 months and became well established at 12 months.
This study examined the cortical sources of infant theta and alpha rhythms. Infant theta effect during attention was localized to the orbital frontal lobe, temporal pole, and ventral temporal regions. Infant alpha effect was localized to the brain regions composing the default mode network (i.e., medial prefrontal cortex, posterior cingulate cortex, and inferior parietal gyrus) and the pre- and post-central gyri.
Acknowledgments
This work was supported by the following grants: the NIH grant, #R37 HD18942, to JER.
Footnotes
Conflicts of Interests
The authors have approved the manuscript and agreed with its submission. These authors declare no conflict of interest.
References
- Bell MA. Brain Electrical Activity Associated With Cognitive Processing During a Looking Version of the A-Not-B Task. Infancy. 2001;2(3):311–330. doi: 10.1207/S15327078IN0203_2. [DOI] [PubMed] [Google Scholar]
- Bell MA. Power changes in infant EEG frequency bands during a spatial working memory task. Psychophysiology. 2002;39(4):450–458. doi: 10.1017.S0048577201393174. doi:10.1017.S0048577201393174. [DOI] [PubMed] [Google Scholar]
- Bell MA, Wolfe CD. Changes in brain functioning from infancy to early childhood: Evidence from EEG power and coherence during working memory tasks. Developmental Neuropsychology. 2007;31(1):21–38. doi: 10.1207/S15326942dn3101_2. [DOI] [PubMed] [Google Scholar]
- Colombo J. The development of visual attention in infancy. Annual Review of Psychology. 2001;52:337–367. doi: 10.1146/annurev.psych.52.1.337. [DOI] [PubMed] [Google Scholar]
- Colombo J. Infant attention grows up: The emergence of a developmental cognitive neuroscience perspective. Curr Dir Psychol Sci. 2002;11(6):196–200. doi: 10.1111/1467-8721.00199. [DOI] [Google Scholar]
- Courage ML, Reynolds GD, Richards JE. Infants’ attention to patterned stimuli: Developmental change from 3 to 12 months of age. Child Dev. 2006;77(3):680–695. doi: 10.1111/j.1467-8624.2006.00897.x. [DOI] [PMC free article] [PubMed] [Google Scholar]
- Cuevas K, Cannon EN, Yoo K, Fox NA. The Infant EEG Mu Rhythm: Methodological Considerations and Best Practices. Developmental Review. 2014;34(1):26–43. doi: 10.1016/j.dr.2013.12.001. [DOI] [PMC free article] [PubMed] [Google Scholar]
- Deboer T, Scott LS, Nelson CA. Methods for acquiring and analysing infant event-related potentials. In: De Haan M, editor. Infant EEG and Event-related Potentials. London: Psychology Press; 2007. pp. 5–37. [Google Scholar]
- Delorme A, Makeig S. EEGLAB: an open source toolbox for analysis of single-trial EEG dynamics including independent component analysis. Journal of Neuroscience Methods. 2004;134(1):9–21. doi: 10.1016/j.jneumeth.2003.10.009. [DOI] [PubMed] [Google Scholar]
- Eklund A, Nichols TE, Knutsson H. Cluster failure: Why fMRI inferences for spatial extent have inflated false-positive rates. Proceedings of the National Academy of Sciences of the United States of America. 2016;113(28):7900–7905. doi: 10.1073/pnas.1602413113. [DOI] [PMC free article] [PubMed] [Google Scholar]
- Ergenoglu T, Demiralp T, Bayraktaroglu Z, Ergen M, Beydagi H, Uresin Y. Alpha rhythm of the EEG modulates visual detection performance in humans. Cognitive Brain Research. 2004;20(3):376–383. doi: 10.1016/j.cogbrainres.2004.03.009. [DOI] [PubMed] [Google Scholar]
- Fox NA, Bakermans-Kranenburg MJ, Yoo KH, Bowman LC, Cannon EN, Vanderwert RE, … van IMH. Assessing human mirror activity with EEG mu rhythm: A meta-analysis. Psychol Bull. 2016;142(3):291–313. doi: 10.1037/bul0000031. [DOI] [PMC free article] [PubMed] [Google Scholar]
- Gao W, Gilmore JH, Giovanello KS, Smith JK, Shen D, Zhu H, Lin W. Temporal and spatial evolution of brain network topology during the first two years of life. PLoS One. 2011;6(9):e25278. doi: 10.1371/journal.pone.0025278. [DOI] [PMC free article] [PubMed] [Google Scholar]
- Gao W, Zhu H, Giovanello KS, Smith JK, Shen D, Gilmore JH, Lin W. Evidence on the emergence of the brain’s default network from 2-week-old to 2-year-old healthy pediatric subjects. Proc Natl Acad Sci U S A. 2009;106(16):6790–6795. doi: 10.1073/pnas.0811221106. [DOI] [PMC free article] [PubMed] [Google Scholar]
- Gomarus HK, Althaus M, Wijers AA, Minderaa RB. The effects of memory load and stimulus relevance on the EEG during a visual selective memory search task: An ERP and ERD/ERS study. Clinical Neurophysiology. 2006;117(4):871–884. doi: 10.1016/j.clinph.2005.12.008. [DOI] [PubMed] [Google Scholar]
- Guy MW, Zieber N, Richards JE. The Cortical Development of Specialized Face Processing in Infancy. Child Dev. 2016 doi: 10.1111/cdev.12543. [DOI] [PMC free article] [PubMed]
- Hammers A, Allom R, Koepp MJ, Free SL, Myers R, Lemieux L, … Duncan JS. Three-dimensional maximum probability atlas of the human brain, with particular reference to the temporal lobe. Hum Brain Mapp. 2003;19(4):224–247. doi: 10.1002/hbm.10123. [DOI] [PMC free article] [PubMed] [Google Scholar]
- Klimesch W. EEG alpha and theta oscillations reflect cognitive and memory performance: a review and analysis. Brain Res Brain Res Rev. 1999;29(2–3):169–195. doi: 10.1016/s0165-0173(98)00056-3. [DOI] [PubMed] [Google Scholar]
- Klimesch W, Sauseng P, Hanslmayr S. EEG alpha oscillations: the inhibition-timing hypothesis. Brain Research Reviews. 2007;53(1):63–88. doi: 10.1016/j.brainresrev.2006.06.003. [DOI] [PubMed] [Google Scholar]
- Knyazev GG, Slobodskoj-Plusnin JY, Bocharou AV, Pylkova LV. The default mode network and EEG alpha oscillations: An independent component analysis. Brain Research. 2011;1402:67–79. doi: 10.1016/j.brainres.2011.05.052. [DOI] [PubMed] [Google Scholar]
- Libertus ME, Pruitt LB, Woldorff MG, Brannon EM. Induced alpha-band oscillations reflect ratio-dependent number discrimination in the infant brain. J Cogn Neurosci. 2009;21(12):2398–2406. doi: 10.1162/jocn.2008.21162. [DOI] [PubMed] [Google Scholar]
- Mallin BM, Richards JE. Peripheral Stimulus Localization by Infants of Moving Stimuli on Complex Backgrounds. Infancy. 2012;17(6):692–714. doi: 10.1111/j.1532-7078.2011.00109.x. [DOI] [PMC free article] [PubMed] [Google Scholar]
- Mantini D, Perrucci MG, Del Gratta C, Romani GL, Corbetta M. Electrophysiological signatures of resting state networks in the human brain. Proceedings of the National Academy of Sciences of the United States of America. 2007;104(32):13170–13175. doi: 10.1073/pnas.0700668104. [DOI] [PMC free article] [PubMed] [Google Scholar]
- Marshall PJ, Bar-Haim Y, Fox NA. Development of the EEG from 5 months to 4 years of age. Clin Neurophysiol. 2002;113(8):1199–1208. doi: 10.1016/s1388-2457(02)00163-3. [DOI] [PubMed] [Google Scholar]
- Marshall PJ, Meltzoff AN. Neural mirroring systems: Exploring the EEG mu rhythm in human infancy. Developmental Cognitive Neuroscience. 2011;1(2):110–123. doi: 10.1016/j.dcn.2010.09.001. [DOI] [PMC free article] [PubMed] [Google Scholar]
- Marshall PJ, Saby JN, Meltzoff AN. Imitation and the Developing Social Brain: Infants’ Somatotopic EEG Patterns for Acts of Self and Other. Int J Psychol Res (Medellin) 2013;6:22–29. doi: 10.21500/20112084.714. [DOI] [PMC free article] [PubMed] [Google Scholar]
- Marshall PJ, Young T, Meltzoff AN. Neural correlates of action observation and execution in 14-month-old infants: an event-related EEG desynchronization study. Developmental Science. 2011;14(3):474–480. doi: 10.1111/j.1467-7687.2010.00991.x. [DOI] [PMC free article] [PubMed] [Google Scholar]
- Michel CM, Murray MM, Lantz G, Gonzalez S, Spinelli L, Grave de Peralta R. EEG source imaging. Clin Neurophysiol. 2004;115(10):2195–2222. doi: 10.1016/j.clinph.2004.06.001. [DOI] [PubMed] [Google Scholar]
- Nystrom P. The infant mirror neuron system studied with high density EEG. Soc Neurosci. 2008;3(3–4):334–347. doi: 10.1080/17470910701563665. [DOI] [PubMed] [Google Scholar]
- Onton J, Delorme A, Makeig S. Frontal midline EEG dynamics during working memory. Neuroimage. 2005;27(2):341–356. doi: 10.1016/j.neuroimage.2005.04.014. [DOI] [PubMed] [Google Scholar]
- Oostenveld R, Fries P, Maris E, Schoffelen JM. FieldTrip: Open source software for advanced analysis of MEG, EEG, and invasive electrophysiological data. Comput Intell Neurosci. 2011;2011:156869. doi: 10.1155/2011/156869. [DOI] [PMC free article] [PubMed] [Google Scholar]
- Orekhova EV, Stroganova TA, Posikera IN. Theta synchronization during sustained anticipatory attention in infants over the second half of the first year of life. International Journal of Psychophysiology. 1999;32(2):151–172. doi: 10.1016/S0167-8760(99)00011-2. [DOI] [PubMed] [Google Scholar]
- Orekhova EV, Stroganova TA, Posikera IN. Alpha activity as an index of cortical inhibition during sustained internally controlled attention in infants. Clin Neurophysiol. 2001;112(5):740–749. doi: 10.1016/s1388-2457(01)00502-8. [DOI] [PubMed] [Google Scholar]
- Pascual-Marqui RD, Lehmann D, Koukkou M, Kochi K, Anderer P, Saletu B, … Kinoshita T. Assessing interactions in the brain with exact low-resolution electromagnetic tomography. Philos Trans A Math Phys Eng Sci. 2011;369(1952):3768–3784. doi: 10.1098/rsta.2011.0081. [DOI] [PubMed] [Google Scholar]
- Raichle ME, MacLeod AM, Snyder AZ, Powers WJ, Gusnard DA, Shulman GL. A default mode of brain function. Proc Natl Acad Sci U S A. 2001;98(2):676–682. doi: 10.1073/pnas.98.2.676. [DOI] [PMC free article] [PubMed] [Google Scholar]
- Reynolds GD, Richards JE. Familiarization, attention, and recognition memory in infancy: an event-related potential and cortical source localization study. Dev Psychol. 2005;41(4):598–615. doi: 10.1037/0012-1649.41.4.598. [DOI] [PMC free article] [PubMed] [Google Scholar]
- Reynolds GD, Richards JE. Cortical Source Localization of Infant Cognition. Developmental Neuropsychology. 2009;34(3):312–329. doi: 10.1080/87565640902801890. Pii 91099696210.1080/87565640902801890. [DOI] [PMC free article] [PubMed] [Google Scholar]
- Reynolds GD, Romano AC. The Development of Attention Systems and Working Memory in Infancy. Front Syst Neurosci. 2016;10 doi: 10.3380/Fnsys.2016.00015. Artn 15. [DOI] [PMC free article] [PubMed] [Google Scholar]
- Reynolds GD, Richards JE. Infant heart rate: A developmental psychophysiological perspective. In: Segalowitz LASSJ, editor. Developmental Psychophysiology. Cambridge, UK: Cambridge Press; 2008. pp. 173–210. [Google Scholar]
- Richards JE. Effects of attention on infants’ preference for briefly exposed visual stimuli in the paired-comparison recognition-memory paradigm. Dev Psychol. 1997;33(1):22–31. doi: 10.1037//0012-1649.33.1.22. [DOI] [PubMed] [Google Scholar]
- Richards JE. Attention affects the recognition of briefly presented visual stimuli in infants: an ERP study. Dev Sci. 2003;6(3):312–328. doi: 10.1111/1467-7687.00287. [DOI] [PMC free article] [PubMed] [Google Scholar]
- Richards JE. Attention in young infants: A developmental psychophysiological perspective. In: Nelson CA, Luciana M, editors. Handbook of developmental cognitive neuroscience. 2. Cambridge, MA, US: MIT Press; 2008. pp. 479–497. [Google Scholar]
- Richards JE. The development of attention to simple and complex visual stimuli in infants: Behavioral and psychophysiological measures. Developmental Review. 2010;30(2):203–219. doi: 10.1016/j.dr.2010.03.005. [DOI] [PMC free article] [PubMed] [Google Scholar]
- Richards JE, Boswell C, Stevens M, Vendemia JM. Evaluating methods for constructing average high-density electrode positions. Brain Topogr. 2015;28(1):70–86. doi: 10.1007/s10548-014-0400-8. [DOI] [PMC free article] [PubMed] [Google Scholar]
- Richards JE, Sanchez C, Phillips-Meek M, Xie W. A database of age-appropriate average MRI templates. Neuroimage. 2016;124(Pt B):1254–1259. doi: 10.1016/j.neuroimage.2015.04.055. [DOI] [PMC free article] [PubMed] [Google Scholar]
- Richards JEXW. Brains for all the ages: Structural neurodevelopment in infants and children from a life-span perspective. In: Benson J, editor. Advances in Child Development and Behavior. Vol. 48. Philadephia, PA: Elsevier; 2015. pp. 1–52. [DOI] [PubMed] [Google Scholar]
- Sadaghiani S, Hesselmann G, Kleinschmidt A. Distributed and Antagonistic Contributions of Ongoing Activity Fluctuations to Auditory Stimulus Detection. Journal of Neuroscience. 2009;29(42):13410–13417. doi: 10.1523/JNEUROSCI.2592-09.2009. [DOI] [PMC free article] [PubMed] [Google Scholar]
- Sadaghiani S, Scheeringa R, Lehongre K, Morillon B, Giraud AL, Kleinschmidt A. Intrinsic connectivity networks, alpha oscillations, and tonic alertness: a simultaneous electroencephalography/functional magnetic resonance imaging study. J Neurosci. 2010;30(30):10243–10250. doi: 10.1523/JNEUROSCI.1004-10.2010. [DOI] [PMC free article] [PubMed] [Google Scholar]
- Sauseng P, Hoppe J, Klimesch W, Gerloff C, Hummel FC. Dissociation of sustained attention from central executive functions: local activity and interregional connectivity in the theta range. Eur J Neurosci. 2007;25(2):587–593. doi: 10.1111/j.1460-9568.2006.05286.x. [DOI] [PubMed] [Google Scholar]
- Sauseng P, Klimesch W, Stadler W, Schabus M, Doppelmayr M, Hanslmayr S, … Birbaumer N. A shift of visual spatial attention is selectively associated with human EEG alpha activity. European Journal of Neuroscience. 2005;22(11):2917–2926. doi: 10.1111/j.1460-9568.2005.04482.x. [DOI] [PubMed] [Google Scholar]
- Shattuck DW, Mirza M, Adisetiyo V, Hojatkashani C, Salamon G, Narr KL, … Toga AW. Construction of a 3D probabilistic atlas of human cortical structures. Neuroimage. 2008;39(3):1064–1080. doi: 10.1016/j.neuroimage.2007.09.031. [DOI] [PMC free article] [PubMed] [Google Scholar]
- Shulman GL, Fiez JA, Corbetta M, Buckner RL, Miezin FM, Raichle ME, Petersen SE. Common Blood Flow Changes across Visual Tasks: II. Decreases in Cerebral Cortex. J Cogn Neurosci. 1997;9(5):648–663. doi: 10.1162/jocn.1997.9.5.648. [DOI] [PubMed] [Google Scholar]
- Smith SM, Jenkinson M, Woolrich MW, Beckmann CF, Behrens TE, Johansen-Berg H, … Matthews PM. Advances in functional and structural MR image analysis and implementation as FSL. Neuroimage. 2004;23(Suppl 1):S208–219. doi: 10.1016/j.neuroimage.2004.07.051. [DOI] [PubMed] [Google Scholar]
- Stroganova TA, Orekhova EV, Posikera IN. EEG alpha rhythm in infants. Clin Neurophysiol. 1999;110(6):997–1012. doi: 10.1016/s1388-2457(98)00009-1. [DOI] [PubMed] [Google Scholar]
- Thorpe SG, Cannon EN, Fox NA. Spectral and source structural development of mu and alpha rhythms from infancy through adulthood. Clinical Neurophysiology. 2016;127(1):254–269. doi: 10.1016/j.clinph.2015.03.004. [DOI] [PMC free article] [PubMed] [Google Scholar]
- Thut G, Nietzel A, Brandt SA, Pascual-Leone A. Alpha-band electroencephalographic activity over occipital cortex indexes visuospatial attention bias and predicts visual target detection. J Neurosci. 2006;26(37):9494–9502. doi: 10.1523/JNEUROSCI.0875-06.2006. [DOI] [PMC free article] [PubMed] [Google Scholar]
- Worden MS, Foxe JJ, Wang N, Simpson GV. Anticipatory biasing of visuospatial attention indexed by retinotopically specific alpha-band electroencephalography increases over occipital cortex. J Neurosci. 2000;20(6):1–6. doi: 10.1523/JNEUROSCI.20-06-j0002.2000. [DOI] [PMC free article] [PubMed] [Google Scholar]
- Xie W, Richards JE. Effects of interstimulus intervals on behavioral, heart rate, and event-related potential indices of infant engagement and sustained attention. Psychophysiology. 2016a;53(8):1128–1142. doi: 10.1111/psyp.12670. [DOI] [PMC free article] [PubMed] [Google Scholar]
- Xie W, Richards JE. The Relation between Infant Covert Orienting, Sustained Attention and Brain Activity. Brain Topography. 2016b;1:1–22. doi: 10.1007/s10548-016-0505-3. [DOI] [PMC free article] [PubMed] [Google Scholar]
Associated Data
This section collects any data citations, data availability statements, or supplementary materials included in this article.