

SUMMARY
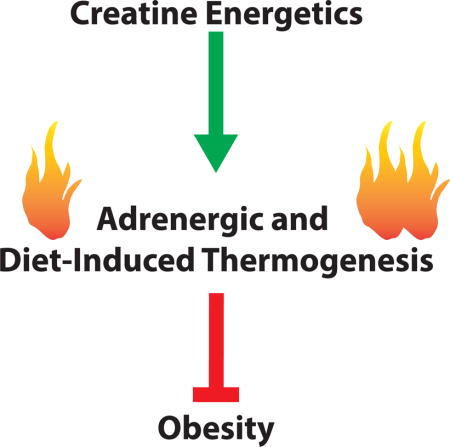
Diet-induced thermogenesis is an important homeostatic mechanism that limits weight gain in response to caloric excess and contributes to the relative stability of body weight in most individuals. We previously demonstrated that creatine enhances energy expenditure through stimulation of mitochondrial ATP turnover, but the physiological role and importance of creatine energetics in adipose tissue has not been explored. Here, we have inactivated the first and rate-limiting enzyme of creatine biosynthesis, glycine amidinotransferase (GATM), selectively in fat (Adipo-Gatm KO). Adipo-Gatm KO mice are prone to diet-induced obesity due to the suppression of elevated energy expenditure that occurs in response to high calorie feeding. This is paralleled by a blunted capacity for β3-adrenergic activation of metabolic rate, which is rescued by dietary creatine supplementation. These results provide strong in vivo genetic support for a role of GATM and creatine metabolism in energy expenditure, diet-induced thermogenesis, and defense against diet-induced obesity.
eTOC blurb
XXX et al investigate the physiological effects of creatine energetics through loss of function of the rate-limiting enzyme, glycine amidinotransferase (GATM), in adipose tissue. Adipo-Gatm KO mice cannot counteract increased calories with energy expenditure and gain weight. Their lower metabolic rate can be rescued by dietary creatine supplementation.
INTRODUCTION
The escalation in prevalence of obesity worldwide has led to a surge in the number of individuals with type 2 diabetes, cardiovascular disease and cancer, as well as rising health care costs (Adams et al., 2006; Juonala et al., 2011; Khandekar et al., 2011; Twig et al., 2016). Excess fat storage occurs when caloric intake persistently exceeds caloric expenditure (Ravussin et al., 1988); thus, obesity can be caused by increased food intake, decreased energy expenditure, or a combination of the two. However, body weight in most individuals is remarkably stable in response to experimentally imposed alterations in energy intake because of compensatory changes in energy expenditure (Leibel et al., 1995; Rosenbaum et al., 2008). Decreased food intake triggers a reduction in energy expenditure, which limits weight loss (Apfelbaum et al., 1971; Leibel and Hirsch, 1984; Miller and Parsonage, 1975; Rosenbaum et al., 2008; Rosenbaum et al., 2010). Conversely, excessive caloric intake enhances energy expenditure and thus limits weight gain in humans (Bouchard et al., 1990; Levine et al., 1999) and rodents (Bachman et al., 2002; Rothwell and Stock, 1979). Such a fine equilibrium is suggestive of precisely tuned metabolic regulatory systems (Hall et al., 2012).
Brown and beige adipose tissues dissipate chemical energy as heat, through non-shivering thermogenesis. This thermogenic activity offers tremendous potential to combat obesity (Harms and Seale, 2013; Lowell and Spiegelman, 2000; Rosen and Spiegelman, 2014). Brown fat function is historically evaluated by monitoring the activation of metabolic rate in response to adrenergic stimuli. By this measure, the capacity for brown adipose tissue (BAT)-mediated non-shivering thermogenesis is increased by exposure to environmental cold (Foster and Frydman, 1978) and to high-calorie diets (Bachman et al., 2002; Rothwell and Stock, 1979). Importantly, individuals who are predisposed to obesity exhibit decreased adrenergic-dependent thermogenic capacity (Jung et al., 1979), suggesting that this impairment is relevant in the context of human weight gain. In addition, certain genetically engineered mouse models that are predisposed to obesity exhibit reduced adrenergic activation of metabolic rate (Cohen et al., 2014; Feldmann et al., 2009).
The capacity to increase energy expenditure in response to caloric excess is referred to as diet-induced thermogenesis. Although components of this regulatory system have been identified (Bachman et al., 2002; Chen et al., 1996; Huszar et al., 1997; Krude et al., 1998; Lee et al., 1996; Zhang et al., 1994), the molecular mechanisms are not fully understood. High-fat feeding sensitizes animals to the thermogenic effects of noradrenaline (Feldmann et al., 2009; Himms-Hagen et al., 1986; Rothwell and Stock, 1979), strongly suggesting that thermogenic fat is a critical regulator of diet-induced thermogenesis. An obvious molecular candidate for driving diet-induced thermogenesis is Uncoupling Protein 1 (UCP1), the principal effector protein controlling cold-mediated non-shivering thermogenesis in fat.
Mice with ablation of Ucp1 (UCP1-KO) have rates of energy expenditure comparable to wild type animals across a range of environmental temperatures (Enerback et al., 1997; Feldmann et al., 2009; Liu et al., 2003; Meyer et al., 2010). Deletion of Ucp1 itself, or genetically engineered mice with severely reduced levels of Ucp1, are sensitive to acute cold exposure, indicating that UCP1 is critical for thermal homeostasis. However, these animals are resistant to diet-induced obesity at temperatures below the thermoneutral zone, when alternative thermogenic mechanisms are activated (Enerback et al., 1997; Liu et al., 2003; Thomas and Palmiter, 1997). The relative increase in body weight of UCP1-KO mice is greater than wild type animals at 30°C and UCP1-KO mice have impaired adrenergic activation of metabolic rate following four weeks of high fat feeding (Feldmann et al., 2009). However, UCP1-KO mice do not exhibit suppression of metabolic rate in the context of diet-induced thermogenesis, as the increase in oxygen consumption between wild type and knockout animals is identical in response to acute high fat feeding (Anunciado-Koza et al., 2008). Together, these data suggest that both UCP1-dependent and independent mechanisms play a role in diet-induced thermogenesis.
While UCP1 has not been demonstrated as sufficient for mediating diet-induced thermogenesis, this certainly does not exclude an involvement of thermogenic adipose tissues from this process. Inactivation of all three β-adrenergic receptors (β-less mice) causes massive obesity and suppresses induction of metabolic rate upon acute high-calorie feeding (Bachman et al., 2002). Therefore, obesity in β-less mice has been directly linked to inhibition of diet-induced thermogenesis, potentially through defective function of target tissues of the sympathetic nervous system. Such possibilities include brown, beige, and white adipose tissues, or skeletal muscle, where diet-induced thermogenesis may be induced by alternative futile cycles (Anunciado-Koza et al., 2008; Granneman et al., 2003; Meyer et al., 2010; Mottillo et al., 2014; Rowland et al., 2016; Ukropec et al., 2006).
We previously demonstrated that creatine enhances energy expenditure through stimulation of mitochondrial ATP turnover. Further support for this comes from data demonstrating that reduction of endogenous creatine levels with β-guanidinopropionic acid blunts adrenergic activation of metabolic rate and core body temperature in vivo, which is associated with a reduction in beige and brown fat oxidative metabolism (Kazak et al., 2015; Wakatsuki et al., 1996; Yamashita et al., 1995). However, the physiological importance of creatine metabolism in adipose tissue, specifically, has not been explored. Here, we take a genetic approach to reduce adipose tissue creatine synthesis in vivo through inactivation of the rate-limiting enzyme of creatine biosynthesis, Gatm. Our findings indicate that adipose tissue creatine energetics suppresses diet-induced thermogenesis and combats obesity.
RESULTS
Generation of fat-specific GATM knockout mice
To examine the physiological relevance of adipose tissue creatine metabolism, we deleted the rate-limiting enzyme of creatine biosynthesis selectively in adipose tissue (Figure 1A). Adenoviral delivery of Cre recombinase significantly reduced Gatm transcript levels in primary brown adipocytes from Gatm flox/flox (flox) animals, relative to GFP virus (Figure 1B). These results demonstrate appropriate targeting of loxP sites to the Gatm locus. Next, flox mice were bred to transgenic animals expressing Cre recombinase, driven by the fat-specific adiponectin promoter (Eguchi et al., 2011) to generate Adipo-Gatm KO (KO) mice (Figure 1C). Primary interscapular brown and subcutaneous adipocytes from the KO mice exhibited significantly reduced Gatm transcript abundance relative to cells from flox animals (Figures 1D and S1A). Gatm mRNA levels were not entirely deleted in Adiponectein-Cre transgenic cultures, likely because of Gatm expression in non-adiponectin expressing cells. In addition, the KO mice exhibited a substantial reduction in GATM protein, as assessed by Western blot analysis following purification of mature adipocytes from brown and subcutaneous adipose tissues (Figure 1E and 1G). There was no alteration in Gatm mRNA from non-adipose tissues (Figure S1B). Apparent mitochondrial respiratory chain abundance in BAT and subcutaneous adipocytes was unaltered in the KO mice (Figure 1F and 1G). UCP1 protein abundance was unaltered in the BAT of KO animals (Figure 1F). Strikingly, UCP1 protein levels were markedly higher, specifically in the subcutaneous fat cells from the KO animals (Figure 1G), which is consistent with prior work demonstrating a compensatory relationship between genes of creatine metabolism and UCP1 (Kazak et al., 2015). Together, these data demonstrate efficient deletion of Gatm from Cre-expressing adipocytes, without apparent disruption of the mitochondrial respiratory chain.
Figure 1. Disruption of Gatm and creatine metabolism in adipose tissue.
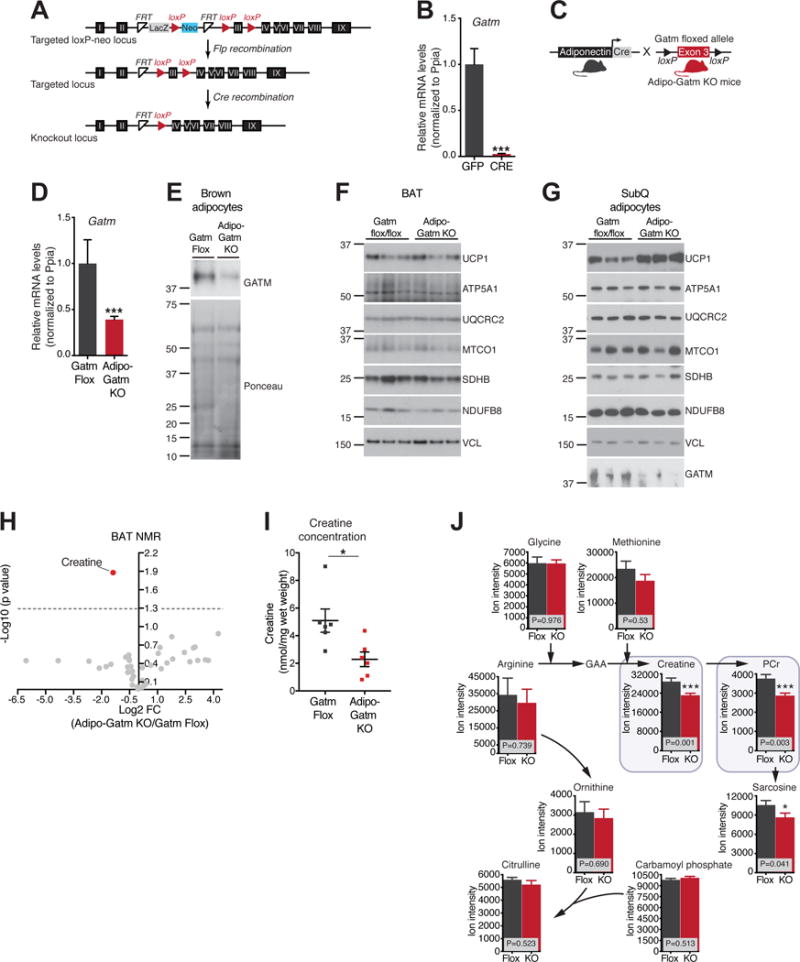
(A) Targeting strategy for the conditional disruption of the Gatm gene. (B) qRT-PCR of Gatm in primary brown adipocytes (genotype: Gatm flox/flox) following adenoviral-mediated transduction of GFP or Cre Recombinase, n = 6. (C) Cartoon of breeding strategy to generate adipose-specific Gatm knockout mice (Adipo-Gatm KO). (D) qRT-PCR of Gatm in primary brown adipocytes from Gatm flox/flox and Adipo-Gatm KO mice, n = 6. (E) Western blot of GATM from purified brown adipocytes. Ponceau staining was used to control for loading. (F) Representative Western blot from BAT from mice housed at 28°C. Vinculin (VCL) was used as loading control, n = 6–9 mice per genotype. (G) Western blot from purified subcutaneous (SubQ) adipocytes from mice housed at 4°C for 1 week. Vinculin (VCL) was used as loading control, n = 3 mice per genotype (each sample represents adipocytes isolated from 5 mice). (H) Volcano plot of metabolites differentially detected in BAT from Adipo-Gatm KO (KO) compared to Gatm flox/flox (flox) mice, n = 6 mice per genotype. (I) Creatine concentration in BAT from KO compared to flox mice, these data were obtained from the same experiment as shown in panel H. (J) LC-MS analysis of metabolites upstream and downstream of GATM activity in BAT from KO compared to flox animals, n = 6–9 mice per genotype. Data are presented as means ± SEM. *p < 0.05, ***p < 0.01.
Next, we measured steady state levels of creatine, phosphocreatine, and proximal metabolites in BAT. BAT was used for these measurements because it is the most homogeneous of the adipose tissue depots, in that the majority of cells from the tissue are bona fide adipocytes (Roh et al., 2017). This is particularly relevant, as measurement of creatine after purification of adipocytes is complicated by the fact that the creatine transporter promotes release of creatine from cells (Bera et al., 2008; Dodd et al., 1999). Utilizing nuclear magnetic resonance (NMR) spectroscopy, creatine abundance was significantly reduced (~60%) in the BAT of KO compared to flox animals (Figure 1H and 1I). Next, we corroborated these results using LC-MS. The downstream products of GATM activity (creatine, phosphocreatine, and sarcosine) were significantly reduced in the BAT of KO animals, with no alteration in steady state levels of metabolites upstream of GATM activity (Figure 1J). Metabolites involved in creatine energetics were unchanged in heart tissue of KO mice (Figure S1C). Together, these data demonstrate selective reduction of GATM, creatine and related metabolites in adipose tissue.
Fat-specific deletion of Gatm confers mild cold sensitivity
Pharmacological reduction of creatine using the creatine analogue β-guanidinopropionic acid reduces body temperature in response to cold (Kazak et al., 2015; Wakatsuki et al., 1996; Yamashita et al., 1995). Therefore, under these conditions, we sought to examine the role of adipose tissue creatine metabolism on body temperature of KO mice. First, using infrared thermography, interscapular temperature and total body temperature of KO mice was shown to be moderately reduced compared to controls upon transition to 4°C (Figures 2A and S2A). Next, rectal temperature measurements demonstrated significantly reduced body temperature of KO mice upon transition to 4°C (Figure 2B). Lastly, core body temperature was measured using surgically implanted transponders in the visceral cavity. Upon acute transition to 4°C, the body temperature of KO mice significantly decreased 1.5°C relative to flox and het animals (Figure 2C). Strikingly, KO mice defended a lower temperature for 72 hours following cold transition (Figure 2C). No difference in body temperature was detected between the genotypes at 28°C (Figures 2B and 2C). In the a cute phase, heat production to maintain thermal homeostasis is dependent on shivering. We measured shivering directly using electromyography (EMG). At 28°C, there was marginal EMG activity, while upon transition to 4°C, there was a robust increase in shivering in both genotypes to a similar extent (Figures 2D and 2E). Moreover, there was no change in physical activity of KO mice compared to controls, (Figure S2B). Together, these data suggest that adipose tissue Gatm and creatine energetics support adaptive thermogenesis in response to environmental cold.
Figure 2. Thermal biology of Adipo-Gatm KO mice.
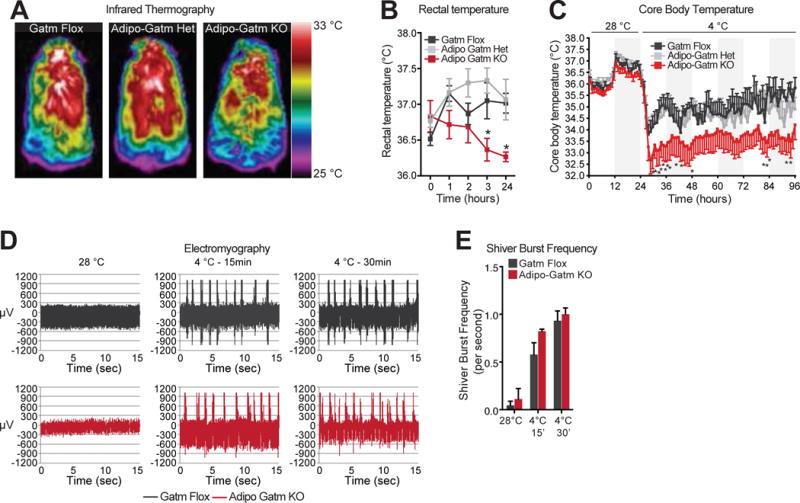
(A) Representative thermal images of flox, het and KO mice, 6 hours after transition from 28°C to 4°C. (B) Body temperature of flox, het and KO mice using a rectal probe, n = 6 mice per genotype. (C) Core body temperature, using implantable visceral transponders, following acute transition from 28°C to 4°C, n = 8–14 mice per genotype. (D) Representative EMG traces at 28°C and following 15 minutes and 30 minutes after the transition to 4°C. (E) Frequency of shivering bursts, quantified from data in panel D, n = 3 mice per genotype. Data are presented as means ± SEM. *p < 0.05.
Adipo-Gatm KO animals are prone to diet-induced obesity
Because deletion of Gatm in adipose tissue impaired thermal homeostasis in response to environmental cold, we explored the function of creatine energetics on energy balance and diet-induced obesity. Mice were reared on standard chow diet at 23°C until 8 weeks of age. Prior to high fa t feeding, the body mass of the KO mice was greater than the flox animals and trended higher than the het animals (Figure 3A). Because typical housing conditions (~20–24°C) cause small rodents to increase food intake and metabolism to defend their body temperature, we conducted our experiments at 28°C t o limit thermal stress. Under these conditions, the KO mice rapidly developed diet-induced obesity. The mass of the KO mice diverged from the flox and het animals following high fat feeding; the dynamic phase of weight gain occurred in the first 6 weeks (Figure 3B). By week four of high fat feeding, the KO mice were 8.7 ± 1.84g and 7.1 ± 0.99g heavier than the flox and het mice, respectively (Figure 3B). Body composition analysis demonstrated that the weight gain (80–85%) was primarily accounted for by adipose tissue accumulation (Figure 3C and 3D, left panels). Additionally, there was a minor, but significant, contribution to weight gain from lean mass (Figure 3C, right panel). When expressed as a percentage of total body weight, lean mass of the KO mice was significantly lower than the other two genotypes due to the large increase in fat mass (Figure 3D, right panel). Cumulative energy intake of both the KO and het mice was moderately, but significantly, greater than the flox animals (Figure 3E). Importantly however, there was no difference in energy intake between the KO and het genotypes despite the difference in weight gain (Figure 3E).
Figure 3. Adipo-Gatm KO mice are prone to diet-induced obesity.
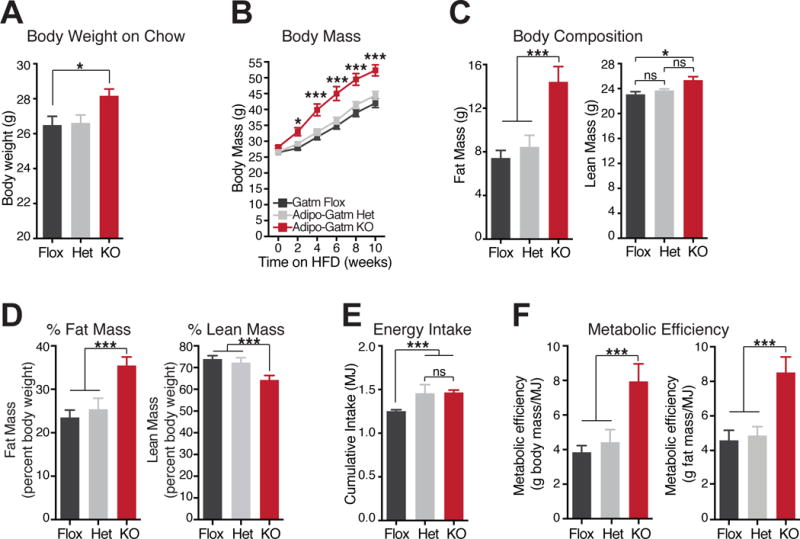
(A) Body weights of flox, het and KO mice at 8 weeks of age, reared at 23°C on chow diet. (B) Body mass during high fat feeding at 28°C. The 0 timepoint is the same data as in panel A, n = 9 mice per genotype. (C) Lean mass and fat mass after 4 weeks of high fat feeding, n = 9 mice per genotype. (D) Fat mass and lean mass plotted as a percentage of total body mass. (E) Cumulative Energy (MJ) intake following 4 weeks of high fat feeding, n = 9 mice per genotype. (F) Metabolic efficiency as measured by body mass or fat mass accumulation as a function of cumulative energy intake after 4 week of high fat feeding, n = 9 mice per genotype. Data are presented as means ± SEM. N = 5–9 mice per genotype. *p < 0.05, ***p < 0.01.
Increased metabolic efficiency is a hallmark of obesity (Bouchard et al., 1990; Canolty and Koong, 1976; Hainer et al., 2001; Leibel and Hirsch, 1984; Ravussin et al., 1988) and represents the fraction of assimilated energy that is stored somatically. Therefore, we examined metabolic efficiency by analyzing the fraction of ingested energy that was associated with i) the increase in total body mass or ii) the accumulation of fat mass. KO mice exhibited substantially higher metabolic efficiency under both analyses (Figure 3F). These data strongly suggest that fat-specific deletion of Gatm causes obesity due to increased metabolic efficiency.
Adipo-Gatm KO animals have mild metabolic impairment
Consistent with obesity, following four weeks of high fat feeding, KO animals exhibited impaired glucose tolerance compared to the flox and het mice (Figure 4A). Similarly, fasting plasma insulin levels were significantly elevated in the KO, compared to the flox mice five weeks after the onset of high fat feeding (Figure 4B). However, insulin tolerance tests demonstrated that the KO mice did not display signs of insulin resistance (Figure 4C). Together, these data demonstrate that fat-specific loss of Gatm causes obesity with mild metabolic dysfunction.
Figure 4. Increased energy assimilation is not the cause of diet-induced obesity of Adipo-Gatm KO mice.
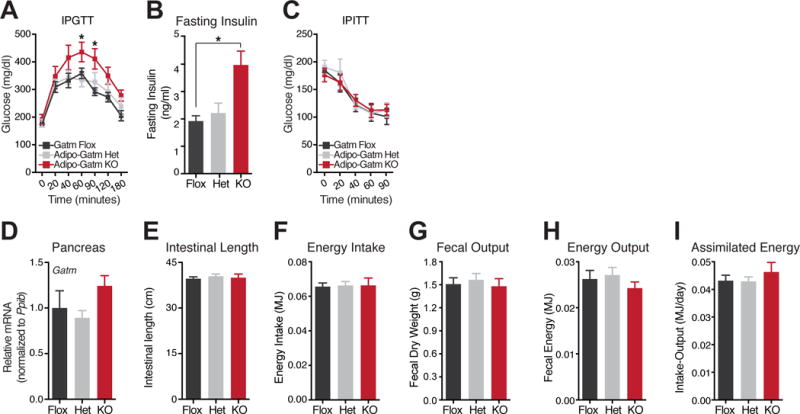
(A) Glucose tolerance test by intraperitoneal administration of glucose (IPGTT). Glucose was administered per total body mass at 1 g kg−1, following 8 weeks of high fat feeding, n = 5–6 mice per genotype. (B) Fasting Insulin levels were determined from plasma samples after 5 weeks of high fat feeding, n = 5–6 mice per genotype. (C) Insulin tolerance test by intraperitoneal administration of insulin (IPITT). Insulin was administered per total body mass at 1 U kg−1, following 10 weeks of high fat feeding, n = 5–6 mice per genotype. (D) qRT-PCR of Gatm in pancreas from flox, het and KO mice, n = 5–6 mice per genotype. (E) Intestinal length, n = 5–6 mice per genotype. (F) Cumulative energy (MJ) intake over 5 days, n = 7 mice per genotype. (G) Fecal dry weight (grams) output, over 5 days, n = 7 mice per genotype. (H) Fecal energy (MJ) output, over 5 days, n = 7 mice per genotype. (I) Assimilated energy (MJ), over 5 days, n = 7 mice per genotype. Data are presented as means ± SEM, *p < 0.05.
Obesity of Adipo-Gatm KO mice is not due to enhanced caloric absorption
To determine the physiological mechanism driving adipose expansion in KO mice, we focused on the possible contribution of caloric absorption. GATM is highly expressed in pancreatic exocrine acinar cells (Sorenson et al., 1995), which play an important role in nutrient absorption through the secretion of digestive enzymes. Thus, we assessed Gatm expression in pancreatic extracts. No difference in pancreatic Gatm mRNA abundance was observed between the Gatm genotypes (Figure 4D), demonstrating that there was no leaky expression of the Adiponectin-Cre transgene. We next assessed the potential for increased caloric absorption by measuring intestinal length. However, there was no difference between the genotypes (Figure 4E). Next, we evaluated caloric absorption directly. Monitoring of cumulative energy intake during high fat feeding did not reveal differences between genotypes (Figure 4F). At the same time, we collected the total fecal output and analyzed the energy content of feces using oxygen bomb calorimetry. We detected no significant differences in total fecal output (Figure 4G) or fecal energy content between genotypes (Figure 4H). Using oxygen bomb calorimetry to determine the energy content of the high fat diet, we were not able to detect differences in assimilated energy between the genotypes (Figure 4I). Collectively, these data indicate that excess nutrient absorption is not the cause of diet-induced obesity of KO mice.
Defective diet-induced thermogenesis in Adipo-Gatm KO mice
In order to determine whether diet-induced obesity was triggered by reduced energy expenditure, we monitored the resting metabolic rate of KO mice at thermoneutrality (RMRt) (Speakman et al., 2004), prior to a significant divergence in fat mass. At this early time point, the het and KO mice had a trend toward higher lean mass compared to flox animals, whereas the fat mass was highest in the KO animals (Figure 5A). There was no difference in average physical movement (Figure S3A) or cumulative food intake (Figure S3B) between genotypes. The RMRt data were analyzed four distinct ways. First, we expressed the data as milliliters oxygen consumed per mouse, without ratio normalization. The het and KO animals trended to be hypermetabolic compared to the flox animals, likely due to greater lean mass (Figure 5B). However, despite having marginally elevated lean mass, the KO animals trended towards a lower RMRt compared to the het animals, specifically (Figure 5B). These latter data suggested that the KO animals might have impaired energy expenditure.
Figure 5. Fat-specific deletion of Gatm suppresses diet-induced thermogenesis.
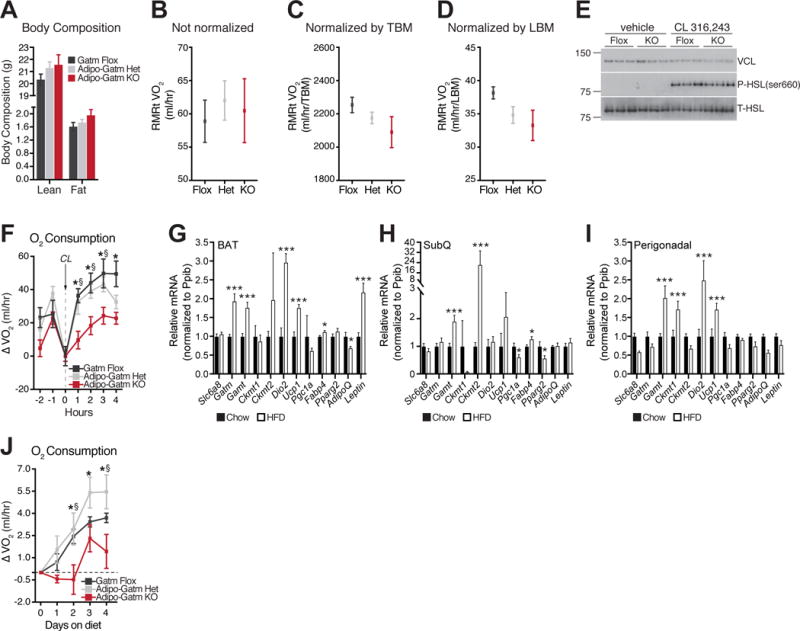
(A) Body composition (lean and fat mass) at 8 weeks of age, in mice reared at 23°C. Average of lowest three VO2 values of animals housed at 28°C following 5 days of high fat feeding and expressed (B) per mouse without ratio normalization, (C) by total body mass (TBM), and (D) by lean body mass (LBM), n = 4 mice per genotype. (E) Representative Western blot from BAT from mice housed at 28°C, and injected with saline (vehicle) or CL 316,243 (CL) at 1 mg kg−1, n = 6–9 mice per genotype. (F) CL-induced oxygen consumption, represented as changes over pre-CL values, n = 6 mice per genotype. (G) RT-qPCR analysis following 4 days of standard chow or high fat diet in brown adipose tissue (BAT), n = 5 mice per genotype. (H) RT-qPCR analysis following 4 days of standard chow or high fat diet in subcutaneous adipose tissue (SubQ), n = 5 mice per genotype. (I) RT-qPCR analysis following 4 days of standard chow or high fat diet in perigonadal adipose tissue, n = 5 mice per genotype. (J) Relative increase in high fat diet-induced oxygen consumption, measured continuously over 4 days, n = 5 mice per genotype. Data are presented as means ± SEM, *p < 0.05, ***p < 0.01. Statistics for panel (F) and (J) are as follows: *p < 0.05 (flox vs KO), §p < 0.05 (het vs KO).
To test this idea in more detail, we normalized the RMRt data by total body mass. With this analysis, the KO animals trended lower than both the flox and het mice (Figure 5C). This is likely the case because lean mass was the primary tissue responsible for the weight differences at this early time point. This idea was confirmed when lean body mass was used for ratio normalization, which demonstrated that the KO mice had a lower RMRt than the flox and het animals (Figure 5D). However, RMRt was not significantly different between groups when accounting for differences in lean body mass by ANCOVA (p = 0.272).
Because lean body mass was the dominant contributor to differences in RMRt, we examined the contribution of adipose tissue specifically to whole body metabolic rate. Adipose tissue metabolism can be induced in rodents through agonism of the fat-specific β3-adrenergic receptor, CL 316,243 (CL) (Arch et al., 1984; Bloom et al., 1992; Granneman et al., 2003; Harms et al., 1974). Adrenergic responsiveness can be masked at sub-thermoneutral temperatures when thermoregulatory thermogenesis is active. Therefore, we examined the acute response to CL in conscious free-moving mice at 28°C. To this end, we administered CL and monitored upstream adrenergic signaling and O2 consumption in parallel. We detected no genotype differences in the upstream PKA-dependent signaling events linked to the activation of fuel delivery, as assessed by Western blot of phosphorylated hormone sensitive lipase (HSL) at serine 660 (Figure 5E). These data indicate that adrenergic tone is intact in KO mice. Nevertheless, the KO animals had a severely blunted (~50–60%) O2 consumption response following acute CL administration (Figure 5F). Notably, at the time of injection, the KO mice were roughly 1g heavier than the flox and het groups (Figure S3C). Given that the increase in body mass was primarily due to lean mass (Figure 5A), a tissue that is not directly targeted by β3-agonism, the blunted metabolic activation of the KO mice was striking. Collectively, these data are consistent with suppression of diet-induced thermogenesis in KO animals given that activation of adrenergic signaling is similar among genotypes, but results in decreased energy expenditure in KO animals specifically.
It is well established that acute exposure to excess calories not only increases adrenergic responsiveness, but also increases resting energy expenditure (Bachman et al., 2002; Feldmann et al., 2009; Himms-Hagen et al., 1986; Rothwell and Stock, 1979). Therefore, we posited that if GATM regulates diet-induced thermogenesis, the ability of high fat feeding to trigger an increase in energy expenditure should be detectable in control (flox and het) animals but minimized in the KO mice. Therefore, we monitored the mRNA expression of genes involved in thermogenesis following acute high fat feeding in wild type animals. Gatm mRNA was significantly elevated (~2-fold) in response to acute (4 days) high fat feeding in BAT (Figure 5G). In addition, Gamt (responsible for the second step of the creatine biosynthetic pathway) was also significantly elevated in BAT (Figure 5G). Other genes that were significantly increased at the mRNA level in BAT were Dio2, Ucp1, Fabp4, and leptin (Figure 5G). Ckmt2 was significantly increased (~20-fold), as was Gamt (~2-fold) in the SubQ depot following acute high fat feeding (Figure 5H). Ckmt1 and Gamt were both augmented (~2-fold) in the perigonadal white fat in response to caloric excess, as were Dio2 and Ucp1 (Figure 5I). These findings demonstrate that acute high fat feeding increases transcripts of creatine metabolism genes in adipose tissue. To examine diet-induced thermogenesis directly, total energy expenditure was monitored in response to acute high fat feeding at 28°C. Strikingly, while high fat feeding rapidly triggered an increase in energy expenditure of flox and het mice, the response of the KO animals was significantly impaired (Figure 5J). Metabolic rates of the flox and het mice were induced upon transition to high fat feeding, and steadily increased daily (Figure 5J). In contrast, the induction of energy expenditure was completely absent in the KO animals during the first two days following transition to high fat diet and was severely impaired relative to the other genotypes during the entire duration of measurement (Figure 5J). These data directly demonstrate that GATM and creatine metabolism in adipose tissue promote diet-induced thermogenesis to combat obesity.
Dietary creatine supplementation rescues impaired adrenergic thermogenesis in Adipo-Gatm KO mice
To determine if the impaired thermogenesis of KO animals was primarily driven by creatine depletion, we compared the CL-induced metabolic rate between flox mice fed a control diet, KO mice fed a control diet, and KO mice fed a creatine-supplemented diet (Figure 6A). Consistent with our earlier findings (Figure 5F), KO mice fed the control diet had significantly impaired maximal CL-induced activation of metabolism, compared to flox animals fed the control diet (Figure 6B). Interestingly, creatine-supplemented KO animals also had a significantly reduced metabolic rate compared to control diet-fed flox animals (Figure 6B). In contrast, creatine supplementation rescued the average oxygen consumption that occurred after reaching the maximal CL response, to levels near identical to flox animals (Figure 6C). Next, we applied regression analysis to investigate the effect of creatine supplementation on the relationship between CL-induced metabolic rate and body weight. The rate of change of average oxygen consumption per unit change in body mass was proportionately higher in creatine-supplemented KO mice compared to KO mice fed the control diet (Figure 6D). Post hoc pairwise comparisons of mean difference in oxygen consumption, accounting for total body mass as a covariate in the ANCOVA, showed significantly decreased adrenergic thermogenesis of KO animals compared to flox mice (Figure 6E). Strikingly, creatine supplementation significantly increased the CL-induced metabolic rate of KO animals to the extent that the mean difference in oxygen consumption was not significantly different than flox mice, while the mean difference in oxygen consumption was significantly greater compared to control-fed KO mice (Figure 6E). Hence, creatine supplementation can rescue the suppressed adrenergic thermogenesis of Adipo-Gatm KO animals. Specifically, creatine supplementation does not primarily drive an increase in the maximal CL response, but significantly prolongs the ability to sustain adrenergic activation of metabolic rate over time. Together, these data show that creatine depletion is the primary cause of increased metabolic efficiency and decreased adaptive thermogenesis of mice lacking adipocyte GATM.
Figure 6. Dietary creatine supplementation rescues impaired adrenergic thermogenesis of Adipo-Gatm KO mice.
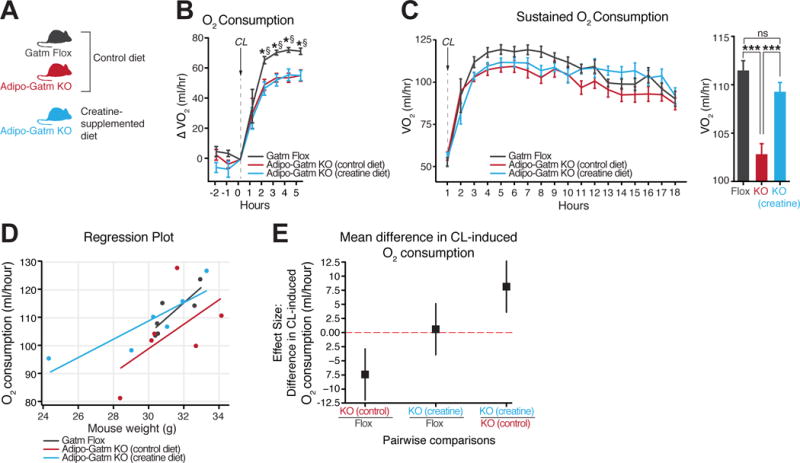
(A) Experimental group set up for creatine rescue experiment. (B) CL-induced oxygen consumption (ml/hour), represented as changes over pre-CL values, n = 6 mice per group. CL 316,243 was injected intraperitonealy at (1 mg kg−1). (C) Absolute oxygen consumption (ml/hour) following CL (1 mg kg−1) administration. Bar graph representing average oxygen consumption following maximal CL response (3–15 hours after CL injection). n = 6 mice per group. (D) Regression plot comparing the oxygen consumption as a function of mouse weight. n = 6 mice per group. (E) Post hoc (Tukey’s HSD) pairwise comparison showing the mean difference in oxygen consumption between groups. Error bars = 95% confidence interval for oxygen consumption (ml/hr). n = 6 mice per group. Data are presented as means ± SEM, ***p < 0.01. Statistics for panel (B) are as follows: *p < 0.05 (flox control diet vs. KO control diet), §p < 0.05 (flox control diet vs KO creatine diet).
DISCUSSION
Our prior work, using in vitro and chemical approaches, suggested a critical role for adipose tissue creatine metabolism in enhancing energy expenditure through stimulation of ATP turnover (Kazak et al., 2015). We have now examined the physiological relevance of adipose tissue creatine energetics specifically by genetic ablation of the first and rate-limiting enzyme of creatine synthesis, GATM, using a Cre recombinase that is adipose tissue-selective. Since we used a Cre recombinase driven by the adiponectin promoter, Gatm was ablated in all fat depots. Notably, while GATM abundance is more than 5-fold higher in beige fat mitochondria compared to brown fat mitochondria (Kazak et al., 2015), the greater abundance of these organelles in brown relative to beige adipose tissue suggests that creatine energetics may promote thermogenesis in all types of fat cells in vivo. Under thermoneutral conditions, BAT is the dominant effector. The data presented herein, indicate that Gatm and creatine depletion impairs diet-induced thermogenesis primarily in BAT, when studied at thermoneutrality. Indeed, while pharmacological reduction of creatine in vivo suppresses oxidative metabolism in beige fat, there is a strong trend towards impairment of energy expenditure that is quantitatively larger in BAT (Kazak et al., 2015). Moreover, the compensatory increase of UCP1 protein in purified subcutaneous adipocytes from KO mice may be a consequence of BAT dysfunction. As shown here, genetic disruption of creatine synthesis specifically in fat has a dramatic effect on energy expenditure and the development of obesity on high fat diet. Collectively, the data presented here demonstrate that adipose tissue is a dominant site of diet-induced thermogenesis regulation, consistent with earlier studies (Bachman et al., 2002; Feldmann et al., 2009; Rothwell and Stock, 1979). Obviously, the current work makes the critical role of adipose tissue creatine metabolism much clearer in physiological and pathological contexts.
Given the broad importance of creatine energetics in tissues such as heart, skeletal muscle and brain, it is not surprising that the results presented here differ markedly from previous studies using whole body Gatm knockout mice (Choe et al., 2013). In fact, global Gatm KO animals have reduced fat deposition and are protected from diet-induced obesity at room temperature. However, this is at the expense of reduced body length, chronic muscular hypotonia, and severe scoliosis (Choe et al., 2013). It is conceivable that the thermal stress placed on the global Gatm KO mice at room temperature is enhanced due to these latter effects at the whole body level. Given that fat-specific deletion of Gatm results in diet-induced obesity at thermoneutrality, it is reasonable to conclude that the reduction in adipose expansion in the global Gatm KO mouse is likely a secondary consequence resulting from multi-tissue dysfunction and increased thermal stress.
It is intriguing that genes and proteins regulating creatine metabolism are highly selective for BAT compared to white fat in humans. Mitochondrial creatine kinase expression has been identified at the mRNA level specifically in human BAT compared to white fat (Svensson et al., 2011). In addition, global proteomic analysis on deep neck human BAT compared to paired white fat also identified the mitochondrial creatine kinases as being exclusively expressed in BAT (Muller et al., 2016). Clonal human brown/beige adipocytes also exhibit powerful effects on oxidative metabolism upon creatine modulation (Kazak et al., 2015). Cold stress has a profound effect on metabolic studies. The majority of the human population lives at or near thermoneutrality, assisted by clothing and heating, and so conducting metabolic studies exempt from thermal stress is more relevant to human physiology (Harms and Seale, 2013). Notably, the results presented herein were derived from experiments conducted under thermoneutral housing, and so the drive for heat production to combat heat loss was eliminated. Under these conditions, the physiological relevance of adipose tissue GATM and creatine metabolism is revealed. Taken together, creatine energetics may play an important role in the metabolism of human thermogenic fat.
Mice with adipose tissue ablation of Gatm showed mild metabolic dysfunction with impaired glucose clearance and hyperinsulinemia in the fasted state. It is important to note that these studies were carried out in young animals with rapid onset obesity. Presumably, a longer time course of high fat feeding, or the use of older animals would establish the full extent of metabolic dysfunction in Adipo-Gatm KO mice.
Our results might provide an explanation for previous studies regarding the adipose tissue wasting effects by environmental polychlorinated dibenzodioxins, such as 2,3,7,8-tetrachlorodibenzo-p-dioxin (TCDD) (Houlahan et al., 2015). TCDD is lipophilic, and accumulates in white fat, resulting in rapid weight loss (Seefeld et al., 1984), and results in mobilization of energy stores (Li et al., 2007). Transcriptional profiling of white adipose tissue identified Gatm to be the only gene with significantly lower expression in a rat strain that is resistant to the wasting effects of TCCD (Houlahan et al., 2015). The current work support the idea that decreased creatine metabolism may be an adaptive mechanism for energy conservation upon TCDD exposure.
Multiple lines of evidence strongly suggest that the marked obesity observed in Adipo-Gatm KO mice is due to impaired diet-induced thermogenesis. First, the food intake of the het and KO mice fed a high calorie diet was identical, even though the KO mice gained substantially more adipose tissue mass. Second, adrenergic signaling was similar between flox and KO mice but resulted in decreased energy expenditure in the KO animals specifically. Third, and most importantly, the feeding of a high calorie diet caused a marked increase in the metabolic rate (diet-induced thermogenesis) in flox and het mice, but this response was significantly reduced in KO animals. Particularly, diet-induced thermogenesis was completely abolished in the KO mice in the first two days following transition to high fat feeding. Transient energy and fat imbalances in the first several days following a diet switch can account for a significant fraction of the total body weight change (Guo and Hall, 2009). Therefore, the absence of diet-induced thermogenesis in KO mice in the first days following a high fat diet switch may largely explain their profound susceptibility to diet-induced obesity.
In conclusion, our results provide in vivo genetic support for a role for adipose tissue GATM and creatine metabolism in energy expenditure and the defense against diet-induced obesity. It is important to note that our findings do not exclude the possibility that additional metabolic pathways contribute to the physiology exhibited in the context of GATM deficiency in fat. Nevertheless, these findings demonstrate that diet-induced thermogenesis plays a critical role in body weight homeostasis and that adipose tissue creatine energetics is a key effector of this process. How and whether this pathway can be manipulated for therapeutic purposes remains to be determined.
CONTACT FOR REAGENT AND RESOURCE SHARING
Further information and requests for resources and reagents should be directed to and will be fulfilled by the Lead Contact, Bruce M. Spiegelman (bruce_spiegelman@dfci.harvard.edu).
EXPERIMENTAL MODEL AND SUBJECT DETAILS
Animals
Mice were housed at 23°C under a 12 hr light/dark cycle with free access to food and water until 8 weeks of age. All experiments used age-matched male littermates and were conducted at 28°C. Animal experiments were performed according to procedures approved by the Institutional Animal Care and Use Committee (IACUC) of the Beth Israel Deaconess Medical Center or the Harvard Center for Comparative Medicine.
Breeding Schemes For Adipo-Gatm KO Mice
Gatm flox animals (Gatmtm1a(KOMP)Wtsi) on a C57BL/6NTac background were obtained from the European Mouse Mutant Archive (EMMA). Transgenic mice expressing Flpe recombinase (Jackson, stock No: 003800) were used to delete the neomycin resistance cassette and to generate mice with conditional potential. Adiponectin-Cre mice, maintained on a C57BL/6J background, were bred to Gatm flox/flox animals to generate experimental groups. All animals utilized for experiments were age-matched littermates. To obtain age-matched littermates of Gatm flox/flox, Adipo-Gatm heterozygous, and Adipo-Gatm KO mice, breeding was conducted with three Gatm floxed alleles and one Adiponectin-Cre allele between the breeding pairs.
METHOD DETAILS
High fat feeding
Adipo-Gatm KO mice and age-matched littermate controls (Gatm flox/flox and Adipo-Gatm heterozygous) were genotyped at 2 weeks of age. At three weeks of age, mice were weaned by genotype into groups of three per cage, where they were housed at 23°C and fed a chow diet. Mice of different genotypes were housed in cages side by side to limit variability in exposure to differential temperatures within the housing facility. At 8 weeks of age, mice (housed three per cage) were transferred to incubators set at 28°C and directly switched to high fat diet, which was a rodent diet (OpenSource Diets, D12492) with 60% kcal% fat, 20% kcal% carbohydrate, and 20% kcal% protein. C57BL/6NJ mice (Jackson labs; stock No: 005304) were used as wild type mice for examining mRNA levels during diet-induced thermogenesis studies.
Whole Body Energy Expenditure
Metabolic studies in live animals were conducted at the Brigham and Women’s Hospital (BWH) Metabolic Core facility. Animals were housed individually in metabolic chambers maintained at 28°C under a 12 hr light/dark cycle with free access to food and water. Whole body metabolic rate was measured using the Oxymax open-circuit indirect calorimeter, Comprehensive Lab Animal Monitoring System (CLAMS, Columbus Instruments), available to the Brigham and Women’s Hospital Metabolic Phenotyping Core.
Body Composition
Body composition was examined with Echo MRI (Echo Medical Systems, Houston, Texas) using the 3-in-1 Echo MRI Composition Analyzer.
Adrenergic Activation of Metabolic Rate
Mice were injected with CL 316,243 (dissolved in saline) intraperitoneally at 1 mg kg−1 at 0600 hours. Mice were subsequently placed back in their metabolic cages, and oxygen consumption was monitored.
LC-MS Metabolomics
Steady state metabolomics experiments were conducted in collaboration with General Metabolics, LLC, and executed at General Metabolics’ labs according to the methodology described in (Fuhrer et al., 2011).
Nuclear Magnetic Resonance (NMR) Spectroscopy
Brown fat tissue samples (~20 mg) were homogenized and extracted with a mixture of ice-cold solvents water/methanol/chloroform (H2O/MeOH/CHCl3 1:1:1, v:v:v). The water/methanol phase was separated and dried in a speedvac. The extract was reconstituted in a 550 μl mixture containing 500 μl of phosphate buffer pH 7.4 and 50 μl of 1mM of TSP-d4 in D2O, vortexed for 20 seconds and transferred to 5 mm NMR tubes. The NMR spectra were acquired on a Bruker 600 MHz Avance III HD spectrometer equipped with a BBI room temperature probehead and SampleJet auto sampler (Bruker Biospin, Rheinstetten, Germany). 1H NMR spectra were recorded using 1D noesy pulse sequence with presaturation (noesygppr1d), collecting 256 scans with calibrated 90 degree pulse (~11 μs), 4.55 second acquisition time, and 4 second relaxation delay. Metabolites were identified and quantified using Chenomx NMR suite 8.2 software, by fitting the spectral lines of library compounds into the recorded NMR spectrum of tissue extract. The quantification was based on peak area of TSP-d4 signal. The metabolite concentrations are exported as μM in NMR sample and normalized to wet tissue mass (nmol/mg of tissue).
Body Temperature
A mouse rectal probe (World Precision Instruments) was used to examine body temperature. Body temperature was measured following 7 days acclimation to 28°C. Mice were implanted with an intraperitoneal telemetry temperature probes 7 days before the beginning of temperature measurements. Mice were maintained on a standard chow diet and housed at thermoneutrality (30°C) for 48–72 hours prior to experiment start. Transition from 30°C to 4°C was performed over a period of three hours.
Electromyography (EMG)
Mice were placed in a restrainer to limit free movement. Needle electrodes were placed subcutaneously, close to the back muscles near the neck, to measure muscle activity. EMG data were collected from the implanted electrodes at a sampling rate of 2 kHz using LabChart 8 Pro Software (ADInstruments, Colorado Springs, CO). The raw signal was converted to root mean square (RMS) activity. RMS activity was analyzed for shivering bursts in 10s windows. A burst was defined when RMS activity exceeded a threshold (set at 25 μV above the baseline level) for at least 200 ms. The baseline was defined as the mean EMG signal within the entire measurement window.
Gene Expression Analysis (qRT-PCR)
Total RNA was extracted from frozen tissue using TRIzol (Invitrogen), purified with RNeasy Mini spin columns (QIAGEN) and reverse transcribed using a High-Capacity cDNA Reverse Transcription kit (Applied Biosystems). The resultant cDNA was analyzed by qRT–PCR. Briefly, 20 ng cDNA and 150 nmol of each primer were mixed with GoTaq qPCR Master Mix (Promega). Reactions were performed in a 384-well format using an ABI PRISM 7900HT real time PCR system (Applied Biosystems). Relative mRNA levels were calculated using the comparative CT method and normalized to Ppib mRNA.
Western Blotting
Samples were prepared in Adipocyte Lysis Buffer (50 mM Tris, pH 7.4, 500 mM NaCl, 1% NP40, 20% glycerol, 5 mM EDTA and 1 mM phenylmethylsulphonyl fluoride (PMSF), supplemented with a cocktail of Roche protease inhibitors). The homogenates were centrifuged at 16,000 g × 10 minutes at 4°C, and the supernatants were used for subsequent analyses. Protein concentration was determined using the bicinchoninic acid assay (Pierce). Quantity of protein lysate to use for each antibody was determined empirically. Protein lysates were denatured in Laemmli buffer (60 mM Tris, pH 6.8, 2% SDS, 10% glycerol, 0.05 % bromophenol blue, 0.7 M β-mercaptoethanol), resolved by 4–12% NuPAGE Bis-Tris SDS–PAGE (Invitrogen) and transferred to a polyvinylidene difluoride (PVDF) membrane. Primary antibodies were diluted in TBS containing 0.05% Tween (TBS-T), 5% BSA and 0.02% NaN3. Membranes were incubated overnight with primary antibodies at 4°C. For secon dary antibody incubation, anti-rabbit or anti-mouse HRP (Promega) was diluted in TBS-T containing 5% milk. Results were visualized with enhanced chemiluminescence (ECL) western blotting substrates (Pierce).
QUANTIFICATION AND STATISTICAL ANALYSIS
Results are presented as mean ± SEM. Unpaired two-tailed Student’s t-test for pairwise comparison, one-way ANOVA for multiple comparisions, two-way ANOVA for multiple comparisons involving two independent variables, and ANCOVA for in vivo metabolic analyses were used to determine statistical differences. The Kruskal–Wallis test was used to test whether samples originate from the same distribution. Significance was considered as p < 0.05. Statistical analysis and plotting for metabolic studies was performed in the R programming language with CalR, a custom package for analysis of indirect calorimetry using analysis of covariance with a graphical user interface. n values represent biological replicates for cultured cell experiments or individual animals for in vivo experiments. Specific details for n value are noted in each figure legend.
Supplementary Material
Highlights.
Fat-specific deletion of GATM depletes creatine and phosphocreatine from brown fat
Creatine energetics supports cold- and adrenergic-mediated adaptive thermogenesis
Adipo-Gatm KO mice are obese on a high fat diet
Dietary creatine rescues impaired adrenergic thermogenesis of Adipo-Gatm KO mice
Acknowledgments
We are grateful to all members of the Spiegelman lab for helpful discussions. This work was supported by a Canadian Institutes of Health Research postdoctoral fellowship (to L.K.), by a Human Frontier Science Program postdoctoral fellowship (to E.T.C.), by NIH R01HL 85744 and U24DK100469 Mayo Clinic Metabolomics Resource Core (to P.D.), by NIH/NIDDK P30DK034854 (to the BWH Metabolic Core facility), by R01DK102170, R01DK085171, R01DK102173 (to E.D.R.) and by an NIH grant (DK31405) and the JPB Foundation (to B.M.S.). B.M.S. is a consultant to Calico LLC.
Footnotes
Publisher's Disclaimer: This is a PDF file of an unedited manuscript that has been accepted for publication. As a service to our customers we are providing this early version of the manuscript. The manuscript will undergo copyediting, typesetting, and review of the resulting proof before it is published in its final citable form. Please note that during the production process errors may be discovered which could affect the content, and all legal disclaimers that apply to the journal pertain.
AUTHOR CONTRIBUTIONS
L.K. conceptualized the study, designed research, performed biochemical, cellular, and in vivo experiments, and analyzed data. E.T.C., G.Z.L., M.P.J., C.J.B., A.M., M.K., S.Z., I.V., and D.L.-B., performed experiments. P.D., A.S.B., and E.D.R. provided resources. L.K. and B.M.S. directed the research and co-wrote the paper, with input from all co-authors.
References
- Adams KF, Schatzkin A, Harris TB, Kipnis V, Mouw T, Ballard-Barbash R, Hollenbeck A, Leitzmann MF. Overweight, obesity, and mortality in a large prospective cohort of persons 50 to 71 years old. N Engl J Med. 2006;355:763–778. doi: 10.1056/NEJMoa055643. [DOI] [PubMed] [Google Scholar]
- Anunciado-Koza R, Ukropec J, Koza RA, Kozak LP. Inactivation of UCP1 and the glycerol phosphate cycle synergistically increases energy expenditure to resist diet-induced obesity. J Biol Chem. 2008;283:27688–27697. doi: 10.1074/jbc.M804268200. [DOI] [PMC free article] [PubMed] [Google Scholar]
- Apfelbaum M, Bostsarron J, Lacatis D. Effect of caloric restriction and excessive caloric intake on energy expenditure. Am J Clin Nutr. 1971;24:1405–1409. doi: 10.1093/ajcn/24.12.1405. [DOI] [PubMed] [Google Scholar]
- Arch JR, Ainsworth AT, Cawthorne MA, Piercy V, Sennitt MV, Thody VE, Wilson C, Wilson S. Atypical beta-adrenoceptor on brown adipocytes as target for anti-obesity drugs. Nature. 1984;309:163–165. doi: 10.1038/309163a0. [DOI] [PubMed] [Google Scholar]
- Bachman ES, Dhillon H, Zhang CY, Cinti S, Bianco AC, Kobilka BK, Lowell BB. betaAR signaling required for diet-induced thermogenesis and obesity resistance. Science. 2002;297:843–845. doi: 10.1126/science.1073160. [DOI] [PubMed] [Google Scholar]
- Bera S, Wallimann T, Ray S, Ray M. Enzymes of creatine biosynthesis, arginine and methionine metabolism in normal and malignant cells. FEBS J. 2008;275:5899–5909. doi: 10.1111/j.1742-4658.2008.06718.x. [DOI] [PubMed] [Google Scholar]
- Bloom JD, Dutia MD, Johnson BD, Wissner A, Burns MG, Largis EE, Dolan JA, Claus TH. Disodium (R,R)-5-[2-[[2-(3-chlorophenyl)-2-hydroxyethyl]-amino] propyl]-1,3-benzodioxole-2,2-dicarboxylate (CL 316,243). A potent beta-adrenergic agonist virtually specific for beta 3 receptors. A promising antidiabetic and antiobesity agent. J Med Chem. 1992;35:3081–3084. doi: 10.1021/jm00094a025. [DOI] [PubMed] [Google Scholar]
- Bouchard C, Tremblay A, Despres JP, Nadeau A, Lupien PJ, Theriault G, Dussault J, Moorjani S, Pinault S, Fournier G. The response to long-term overfeeding in identical twins. N Engl J Med. 1990;322:1477–1482. doi: 10.1056/NEJM199005243222101. [DOI] [PubMed] [Google Scholar]
- Canolty NL, Koong LJ. Utilization of energy for maintenance and for fat and lean gains by mice selected for rapid postweaning growth rate. J Nutr. 1976;106:1202–1208. doi: 10.1093/jn/106.8.1202. [DOI] [PubMed] [Google Scholar]
- Chen H, Charlat O, Tartaglia LA, Woolf EA, Weng X, Ellis SJ, Lakey ND, Culpepper J, Moore KJ, Breitbart RE, et al. Evidence that the diabetes gene encodes the leptin receptor: identification of a mutation in the leptin receptor gene in db/db mice. Cell. 1996;84:491–495. doi: 10.1016/s0092-8674(00)81294-5. [DOI] [PubMed] [Google Scholar]
- Choe CU, Nabuurs C, Stockebrand MC, Neu A, Nunes P, Morellini F, Sauter K, Schillemeit S, Hermans-Borgmeyer I, Marescau B, et al. L-arginine:glycine amidinotransferase deficiency protects from metabolic syndrome. Hum Mol Genet. 2013;22:110–123. doi: 10.1093/hmg/dds407. [DOI] [PubMed] [Google Scholar]
- Cohen P, Levy JD, Zhang Y, Frontini A, Kolodin DP, Svensson KJ, Lo JC, Zeng X, Ye L, Khandekar MJ, et al. Ablation of PRDM16 and beige adipose causes metabolic dysfunction and a subcutaneous to visceral fat switch. Cell. 2014;156:304–316. doi: 10.1016/j.cell.2013.12.021. [DOI] [PMC free article] [PubMed] [Google Scholar]
- Dodd JR, Zheng T, Christie DL. Creatine accumulation and exchange by HEK293 cells stably expressing high levels of a creatine transporter. Biochim Biophys Acta. 1999;1472:128–136. doi: 10.1016/s0304-4165(99)00113-0. [DOI] [PubMed] [Google Scholar]
- Eguchi J, Wang X, Yu S, Kershaw EE, Chiu PC, Dushay J, Estall JL, Klein U, Maratos-Flier E, Rosen ED. Transcriptional control of adipose lipid handling by IRF4. Cell Metab. 2011;13:249–259. doi: 10.1016/j.cmet.2011.02.005. [DOI] [PMC free article] [PubMed] [Google Scholar]
- Enerback S, Jacobsson A, Simpson EM, Guerra C, Yamashita H, Harper ME, Kozak LP. Mice lacking mitochondrial uncoupling protein are cold-sensitive but not obese. Nature. 1997;387:90–94. doi: 10.1038/387090a0. [DOI] [PubMed] [Google Scholar]
- Feldmann HM, Golozoubova V, Cannon B, Nedergaard J. UCP1 ablation induces obesity and abolishes diet-induced thermogenesis in mice exempt from thermal stress by living at thermoneutrality. Cell Metab. 2009;9:203–209. doi: 10.1016/j.cmet.2008.12.014. [DOI] [PubMed] [Google Scholar]
- Foster DO, Frydman ML. Brown adipose tissue: the dominant site of nonshivering thermogenesis in the rat. Experientia Suppl. 1978;32:147–151. doi: 10.1007/978-3-0348-5559-4_16. [DOI] [PubMed] [Google Scholar]
- Fuhrer T, Heer D, Begemann B, Zamboni N. High-throughput, accurate mass metabolome profiling of cellular extracts by flow injection-time-of-flight mass spectrometry. Anal Chem. 2011;83:7074–7080. doi: 10.1021/ac201267k. [DOI] [PubMed] [Google Scholar]
- Granneman JG, Burnazi M, Zhu Z, Schwamb LA. White adipose tissue contributes to UCP1-independent thermogenesis. Am J Physiol Endocrinol Metab. 2003;285:E1230–1236. doi: 10.1152/ajpendo.00197.2003. [DOI] [PubMed] [Google Scholar]
- Guo J, Hall KD. Estimating the continuous-time dynamics of energy and fat metabolism in mice. PLoS Comput Biol. 2009;5:e1000511. doi: 10.1371/journal.pcbi.1000511. [DOI] [PMC free article] [PubMed] [Google Scholar]
- Hainer V, Stunkard A, Kunesova M, Parizkova J, Stich V, Allison DB. A twin study of weight loss and metabolic efficiency. Int J Obes Relat Metab Disord. 2001;25:533–537. doi: 10.1038/sj.ijo.0801559. [DOI] [PubMed] [Google Scholar]
- Hall KD, Heymsfield SB, Kemnitz JW, Klein S, Schoeller DA, Speakman JR. Energy balance and its components: implications for body weight regulation. Am J Clin Nutr. 2012;95:989–994. doi: 10.3945/ajcn.112.036350. [DOI] [PMC free article] [PubMed] [Google Scholar]
- Harms HH, Zaagsma J, Van der Wal B. Beta-adrenoceptor studies. III. On the beta-adrenoceptors in rat adipose tissue. Eur J Pharmacol. 1974;25:87–91. doi: 10.1016/0014-2999(74)90098-3. [DOI] [PubMed] [Google Scholar]
- Harms M, Seale P. Brown and beige fat: development, function and therapeutic potential. Nat Med. 2013;19:1252–1263. doi: 10.1038/nm.3361. [DOI] [PubMed] [Google Scholar]
- Himms-Hagen J, Hogan S, Zaror-Behrens G. Increased brown adipose tissue thermogenesis in obese (ob/ob) mice fed a palatable diet. Am J Physiol. 1986;250:E274–281. doi: 10.1152/ajpendo.1986.250.3.E274. [DOI] [PubMed] [Google Scholar]
- Houlahan KE, Prokopec SD, Sun RX, Moffat ID, Linden J, Lensu S, Okey AB, Pohjanvirta R, Boutros PC. Transcriptional profiling of rat white adipose tissue response to 2,3,7,8-tetrachlorodibenzo-rho-dioxin. Toxicol Appl Pharmacol. 2015;288:223–231. doi: 10.1016/j.taap.2015.07.018. [DOI] [PubMed] [Google Scholar]
- Huszar D, Lynch CA, Fairchild-Huntress V, Dunmore JH, Fang Q, Berkemeier LR, Gu W, Kesterson RA, Boston BA, Cone RD, et al. Targeted disruption of the melanocortin-4 receptor results in obesity in mice. Cell. 1997;88:131–141. doi: 10.1016/s0092-8674(00)81865-6. [DOI] [PubMed] [Google Scholar]
- Jung RT, Shetty PS, James WP, Barrand MA, Callingham BA. Reduced thermogenesis in obesity. Nature. 1979;279:322–323. doi: 10.1038/279322a0. [DOI] [PubMed] [Google Scholar]
- Juonala M, Magnussen CG, Berenson GS, Venn A, Burns TL, Sabin MA, Srinivasan SR, Daniels SR, Davis PH, Chen W, et al. Childhood adiposity, adult adiposity, and cardiovascular risk factors. N Engl J Med. 2011;365:1876–1885. doi: 10.1056/NEJMoa1010112. [DOI] [PubMed] [Google Scholar]
- Kazak L, Chouchani ET, Jedrychowski MP, Erickson BK, Shinoda K, Cohen P, Vetrivelan R, Lu GZ, Laznik-Bogoslavski D, Hasenfuss SC, et al. A creatine-driven substrate cycle enhances energy expenditure and thermogenesis in beige fat. Cell. 2015;163:643–655. doi: 10.1016/j.cell.2015.09.035. [DOI] [PMC free article] [PubMed] [Google Scholar]
- Khandekar MJ, Cohen P, Spiegelman BM. Molecular mechanisms of cancer development in obesity. Nat Rev Cancer. 2011;11:886–895. doi: 10.1038/nrc3174. [DOI] [PubMed] [Google Scholar]
- Krude H, Biebermann H, Luck W, Horn R, Brabant G, Gruters A. Severe early-onset obesity, adrenal insufficiency and red hair pigmentation caused by POMC mutations in humans. Nat Genet. 1998;19:155–157. doi: 10.1038/509. [DOI] [PubMed] [Google Scholar]
- Lee GH, Proenca R, Montez JM, Carroll KM, Darvishzadeh JG, Lee JI, Friedman JM. Abnormal splicing of the leptin receptor in diabetic mice. Nature. 1996;379:632–635. doi: 10.1038/379632a0. [DOI] [PubMed] [Google Scholar]
- Leibel RL, Hirsch J. Diminished energy requirements in reduced-obese patients. Metabolism. 1984;33:164–170. doi: 10.1016/0026-0495(84)90130-6. [DOI] [PubMed] [Google Scholar]
- Leibel RL, Rosenbaum M, Hirsch J. Changes in energy expenditure resulting from altered body weight. N Engl J Med. 1995;332:621–628. doi: 10.1056/NEJM199503093321001. [DOI] [PubMed] [Google Scholar]
- Levine JA, Eberhardt NL, Jensen MD. Role of nonexercise activity thermogenesis in resistance to fat gain in humans. Science. 1999;283:212–214. doi: 10.1126/science.283.5399.212. [DOI] [PubMed] [Google Scholar]
- Li W, Vogel CF, Matsumura F. Studies on the cell treatment conditions to elicit lipolytic responses from 3T3-L1 adipocytes to TCDD, 2,3,7,8-tetrachlorodibenzo-p-dioxin. J Cell Biochem. 2007;102:389–402. doi: 10.1002/jcb.21303. [DOI] [PubMed] [Google Scholar]
- Liu X, Rossmeisl M, McClaine J, Riachi M, Harper ME, Kozak LP. Paradoxical resistance to diet-induced obesity in UCP1-deficient mice. J Clin Invest. 2003;111:399–407. doi: 10.1172/JCI15737. [DOI] [PMC free article] [PubMed] [Google Scholar]
- Lowell BB, Spiegelman BM. Towards a molecular understanding of adaptive thermogenesis. Nature. 2000;404:652–660. doi: 10.1038/35007527. [DOI] [PubMed] [Google Scholar]
- Meyer CW, Willershauser M, Jastroch M, Rourke BC, Fromme T, Oelkrug R, Heldmaier G, Klingenspor M. Adaptive thermogenesis and thermal conductance in wild-type and UCP1-KO mice. Am J Physiol Regul Integr Comp Physiol. 2010;299:R1396–1406. doi: 10.1152/ajpregu.00021.2009. [DOI] [PMC free article] [PubMed] [Google Scholar]
- Miller DS, Parsonage S. Resistance to slimming: adaptation or illusion? Lancet. 1975;1:773–775. doi: 10.1016/s0140-6736(75)92437-x. [DOI] [PubMed] [Google Scholar]
- Mottillo EP, Balasubramanian P, Lee YH, Weng C, Kershaw EE, Granneman JG. Coupling of lipolysis and de novo lipogenesis in brown, beige, and white adipose tissues during chronic beta3-adrenergic receptor activation. J Lipid Res. 2014;55:2276–2286. doi: 10.1194/jlr.M050005. [DOI] [PMC free article] [PubMed] [Google Scholar]
- Muller S, Balaz M, Stefanicka P, Varga L, Amri EZ, Ukropec J, Wollscheid B, Wolfrum C. Proteomic Analysis of Human Brown Adipose Tissue Reveals Utilization of Coupled and Uncoupled Energy Expenditure Pathways. Sci Rep. 2016;6:30030. doi: 10.1038/srep30030. [DOI] [PMC free article] [PubMed] [Google Scholar]
- Ravussin E, Lillioja S, Knowler WC, Christin L, Freymond D, Abbott WG, Boyce V, Howard BV, Bogardus C. Reduced rate of energy expenditure as a risk factor for body-weight gain. N Engl J Med. 1988;318:467–472. doi: 10.1056/NEJM198802253180802. [DOI] [PubMed] [Google Scholar]
- Roh HC, Tsai LT, Lyubetskaya A, Tenen D, Kumari M, Rosen ED. Simultaneous Transcriptional and Epigenomic Profiling from Specific Cell Types within Heterogeneous Tissues In Vivo. Cell Rep. 2017;18:1048–1061. doi: 10.1016/j.celrep.2016.12.087. [DOI] [PMC free article] [PubMed] [Google Scholar]
- Rosen ED, Spiegelman BM. What we talk about when we talk about fat. Cell. 2014;156:20–44. doi: 10.1016/j.cell.2013.12.012. [DOI] [PMC free article] [PubMed] [Google Scholar]
- Rosenbaum M, Hirsch J, Gallagher DA, Leibel RL. Long-term persistence of adaptive thermogenesis in subjects who have maintained a reduced body weight. Am J Clin Nutr. 2008;88:906–912. doi: 10.1093/ajcn/88.4.906. [DOI] [PubMed] [Google Scholar]
- Rosenbaum M, Kissileff HR, Mayer LE, Hirsch J, Leibel RL. Energy intake in weight-reduced humans. Brain Res. 2010;1350:95–102. doi: 10.1016/j.brainres.2010.05.062. [DOI] [PMC free article] [PubMed] [Google Scholar]
- Rothwell NJ, Stock MJ. A role for brown adipose tissue in diet-induced thermogenesis. Nature. 1979;281:31–35. doi: 10.1002/j.1550-8528.1997.tb00591.x. [DOI] [PubMed] [Google Scholar]
- Rowland LA, Maurya SK, Bal NC, Kozak L, Periasamy M. Sarcolipin and uncoupling protein 1 play distinct roles in diet-induced thermogenesis and do not compensate for one another. Obesity (Silver Spring) 2016;24:1430–1433. doi: 10.1002/oby.21542. [DOI] [PMC free article] [PubMed] [Google Scholar]
- Seefeld MD, Corbett SW, Keesey RE, Peterson RE. Characterization of the wasting syndrome in rats treated with 2,3,7,8-tetrachlorodibenzo-p-dioxin. Toxicol Appl Pharmacol. 1984;73:311–322. doi: 10.1016/0041-008x(84)90337-5. [DOI] [PubMed] [Google Scholar]
- Sorenson RL, Stout LE, Brelje TC, Van Pilsum JF, McGuire DM. Evidence for the role of pancreatic acinar cells in the production of ornithine and guanidinoacetic acid by L-arginine:glycine amidinotransferase. Pancreas. 1995;10:389–394. doi: 10.1097/00006676-199505000-00011. [DOI] [PubMed] [Google Scholar]
- Speakman JR, Krol E, Johnson MS. The functional significance of individual variation in basal metabolic rate. Physiol Biochem Zool. 2004;77:900–915. doi: 10.1086/427059. [DOI] [PubMed] [Google Scholar]
- Svensson PA, Jernas M, Sjoholm K, Hoffmann JM, Nilsson BE, Hansson M, Carlsson LM. Gene expression in human brown adipose tissue. Int J Mol Med. 2011;27:227–232. doi: 10.3892/ijmm.2010.566. [DOI] [PubMed] [Google Scholar]
- Thomas SA, Palmiter RD. Thermoregulatory and metabolic phenotypes of mice lacking noradrenaline and adrenaline. Nature. 1997;387:94–97. doi: 10.1038/387094a0. [DOI] [PubMed] [Google Scholar]
- Twig G, Yaniv G, Levine H, Leiba A, Goldberger N, Derazne E, Ben-Ami Shor D, Tzur D, Afek A, Shamiss A, et al. Body-Mass Index in 2.3 Million Adolescents and Cardiovascular Death in Adulthood. N Engl J Med. 2016;374:2430–2440. doi: 10.1056/NEJMoa1503840. [DOI] [PubMed] [Google Scholar]
- Ukropec J, Anunciado RP, Ravussin Y, Hulver MW, Kozak LP. UCP1-independent thermogenesis in white adipose tissue of cold-acclimated Ucp1−/− mice. J Biol Chem. 2006;281:31894–31908. doi: 10.1074/jbc.M606114200. [DOI] [PubMed] [Google Scholar]
- Wakatsuki T, Hirata F, Ohno H, Yamamoto M, Sato Y, Ohira Y. Thermogenic responses to high-energy phosphate contents and/or hindlimb suspension in rats. Jpn J Physiol. 1996;46:171–175. doi: 10.2170/jjphysiol.46.171. [DOI] [PubMed] [Google Scholar]
- Yamashita H, Ohira Y, Wakatsuki T, Yamamoto M, Kizaki T, Oh-ishi S, Ohno H. Increased growth of brown adipose tissue but its reduced thermogenic activity in creatine-depleted rats fed beta-guanidinopropionic acid. Biochim Biophys Acta. 1995;1230:69–73. doi: 10.1016/0005-2728(95)00067-s. [DOI] [PubMed] [Google Scholar]
- Zhang Y, Proenca R, Maffei M, Barone M, Leopold L, Friedman JM. Positional cloning of the mouse obese gene and its human homologue. Nature. 1994;372:425–432. doi: 10.1038/372425a0. [DOI] [PubMed] [Google Scholar]
Associated Data
This section collects any data citations, data availability statements, or supplementary materials included in this article.