

Abstract
Scope
UV exposure is a risk factor for keratinocyte carcinoma (KC) while critical for endogenous vitamin D production. We investigated dietary modulation of skin and serum 25-hydroxyvitamin D3 (25OHD3) and its C-3 epimer (C3epi) in a mouse model of KC. C3epi is an under-investigated metabolite of vitamin D with respect to its biological implications.
Methods and Results
Male and female Skh-1 mice were supplemented with 25, 150 or 1000 IU/kg diet vitamin D3 for 25 weeks, with some exposed to UV light. Skin and serum vitamin D metabolites were quantitated using HPLC-MS/MS (n=3 per dose/sex/UV treatment). Serum and skin 25OHD3 and C3epi significantly increased with dose (P<0.0001), but with different response patterns. UV exposure significantly attenuated serum, but not skin, levels of both metabolites (P<0.001, P=0.0287), while up-regulating expression of renal Cyp24a1 (P<0.01). A dose by sex interaction trended towards significance with serum and skin levels of C3epi, wherein male mice attained higher levels of C3epi with higher dietary vitamin D3. This reflected a similar, but non-significant pattern in average tumor size.
Conclusion
The complex relationship between vitamin D and KC requires further investigation. This study provides insight into modulation of local and systemic vitamin D status with dietary supplementation.
Keywords: Keratinocyte carcinoma, Vitamin D, 3-epi-25-hydroxyvitamin D, Skin cancer
Introduction
The most prevalent type of cancer in the United States is keratinocyte cancer (KC), with approximately 3.3 million people diagnosed each year [1]. Although this disease is not particularly deadly, the cost incurred through treatment of the disease is a severe burden for those affected [2]. Two important determinants of KC risk include ultraviolet B light (UV-B) exposure and biological sex. Exposure to UV-B light induces an inflammatory response in keratinocytes, which results in downstream DNA damage. The incidence of KC is approximately twice as high in men compared to women. The underlying factors for this difference are still unknown, but differences in susceptibility to DNA damage and hormonal signaling may play a role [3].
Vitamin D is a unique nutrient in that it can be obtained through the diet, or produced endogenously in the skin via UV-B exposure. The role of vitamin D in bone health is well established, but recent research has implicated vitamin D in a number of extraskeletal diseases including some cancers [4]. The relationship between vitamin D status and KC is difficult to assess because UV-B exposure is an important determinant of both vitamin D status and KC risk. This is clearly reflected in the contradictory results of different epidemiological studies which have investigated this relationship [5–9].
In vitro studies suggest that the activated form of vitamin D (1,25-dihydroxy-vitamin D) has pro-differentiating and anti-proliferating activities in healthy keratinocytes, while transformed keratinocytes lose sensitivity to the pro-differentiation activity [10]. Interestingly, skin is not only the site of vitamin D synthesis, but also a site of vitamin D metabolism. Healthy and transformed keratinocytes express genes encoding key cellular machinery for the activation and degradation of vitamin D, as well as the vitamin D receptor [10, 11]. The local metabolism and activation of vitamin D in target tissues is thought to be a key mediator in its proposed extraskeletal functions [12]. Due to the importance of localized vitamin D metabolism, interest in tissue-specific vitamin D metabolite levels is growing.
The best marker of vitamin D status is 25-hyroxyvitamin D (25OHD), as it has a long half-life, circulates at detectable levels, and correlates well with intake and synthesis of vitamin D [13]. Recently, interest has grown in the measurement of other vitamin D metabolites, including the C-3 epimer of 25OHD (C3epi), Figure 1. When activated, this stereoisomer elicits muted biological responses compared to activated 25OHD [14]. Due to this and its structural similarity to 25OHD, C3epi has been identified as a possible source of inflation and therefore error in status measurement [15, 16]. As interest in the relationship between vitamin D status and disease rises, few studies have attempted to investigate the possible role of C3epi in disease.
Figure 1.
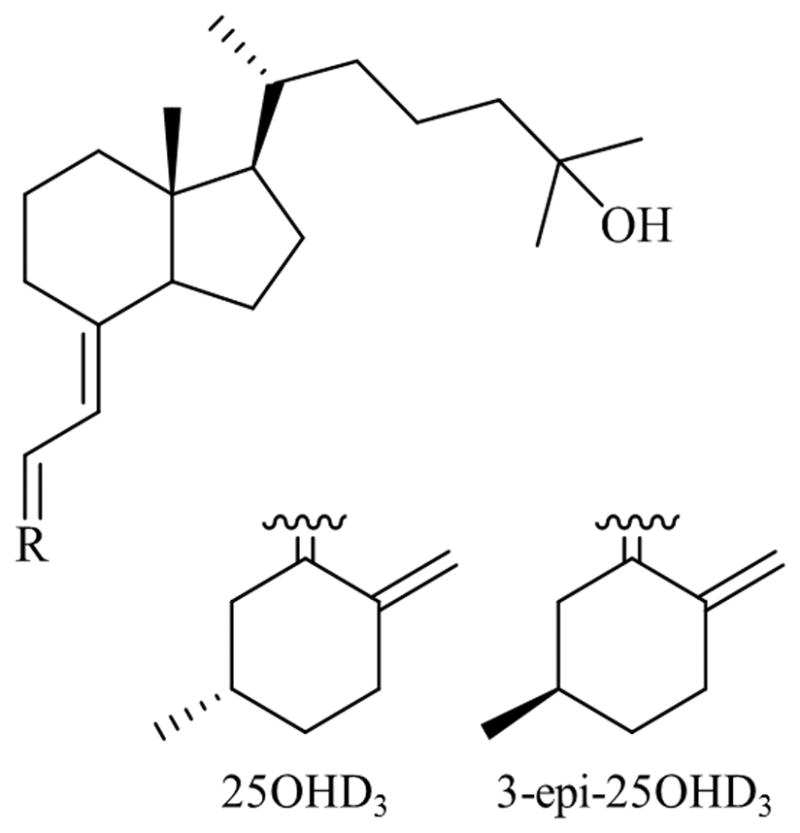
Structures of 25OHD3 and C3epi.
The Skh-1 mouse is an outbred, hairless, and immunocompetent model of KC that has been well characterized [17]. We have recently published findings from a study in which male Skh-1 mice were fed escalating doses of vitamin D3 and chronically exposed to UV-B light. The results suggested that the proliferation of skin tumors in male mice may be enhanced by dietary vitamin D3 [18]. This prompted us to investigate how dietary supplementation of vitamin D3 alters the vitamin D status of skin and serum of the mice from this study. Additionally, we were interested in exploring the effects of key KC risk factors, UV-B exposure and sex, in this model. Thus, the objective of this work was to measure 25OHD3 and C3epi in the skin and serum of Skh-1 mice over multiple levels of dietary Vitamin D3 to provide further insight into the previously discovered relationships between dietary vitamin D and KC.
Methods
Animal Treatment
The details regarding the animals from this study have been described previously [18]. Briefly, Skh-1 hairless mice (Charles River Laboratories; Wilmington, MA) were housed in a vivarium at The Ohio State University in accordance with the requirements established by the American Association for Accreditation of Laboratory Animal Care. Procedures were approved by the appropriate Institutional Animal Care Utilization Committee (2010A00000083). Four week old mice were housed five per cage and fed standard AIN93G diet (1000 IU vitamin D3/kg) or the diet modified to contain 25 IU/kg or 150 IU/kg. These levels were chosen to achieve serum 25OHD3 levels reflective of varying physiological significance [19]. A total of 25 male and 25 female mice were fed each diet for a total of 150 mice. Fifteen males and fifteen females from each diet group were exposed dorsally to one minimal erythemic dose of UVB (2240 J/m2) three times weekly for 25 weeks. All animals were sacrificed by CO2 inhalation. Digital calipers were used to measure tumors present on the dorsal skin measuring greater than 1 mm in size (length x width). Serum, skin, tumors and kidneys were harvested and stored at −80 °C until further analysis.
Chemicals
Optima grade water, acetonitrile, methanol, hexane, HPLC grade dichloromethane, and 99% formic acid were obtained from Fisher Scientific (Pittsburgh, PA). 25OHD3 was obtained from Isosciences (King of Prussia, PA) and d3-25OHD3, C3epi, and 4-phenyl-1,2,4-triazoline-3,5-dione (PTAD) were obtained from Sigma Aldrich (St. Louis, MO).
Sample preparation for metabolite analysis
Three mice from each diet/sex/UV treatment group were randomly selected for measurement of vitamin D metabolite levels in serum and skin. Vitamin D metabolites were extracted and derivatized with PTAD according to Teegarden and colleagues [20]. PTAD derivatization was used to improve detection and quantification thresholds of the metabolites [21].
Quantification of Metabolites
Derivatized 25OHD3 and C3epi were quantified using isotope dilution HPLC-MS/MS as described previously [20] with slight modification. In brief, skin extracts were reconstituted in 100 μL of acetonitrile and centrifuged at 21,130 x g for 2 min. Serum extracts were solubilized in 200 μL acetonitrile and filtered with 0.22 μm, 4 mm nylon filters (W.R. Grace; Deerfield, IL) before injection (10 μL) onto the HPLC–MS/MS system (QTRAP 5500; AB Sciex; Framingham, MA). Metabolites from skin and serum were separated on Luna C18 columns (4.6 mm x 250 mm; Phenomenex) with 5 μm and 3μm sized particles, respectively.
Quantification of Cyp24a1 expression
Unless otherwise noted, all reagents were purchased from Fisher Scientific. Skin and kidneys from all mice on the study were processed for Cyp24a1 expression analysis. Tissues were ground to a powder using a mortar and pestle and RNA was extracted using TRIzol according to the manufacturer’s instructions. RNA samples (2 μg/10 μl) were heated for 5 min at 60 °C, after which cDNA was reverse transcribed using a mixture containing 1X PCR Buffer II, 5 mM MgCl2, 1 mM dNTPs, 2.5 μM Oligo dTs (Midland Certified Reagent Co., Midland, TX), 1 unit RNAseOUT, and 100 units MMLV-RT for 60 min at 37 °C, followed by 5 min at 95 °C. Amplification of Cyp24a1and β-actin was carried out with 2.5 μL cDNA in a total volume of 25 μL containing a final concentration of 1X PCR buffer, 2.5mM MgCl2, 1mM dNTPs, 0.2 μM forward and reverse primers, and 0.25 units of Platinum Taq. The primers used for Cyp24a1 were, forward: 5′ – ACACACTGGCAGAGTACCACAAAGAA, reverse: 5′ – AATCAGCCAAGACCTCATT. The primers used for β-actin were forward: 5′ – GTGGGCCGCTCTAGGCACCAA, reverse: 5′ – CTCTTTGATGTCACGCACGATTTC Samples were incubated at 95 °C for 30 sec followed by 31 (Cyp24a1) or 28 (β-actin) cycles of 95 °C for 15 sec, 70 °C for 30 sec, 72 °C for 30 sec, followed by a 7 min final extension at 72 °C. Samples were electrophoresed through 1.2% agarose, photographed, and band intensity was determined using Image J software. Cyp24a1 expression was normalized to β-actin. Samples in which β-actin was undetectable were not included in the calculation of average expression values (analysis total n=96).
Statistics
Data was processed using SAS 9.4 (SAS Institute Inc.; Cary, NC). For each metabolite, the GLM procedure was used to fit ANOVA models including terms for vitamin D3 dose, sex, UV exposure, and the interactions of dose with sex or UV exposure (α = 0.05). Gene expression data was analyzed similarly to vitamin D metabolite levels using an ANOVA model including dose, UV exposure, sex, and the interaction of dose with sex. Correlations were calculated using the correlation function with Pearson’s coefficients. Equality of correlation coefficients was assessed using Fisher’s z transformation. Results are expressed as the mean ± SE, and terms from the statistical model are separately presented to facilitate interpretation.
Results
Dietary Vitamin D3 Raised 25OHD3 and C3epi Levels in Skin and Serum
Without accounting for sex or UV exposure, average serum levels of 25OHD3 and C3epi at each dose ranged from 9.63–25.05 nmol/L and 1.08–7.26 nmol/L, respectively (Figure 2A). Both metabolites increased with dietary supplementation (P<0.0001). While 25OHD3 levels increased significantly across all doses, C3epi levels only increased significantly at the highest dose of 1000 IU/kg diet. Compared to serum, the levels of vitamin D metabolites were approximately three orders of magnitude lower in skin (nmol vs. pmol levels) with average 25OHD3 and C3epi levels ranging from 3.42–9.24 pmol/g and 1.07–2.28 pmol/g, respectively, as shown in Figure 2B. Similar to serum levels, the skin metabolites were found to increase with dosage levels (P<0.0001).
Figure 2.

Dietary supplementation with vitamin D3 significantly (P<0.0001 for all) raised 25OHD3 and C3epi levels in serum (A) and skin (B), regardless of sex or UV exposure. Different letters indicate significant differences, n=12 per dietary level (including 3 mice from each sex/UV exposure, per dietary level).
Chronic UV Exposure attenuated Metabolite Levels in Serum
A significant effect of UV exposure was noted in serum 25OHD3 (P=0.0006), and a significant interaction between dose and UV exposure was additionally observed for serum C3epi levels (P=0.0287), as seen in Figure 3A and B. Contrary to what was expected, the mice exposed to UVB light tended to have lower serum levels of 25OHD3 than those left unexposed, and exposure appeared to attenuate C3epi serum response at higher doses. No significant effects of UV exposure were observed in skin (Figure 3C and D).
Figure 3.

Effects of UV exposure on vitamin D3 metabolite levels at each dietary supplementation level, regardless of sex. There was no significant dose by UV exposure interaction, but there was a significant effect of UV exposure on serum 25OHD3 levels (A) (P<0.001; n=18 per UV exposure group including 3 male and 3 female mice at each dietary level). There was a dose by UV interaction for serum C3epi levels (B) (P=0.0287; n=6, including 3 male and female per UV/dose group). No significant effects of either UV exposure by dose or UV exposure alone were detected for skin 25OHD3 (C) or C3epi (D) levels (n=6 per UV/dose group or n=18 per UV group).
Expression of Renal Cyp24a1is Elevated in mice exposed to UV-B light
Due to the unanticipated effect of UV exposure on serum metabolite levels, relative levels of Cyp24a1 gene expression in the kidneys were examined. The data were natural log transformed prior to statistical analysis to better approximate a normal distribution. Regardless of sex or dose, UV exposure significantly elevated expression of this enzyme (P<0.01, Figure 4). Levels were also elevated in mice supplemented with 1000 IU when compared to those supplemented with 25 IU, regardless of sex or UV exposure (P=0.036, Figure 4). No effect of sex (P=0.799) or sex by dose interaction (P=0.656) was detected (data not shown). Cyp24a1 expression levels were also evaluated in the skin, but were below detectible levels for this assay (data not shown).
Figure 4.

Expression of Cyp24a1 in kidney. UV exposure significantly upregulated expression (No UV, n=39; UV, n=57; including males and females at all doses). A significant effect of dose was also observed (25IU, n=13 no UV & 20 UV; 150IU, n=13 no UV & 17 UV; 1000IU, n=13 no UV & 20 UV).
Sex-dependent patterns in metabolite levels and tumor data
A dose by sex interaction on serum and skin C3epi levels trended towards significance (P=0.0562 and 0.0510, respectively) as shown in Figure 5B and D. No interactions between sex and 25OHD3 levels were detected in skin or serum (P=0.5507 and 0.5237, respectively, figure 5A and C). Tumor results on the male mice from this study have been previously reported [18], but here we report the complete result set from both male and female mice. Similar to C3epi levels, a non-significant (P=0.168) interaction of sex by vitamin D3 dose was seen in the average tumor sizes of all UV-exposed mice on study, in which the male mice tended to develop larger tumors at the highest dose of vitamin D3 (Figure 5E).
Figure 5.

Effects of mouse sex on vitamin D3 metabolite levels with respect to dietary supplementation levels. To look at the effect of sex and dietary vitamin D3 dose on metabolite levels in skin and serum, metabolite data for both UV groups was combined. Dose by sex interactions trended towards significance for C3epi levels in serum (B) (P=0.0562; n=6 including 3 no UV and 3 UV mice) and skin (D) (P=0.0510; n=6 including 3 no UV and 3 UV mice). No significant effects of mouse sex were detected for 25OHD3 levels in serum (A) or skin (C) (n=6 per sex/dose group or n=18 per sex group).
Relationships between Metabolite Levels in Skin and Serum
Skin is a difficult and labor-intensive matrix to sample compared to serum, thus we were interested in the correlations of each metabolite between blood and serum. Serum levels were significantly correlated with skin levels of each metabolite with Pearson correlation coefficients of 0.731 and 0.897 for 25OHD3 and C3epi, respectively (P<0.0001; Figure 6). Correlations within the UV/no UV and male/female groups were also compared, since both factors significantly influenced the metabolite levels in skin and/or serum. No significant differences were detected between correlation coefficients when the data was parsed this way (UV vs No UV P=0.42; male vs female P=0.16).
Figure 6.

Correlations between skin and serum 25OHD3 (A) and C3epi (B). Coefficients in figure were calculated across all samples (n=36). No significant differences were detected between coefficients calculated according to UV exposure or sex (n=18 per group).
Discussion
In the present work we have described levels of two vitamin D3 metabolites in the serum and, for the first time, in the skin of Skh-1 mice fed escalating doses of vitamin D3. The HPLC-MS/MS method used to measure metabolite levels achieved near complete separation of 25OHD3 from its C-3 epimer, a source of false positive bias in the measurement of 25OHD3 [22]. This not only allows for a more accurate measurement of vitamin D status in serum and tissues, but also for quantification of C3epi, a relatively understudied metabolite of vitamin D. The serum levels of 25OHD3 followed a characteristic curvilinear pattern previously demonstrated in rats [19]. Notably, the supplementation curve for skin 25OHD3 levels also followed this pattern. To our knowledge, our group is the first to report C3epi levels in the serum and skin of mice as a response to multiple levels of dietary vitamin D3 supplementation. Like 25OHD3, the dose-response patterns of C3epi were nearly identical between serum and skin, however the pattern was not curvilinear. In stark contrast to 25OHD3, C3epi levels were most affected by the highest dose of vitamin D3 and followed what appeared to be more of a linear pattern.
Few other studies exist for comparison of the tissue metabolite levels described here, but they seem reasonable with respect to values found in other species and tissues. Höller and colleagues reported approximately 100 pmol/g 25OH D3 in the skin of pigs fed 2000 IU vitamin D3/kg diet [23]. The liver, muscle, and fat tissue of rats fed 740 IU vitamin D3/kg diet analyzed by Lipkie and colleagues all contained approximately 1.25 pmol/g tissue [24]. Dose-dependent increases in tissue 25OHD3 levels were also demonstrated in Lipkie’s study, but this increase was only shown over two doses. Some epidemiological investigations into C3epi in human populations have been performed, with wide-ranging levels reported [14]. A few of these have ventured to identify factors that affect levels of serum C3epi, which include those typically associated with increased serum 25OHD3 levels such as supplementation with vitamin D3 and increased sun exposure [25, 26].
In the current study, we observed a significant decrease in serum levels of both 25OHD3 and C3epi with chronic UV exposure (3 times weekly) equivalent to one minimal erythemic dose, or a light sunburn. This coincided with a significant UV-mediated upregulation of renal Cyp24a1, the primary enzyme responsible for degradation of vitamin D metabolites via 24-hydroxylation [27]. While many cell types express Cyp24a1, the activity of this enzyme is highest in the kidney. This enzyme is typically upregulated with production of the active vitamin D metabolite 1,25(OH)2-vitamin D as part of a self-regulating feedback mechanism, but 25OHD3 is also a substrate for the enzyme [28]. A similar phenomenon of increased 25OHD3 clearance with UV exposure has been observed previously in sheep [29]. Chronic exposure to UV light has also been shown to increase gross hepatic cytochrome P450 content in mice [30], and Cyp24a1 is a cytochrome P450 protein. Additionally, Binkley et al. found that high UV exposure may not guarantee elevated vitamin D status in humans, citing genetic elements or enhanced cutaneous destruction of vitamin D as possible explanations [31]. The lack of a UV effect on vitamin D metabolite levels in the skin may be explained by the non-detectable expression of Cyp24a1.
We additionally noted that, trending towards statistical significance, the male mice had higher levels of C3epi in serum (P=0.0562) and skin (P=0.0510) as compared to female mice at the highest dose of vitamin D3. This result is particularly interesting in the context of the cancer outcomes of this study, however this relationship requires further investigation. Sex differences in skin structure and KC etiology in this mouse model have been previously documented [17, 32]. Epidemiological studies investigating determinants of serum C3epi levels found no evidence of sex effects in humans [25, 26], but whether this null effect is observed in skin or pre-clinical models has not been previously investigated.
Overall health implications of elevated C3epi levels are not well understood. C3-epimerization of vitamin D metabolites is thought to occur via a largely uncharacterized metabolic pathway specifically expressed in several cell types, including keratinocytes [33]. Just as 25OHD3 is metabolized by Cyp27b1 to the active vitamin D metabolite 1,25-dihydroxyvitamin D3 (1,25(OH)2D3), C3epi can also be activated to form a C-3 epimer of 1,25(OH)2D3 [34]. This activated 1,25(OH)2-3-epi-D3 binds to the vitamin D receptor with less affinity than that of 1,25(OH)2D3, but it may elicit nearly equipotent biological responses at high levels in the tissues expressing the C-3 epimerization pathway [35]. In other tissues, 1,25(OH)2-3-epi-D3 elicits a muted biological response, and thus could potentially act as a competitive inhibitor of native 1,25(OH)2D3 action [14]. The high correlation between skin and serum levels of C3epi suggests that the skin may contribute a significant proportion of circulating C3epi in these mice. It also indicates that serum measurement of these metabolites may be used as a proxy for trends in skin metabolite levels in future work. Outside of keratinocytes, rat and human osteosarcoma, human colon adenocarcinoma, porcine kidney cells, and human hepatoblastoma have been shown to express enzymes involved in C3-epimerization pathway to varying extents [34, 36]. If skin is a major contributor to circulating C3epi levels, the sex differences noted in this work have possible implications for other diseases in which vitamin D may play a role.
Here we have described an exploratory investigation that uniquely studied C3epi and 25OHD3 levels in serum and skin from mice fed escalating doses of vitamin D3. Our findings reiterate the importance of ensuring separation of 25OHD3 from C3epi, as both metabolites persist throughout murine and human systems. C3epi would have represented up to 35% (serum) or 30% (skin) of the 25OHD3 measurement if left unresolved in the present study. By separately quantitating C3epi levels, we were able to detect sex-dependent differences in metabolite levels that may have further implications for future research on the role of vitamin D in health. Further work is needed to better understand the complicated relationship between vitamin D and KC, and the present study demonstrates that vitamin D metabolites outside of the status measurement, 25OHD, should be considered.
Acknowledgments
Funding for the analytical portion of this study was supported by the Food Innovation Center at The Ohio State University and executed within the Nutrient and Phytochemical Analytic Shared Resource (NIH P30 CA016058) within the Comprehensive Cancer Center at The Ohio State University (OSUCCC). The execution of the animal study was supported by the Molecular Carcinogenesis and Chemoprevention Program at the OSUCCC.
Footnotes
Author Contributions
K.L.T. and T.M.O. designed the research study; A.C., K.L.T, and T.M.O conducted animal study; M.D.T. conducted serum and tissue analysis; M.D.T., J.L.C., S.J.S. performed statistics, data analysis and interpretation; M.D.T. wrote the manuscript; T.M.O. had primary responsibility for final content. All authors have read and approved the final version of this manuscript.
The authors claim no conflict of interest.
References
- 1.The American Cancer Society. Skin Cancer: Basal and Squamous Cell. 2013. [Google Scholar]
- 2.Chen J, Fleisher A, Smith E, Kancler C, et al. Cost of Nonmelanoma Skin Cancer Treatment in the United States. Dermatologic Surg. 2001;27:1035–1038. doi: 10.1046/j.1524-4725.2001.01004.x. [DOI] [PubMed] [Google Scholar]
- 3.Oberyszyn TM. Non-melanoma skin cancer: importance of gender, immunosuppressive status and vitamin D. Cancer Lett. 2008;261:127–36. doi: 10.1016/j.canlet.2008.01.009. [DOI] [PubMed] [Google Scholar]
- 4.Bikle DD. Vitamin D and cancer: the promise not yet fulfilled. Endocrine. 2014 doi: 10.1007/s12020-013-0146-1. [DOI] [PMC free article] [PubMed] [Google Scholar]
- 5.Tang JY, Parimi N, Wu A, Boscardin WJ, et al. Inverse association between serum 25(OH) vitamin D levels and non-melanoma skin cancer in elderly men. Cancer Causes Control. 2010;21:387–91. doi: 10.1007/s10552-009-9470-4. [DOI] [PMC free article] [PubMed] [Google Scholar]
- 6.Eide MJ, Johnson Da, Jacobsen GR, Krajenta RJ, et al. Vitamin D and nonmelanoma skin cancer in a health maintenance organization cohort. Arch Dermatol. 2011;147:1379–84. doi: 10.1001/archdermatol.2011.231. [DOI] [PubMed] [Google Scholar]
- 7.Hunter DJ, Colditz Ga, Stampfer MJ, Rosner B, et al. Diet and risk of basal cell carcinoma of the skin in a prospective cohort of women. Ann Epidemiol. 1992;2:231–9. doi: 10.1016/1047-2797(92)90055-u. [DOI] [PubMed] [Google Scholar]
- 8.van Dam RM, Huang Z, Giovannucci E, Rimm EB, et al. Diet and basal cell carcinoma of the skin in a prospective cohort of men. Am J Clin Nutr. 2000;71:135–41. doi: 10.1093/ajcn/71.1.135. [DOI] [PubMed] [Google Scholar]
- 9.Asgari MM, Tang J, Warton ME, Chren MM, et al. Association of prediagnostic serum vitamin D levels with the development of basal cell carcinoma. J Invest Dermatol. 2010;130:1438–43. doi: 10.1038/jid.2009.402. [DOI] [PMC free article] [PubMed] [Google Scholar]
- 10.Bikle DD, Oda Y, Xie Z. Vitamin D and skin cancer: a problem in gene regulation. J Steroid Biochem Mol Biol. 2005;97:83–91. doi: 10.1016/j.jsbmb.2005.06.001. [DOI] [PubMed] [Google Scholar]
- 11.Mason RS, Reichrath J. Sunlight vitamin D and skin cancer. Anticancer Agents Med Chem. 2013;13:83–97. [PubMed] [Google Scholar]
- 12.Holick MF. Vitamin D and Health. In: Holick MF, editor. Vitamin D: Physiology, Molecular Biology, and Clinical Applications. 2. Springer Science+Business Media; New York, NY: 2010. pp. 3–34. [Google Scholar]
- 13.Zerwekh JE. Blood biomarkers of vitamin D status. Am J Clin Nutr. 2008;87:1087S–1091S. doi: 10.1093/ajcn/87.4.1087S. [DOI] [PubMed] [Google Scholar]
- 14.Bailey D, Veljkovic K, Yazdanpanah M, Adeli K. Analytical measurement and clinical relevance of vitamin D3 C3-epimer. Clin Biochem. 2013;46:190–196. doi: 10.1016/j.clinbiochem.2012.10.037. [DOI] [PubMed] [Google Scholar]
- 15.Singh RJ, Taylor RL, Reddy GS, Grebe SKG. C-3 epimers can account for a significant proportion of total circulating 25-hydroxyvitamin D in infants, complicating accurate measurement and interpretation of vitamin D status. J Clin Endocrinol Metab. 2006;91:3055–61. doi: 10.1210/jc.2006-0710. [DOI] [PubMed] [Google Scholar]
- 16.Lensmeyer G, Poquette M, Wiebe D, Binkley N. The C-3 epimer of 25-hydroxyvitamin D(3) is present in adult serum. J Clin Endocrinol Metab. 2012;97:163–68. doi: 10.1210/jc.2011-0584. [DOI] [PubMed] [Google Scholar]
- 17.Benavides F, Oberyszyn TM, VanBuskirk AM, Reeve VE, et al. The hairless mouse in skin research. J Dermatol Sci. 2009;53:10–8. doi: 10.1016/j.jdermsci.2008.08.012. [DOI] [PMC free article] [PubMed] [Google Scholar]
- 18.Hill NT, Gracia-Maldonado GH, Leonard MK, Harper AR, et al. Role of vitamin D3 in modulation of ΔNp63α expression during UVB induced tumor formation in SKH-1 mice. PLoS One. 2014;9:e107052. doi: 10.1371/journal.pone.0107052. [DOI] [PMC free article] [PubMed] [Google Scholar]
- 19.Fleet JC, Gliniak C, Zhang Z, Xue Y, et al. Serum metabolite profiles and target tissue gene expression define the effect of cholecalciferol intake on calcium metabolism in rats and mice. J Nutr. 2008;138:1114–1120. doi: 10.1093/jn/138.6.1114. [DOI] [PMC free article] [PubMed] [Google Scholar]
- 20.Teegarden MD, Riedl KM, Schwartz SJ. Chromatographic separation of PTAD-derivatized 25-hydroxyvitamin D3 and its C-3 epimer from human serum and murine skin. J Chromatogr B. 2015;991:118–121. doi: 10.1016/j.jchromb.2015.04.011. [DOI] [PMC free article] [PubMed] [Google Scholar]
- 21.Higashi TH, Miura KM, Kitahori JK, Shimada KS. Usefulness of Derivatization in High-Performance Liquid Chromatography / Tandem Mass Spectrometry of Conjugated Vitamin D Metabolites. Anal Sci. 1999;15:619–623. [Google Scholar]
- 22.Bedner M, Lippa Ka, Tai SS-C. An assessment of 25-hydroxyvitamin D measurements in comparability studies conducted by the Vitamin D Metabolites Quality Assurance Program. Clin Chim Acta. 2013;426:6–11. doi: 10.1016/j.cca.2013.08.012. [DOI] [PMC free article] [PubMed] [Google Scholar]
- 23.Höller U, Quintana AP, Gössl R, Olszewski K, et al. Rapid determination of 25-hydroxy vitamin D3 in swine tissue using an isotope dilution HPLC-MS assay. J Chromatogr B Analyt Technol Biomed Life Sci. 2010;878:963–8. doi: 10.1016/j.jchromb.2010.02.026. [DOI] [PubMed] [Google Scholar]
- 24.Lipkie TE, Janasch A, Cooper BR, Hohman EE, et al. Quantification of vitamin D and 25-hydroxyvitamin D in soft tissues by liquid chromatography-tandem mass spectrometry. J Chromatogr B. 2013;932:6–11. doi: 10.1016/j.jchromb.2013.05.029. [DOI] [PMC free article] [PubMed] [Google Scholar]
- 25.Cashman KD, Kinsella M, Walton J, Flynn A, et al. The 3 Epimer of 25-Hydroxycholecalciferol Is Present in the Circulation of the Majority of Adults in a Nationally Representative Sample and Has Endogenous Origins. J Nutr. 2014;25:1–8. doi: 10.3945/jn.114.192419. [DOI] [PMC free article] [PubMed] [Google Scholar]
- 26.Engelman C, Bo R, MZ, Steltenpohl H, et al. Epidemiologic study of the C-3 epimer of 25-hydroxyvitamin D3 in a population-based sample. Clin Nutr. 2014;33:421–425. doi: 10.1016/j.clnu.2013.06.005. [DOI] [PMC free article] [PubMed] [Google Scholar]
- 27.Deluca HF. History of the discovery of vitamin D and its active metabolites. Bonekey Rep. 2014;3:479. doi: 10.1038/bonekey.2013.213. [DOI] [PMC free article] [PubMed] [Google Scholar]
- 28.Omdahl JL, Morris Ha, May BK. Hydroxylase enzymes of the vitamin D pathway: expression, function, and regulation. Annu Rev Nutr. 2002;22:139–66. doi: 10.1146/annurev.nutr.22.120501.150216. [DOI] [PubMed] [Google Scholar]
- 29.Hidiroglou M. Kinetics of Intravenously Administered 25-Hydroxyvitamin D3 in Sheep and the Effect of Exposure to Ultraviolet Radiation. J Anim Sci. 1987;65:808–814. doi: 10.2527/jas1987.653808x. [DOI] [PubMed] [Google Scholar]
- 30.Goerz G, Merk H, Bolsen K, Tsambaos D, et al. Influence of chronic UV-light exposure on heparic and cutaneous monooxygenases. Experientia. 1983;39:385–386. doi: 10.1007/BF01963137. [DOI] [PubMed] [Google Scholar]
- 31.Binkley N, Novotny R, Krueger D, Kawahara T, et al. Low Vitamin D Status despite. Abundant Sun Exposure. 2014;92:2130–2135. doi: 10.1210/jc.2006-2250. [DOI] [PubMed] [Google Scholar]
- 32.Thomas-Ahner JM, Wulff BC, Tober KL, Kusewitt DF, et al. Gender differences in UVB-induced skin carcinogenesis, inflammation, and DNA damage. Cancer Res. 2007;67:3468–74. doi: 10.1158/0008-5472.CAN-06-3798. [DOI] [PubMed] [Google Scholar]
- 33.Reddy GS, Muralidharan K, Okamura W, Tserng K, et al. Metabolism of 1alpha,25-dihydroxyvitamin D3 and its C-3 epimer 1alpha,25-dihydroxy-3-epi-vitamin D3 in neonatal human keratinocytes. Steroids. 2001;66:441–450. doi: 10.1016/s0039-128x(00)00228-2. [DOI] [PubMed] [Google Scholar]
- 34.Kamao M, Tatematsu S, Hatakeyama S, Sakaki T, et al. C-3 epimerization of vitamin D3 metabolites and further metabolism of C-3 epimers: 25-hydroxyvitamin D3 is metabolized to 3-epi-25-hydroxyvitamin D3 and subsequently metabolized through C-1alpha or C-24 hydroxylation. J Biol Chem. 2004;279:15897–907. doi: 10.1074/jbc.M311473200. [DOI] [PubMed] [Google Scholar]
- 35.Norman AW, Bouillon R, Farach-Carson MC, Bishop JE, et al. Demonstration that 1β,25-dihydroxyvitamin D3 is an antagonist of the nongenomic but not genomic biological responses and biological profile of the three A-ring diastereomers of 1α,25-dihydroxyvitamin D3. J Biol Chem. 1993;268:20022–20030. [PubMed] [Google Scholar]
- 36.Kamao M, Tatematsu S, Sawada N, Sakaki T, et al. Cell specificity and properties of the C-3 epimerization of Vitamin D3 metabolites. J Steroid Biochem Mol Biol. 2004;89–90:39–42. doi: 10.1016/j.jsbmb.2004.03.048. [DOI] [PubMed] [Google Scholar]