Abstract
This work was aimed to develop a chemical sensor for the determination of total polyphenol content (TPC) of coffee samples. The polyphenol sensor was based on co-immobilization of NaIO4 and MBTH in paper as a test strip. The sensor showed sensitive response to chlorogenic acid by forming pink color adduct which can be scanned and quantified by Imagej program. The sensor had response time of 14 min and a linear range between 0.07 and 0.71 mM of chlorogenic acid with a detection limit at 0.002 mM toward chlorogenic acid. The reproducibility of the sensor was good (RSD = 0.44%) with a life time within 27 days when stored at 4 °C. TPC of coffee samples were determined by the sensor, and the results were in agreement with the Folin–Ciocalteu method suggesting its practical use as a tool for TPC determination in coffee samples.
Keywords: Chemical sensor, Colorimetric paper, NaIO4, MBTH, TPC, Coffee
Introduction
Coffee is consumed regularly as beverage by many people and is known as one of the most popular beverages in the world. Coffee is also known for its positive effects on human health based on various studies (Higdon and Frei 2006; Bae et al. 2014). Coffee exhibits various pharmacological effects, such as reducing risk of diabetes and Parkinson’s diseases, and could increase cognition and mood (Ascherio et al. 2001; Tieges et al. 2004; Sartorelli et al. 2010). Polyphenolic compounds found in coffee, mainly chlorogenic acids (CGAs) are known responsible for their health effects and their aromatic properties of coffee (Farah and Donangelo 2006; Santana-Gálvez et al. 2017). Therefore, polyphenol content can be used as quality parameter for coffee samples, and the quantification of its content is important.
Liquid chromatography (namely HPLC) used extensively as standard method for the determination of polyphenol (e.g. CGAs) in coffee samples (Stalmach et al. 2006; Ayelign and Sabally 2013; Wenjing et al. 2014). To improve the selectivity, Liquid Chromatography-Mass Spectrophotometer (LC–MS) method was applied to identify several CGAs in green coffee samples (Perrone et al. 2008). However, these methods are criticized for being tedious, time consuming, and very expensive (Abdullah et al. 2007; Yardim et al. 2013). On the other hand, spectrophotometric (UV–Vis) method was also used for polyphenol determination in coffee samples. For example, CGA can be directly quantified in coffee beverages by measuring the absorbance at 324 nm after caffeine removal by liquid–liquid extraction (Belay and Gholap 2009). CGA content in coffee beverages could also be determined by treating the solution with lead acetate followed by reading absorbance at 325 nm (Upadhyay et al. 2012). In addition, Folin–Ciocalteu (FC) spectrophotometric method was widely employed for the determination of TPC in coffee samples (Hečimović et al. 2011; Ibtisam and Karim 2013). However, FC reagent does not react specifically with phenols only but also with other substances like aromatic amines and sugars (Box 1983) that are present in brewed coffee. Therefore, the development of alternative methods for polyphenol determination which simplify the analysis is needed.
One alternative method is using chemical sensor or biosensor for polyphenol determination, as these technologies can be readily applied for this task and have been applied for apple, tomato, beer, wine, coffee, and tea beverages (ElKaoutit et al. 2008; Fernandes et al. 2009; Santos et al. 2011; Arciuli et al. 2013). Tyrosinase (polyphenol oxidase) is binuclear copper enzyme which can be immobilized on several solid supports to construct a polyphenol biosensor. The enzyme catalyzes the oxidation of o-diphenols to the corresponding o-quinones by consuming molecular oxygen, and may also catalyze orthohydroxylation of monophenols to cathechols and their subsequent oxidation to o-quinones (Muñoz et al. 2006). These o-quinones can be further trapped by a nucleophile reagent i.e. 3-methyl-2-benzothiazolinone hydrazone (MBTH) to generate chromopohore adduct which can be quantified spectrophotometrically (Muñoz et al. 2006; Santagostini et al. 2008). Optical biosensor based on immobilization of tyrosinase and MBTH solutions onto hybrid of nafion/silicate and chitosan films have been developed for the determination of several phenolic compounds (Abdullah et al. 2006). Recently, tyrosinase and MBTH solutions were introduced to the paper platform (Arciuli et al. 2013; Şenyurt et al. 2015), allowing color image acquisition by flatbed scanner and color quantification by colorimetric program which made polyphenol determination simpler, faster, and cheaper.
As tyrosinase suffers from stability and lag time issues in kinetic oxidation of phenolic compounds, sodium periodate (NaIO4) has been used extensively to replace tyrosinase for oxidizing phenolic acids such as CGA and caffeic acid (Fulcrand et al. 1994; Muñoz et al. 2007) and flavonoids such as catechin, epigallocatechin, epicatechin gallate, and epigallocatechin gallate (Jiménez-Atiénzar et al. 2004; Munoz–Munoz et al. 2008). Like tyrosinase, NaIO4 can oxidize the o-diphenols into their related o-diquinones. However, unlike the enzyme, the oxidation of substrates by excess of NaIO4 is instantaneous (Muñoz et al. 2006; Santagostini et al. 2008). Interestingly, NaIO4 was routinely used to determine total CGAs in green and roasted coffee beans, as it was recommended by Clifford three decades ago (Clifford 1979). In addition, it was known that NaIO4 oxidized CGA into its corresponding quinone (CGA-q) in similar way to tyrosinase but with faster reaction time (Muñoz et al. 2007).
This work was aimed to develop a chemical sensor in the form of simple strip test by immobilization of NaIO4 and MBTH solutions onto filter paper for determination of TPC in coffee beverages. The sensor showed sensitive response to CGA by forming pink color adduct which can be scanned by flatbed scanner and quantified by free image processing program, i.e. ImageJ. The optimization of sensor fabrication, its analytical performances, and the use of this tool for determining TPC in various brewed-filtered coffee beverages are discussed. Finally, the TPC values obtained by the developed polyphenol sensor are compared with that of spectrophotometer method (FC), and the association between two methods is also discussed.
Materials and methods
Chemicals
NaIO4 was purchased from BDH-Merck (UK), while MBTH was obtained from Fluka (UK) and CGA was purchased from Aldrich (USA). Phosphate buffer solution (PBS) at pH 7.0 for reagent immobilization was prepared by adjusting amounts of NaCl, KCl, Na2HPO4 and KH2PO4 buffer systems. In all cases, the mixtures were 0.2 M in each constituent. PBS components, FC reagent and Na2CO3 were obtained from Merck (Germany). All chemicals were analytical grade.
Coffee beverages
Dried powder of roasted coffee bean samples (Robusta and Arabica) were purchased from PT. Perkebunan Nusantara X Jember (Indonesia). Coffee beverages were prepared by brewing dried powder of coffee with boiling water at concentration of 1% w/v. The coffee suspension were decanted and filtered through filter paper (pore size 11 µm) to obtain sample solutions. Then, sample solutions were cooled to ambient temperature before polyphenol analysis.
Sensor fabrication
The polyphenol sensor for coffee was developed by immobilizing sensor reagent (NaIO4 and MBTH solutions) onto 0.5 × 0.5 cm2 Whatman filter paper (CAT No.1095.093, Merck UK). The reagent was transferred (4 µL) onto the filter paper and dried for 30 min at ambient temperature to obtain the colorimetric sensor membrane. Afterward, the membrane was stuck gently onto acrylic sheet (3.0 × 0.7 cm, with ±0.1 cm thickness) by cellophane tape to construct polyphenol sensor in the form of strip test. For TPC analysis, sample or standard (CGA) solution is pipetted (4 µL), and dropped onto the sensor membrane.
Optimization of the concentration of sensor reagent
The optimization study of the sensor reagent was done by followed our previous work with slight modification (Hidayat et al. 2016). Here, fresh solution of NaIO4 (1, 2, 4, 6, 8, and 10 mM) and MBTH (6, 12, 24, and 48 mM) in phosphate buffer solution (pH 7.0) were mixed at different volume ratios (1:1; 1:1.5; 1.5:1; 1:2; and 2:1) to achieve the highest color intensity (mean red, green, and blue values) with the fastest color development period (0–30 min) of the sensor membrane. For the optimization study, fresh solution of 0.42 mM CGA was applied (4 µL) to the sensor membrane.
Measurement procedure
After the application of CGA solution to the sensor membrane sensing zone, the color change was captured by image scanned using flatbed scanner (Canoscan, LIDE 110, Japan) at 300 dpi resolution. The scanned images were then analyzed with ImageJ program (https://imagej.nih.gov/ij/). Here, the color intensity values of sensors were given by subtracting the intensity value of mean red, green, and blue (RGB) after the application of sample from the intensity value of mean RGB without the sample (control). All of the experiments were carried out in triplicate.
Statistical analysis
The analyzed TPC of all coffee beverages are compared with the values measured by the standard Folin–Ciocalteu (FC) spectrophotometric method, using paired t test (Amatatongchai et al. 2013). Correlation analysis was used to quantify the association between results obtained using the different methods (Nadifiyine et al. 2013).
Results and discussion
Sensor fabrication
The fabrication of polyphenol sensor in the form of strip test was performed by absorption of the mixture of NaIO4 and MBTH solutions onto filter paper as sensor membrane. As expected, the colorless sensor membrane was changed into pink color just after the application of CGA solution as well as in our previous work (Hidayat et al. 2016). The color change can be typically observed by naked eye. However, for the determination of total phenol content (TPC), the color intensity of sensor membrane must be calculated by measuring their RGB values after testing sample addition.
Sensing scheme
The non-enzymatic oxidation of CGA by NaIO4 followed by coupling reaction of its corresponding quinone (CGA-q) with MBTH is used as the basis for colorimetric detection in the developed polyphenol sensor. This is due to the fact that NaIO4 has been widely used as oxidizing agent for various phenolic acids and flavonoids in the kinetic studies of oxidizing enzymes, such as tyrosinase and peroxidase (Muñoz et al. 2006, 2007). In this regard, CGA was oxidized by NaIO4 to yield CGA-q which then reacted with MBTH to form pink color adduct (CGA-q-MBTH) at the sensor membrane. This finding was conformed to other polyphenol sensors (Abdullah et al. 2006; Arciuli et al. 2013; Hidayat et al. 2016). Since CGA is known as major phenolic acid found in coffee (Farah and Donangelo 2006; Farah et al. 2006), therefore it can be used to represent polyphenol profile in coffee.
Determination of optimum NaIO4 and MBTH concentration
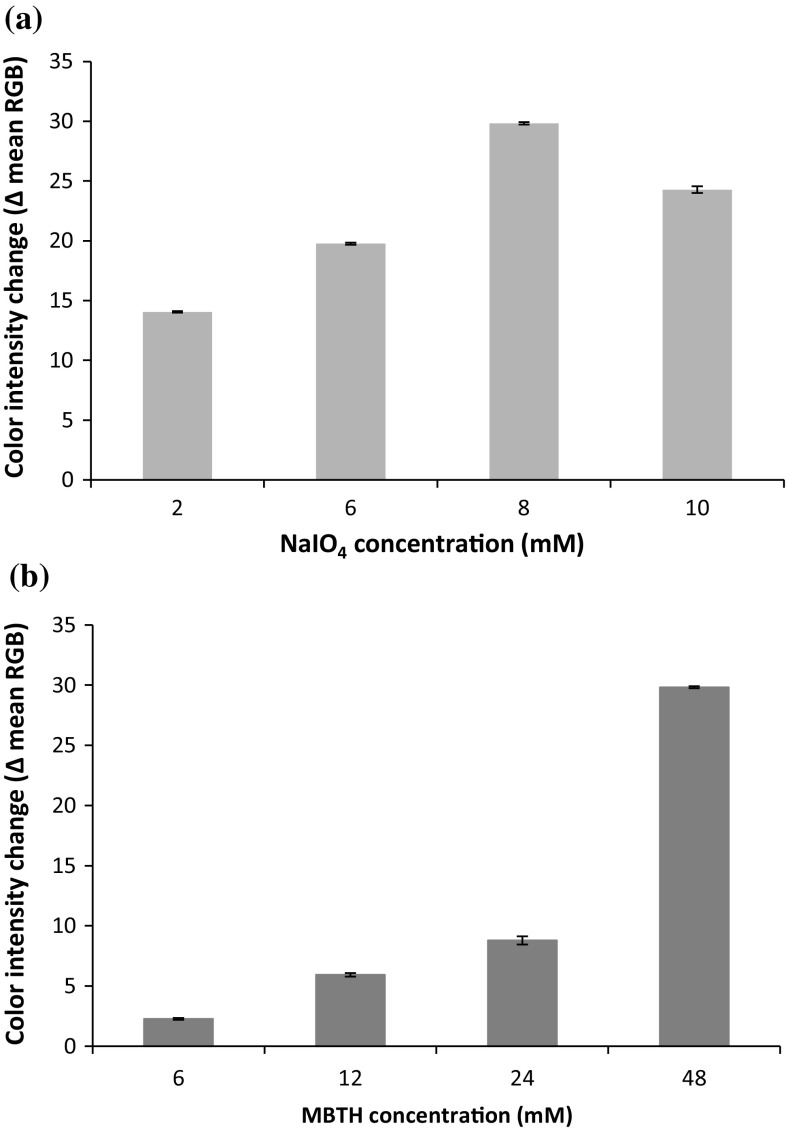
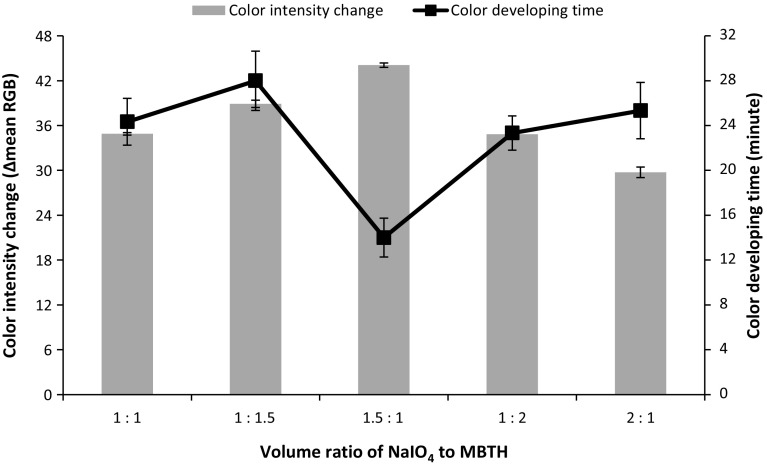
In order to determine the optimum NaIO4 and MBTH concentration for the sensor, several studies were performed to obtain the best parameters (high color intensity and fast response) for the sensor membrane. Firstly, the optimum concentration of NaIO4 was searched by measuring color intensity of sensor by using fixed concentration of MBTH at 48 mM after addition of 0.42 mM CGA. Figure 1a showed that NaIO4 at 8 mM gave the highest intensity among others; hence it was used as the fixed concentration for optimizing the concentration of MBTH. Secondly, the optimum concentration of MBTH was pursued by measuring color intensity change of sensor by using 8 mM NaIO4 with the addition of 0.42 mM CGA. The result revealed that MBTH at 48 mM exhibited the highest color intensity among others, as it can be seen in Fig. 1b. Therefore, mixed solution of 8 mM NaIO4 and 48 mM MBTH is used for the sensor reagent. Lastly, the optimum volume ratio was determined for the sensor reagent, and it was found that volume ratio of NaIO4 and MBTH at 1.5:1 gave the highest color intensity change and fastest color developing period as depicted in Fig. 2.
Fig. 1.
The color intensity change of sensors at various NaIO4 concentrations with fixed concentration of MBTH at 48 mM (a), and various MBTH concentrations with fixed concentration of NaIO4 at 8 mM (b), after addition of 0.42 mM CGA (n = 3)
Fig. 2.
The observed color intensity change and color developing time of sensors at various volume ratios of NaIO4 and MBTH after addition of 0.42 mM CGA (n = 3)
This finding was quiet similar with our previous work (Hidayat et al. 2016). However, in that study catechin solution was used for optimizing the concentration of sensor reagent, and TPC of green tea beverages were calculated as mg/L catechin equivalent (CE). As the different oxidation characteristics among polyphenols were observed in many spectrophotometric studies (Fulcrand et al. 1994; Jiménez-Atiénzar et al. 2004; Muñoz et al. 2007; Munoz–Munoz et al. 2008), the compositions of NaIO4 and MBTH have to be individually examined for each polyphenol to develop colorimetric polyphenol sensor for distinct food or herbal samples.
Response time
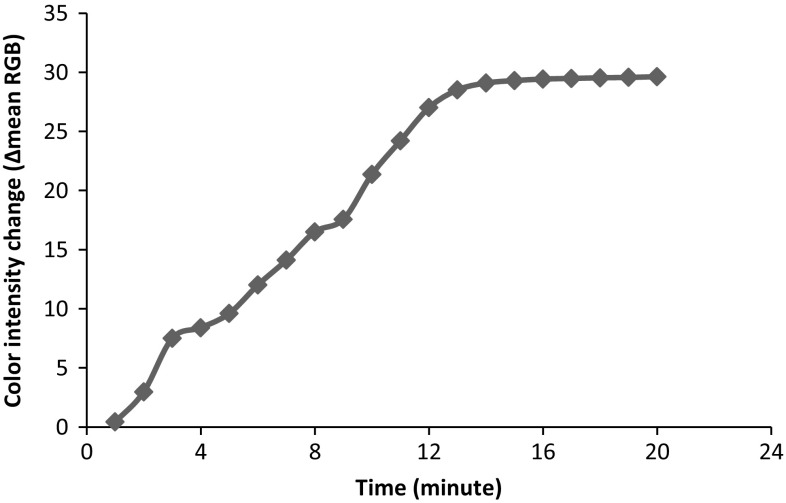
The response time of polyphenol sensor was studied using 0.42 mM of CGA solution. The sensor response was recorded every minute until stable color intensity value was obtained. The response time of sensor stabilized 14 min after addition of CGA solution, as shown in Fig. 3. Therefore, this response time was applied for further measurements.
Fig. 3.
The observed color intensity change of sensor at 0–20 min after addition of 0.42 mM CGA
Polyphenol measurement
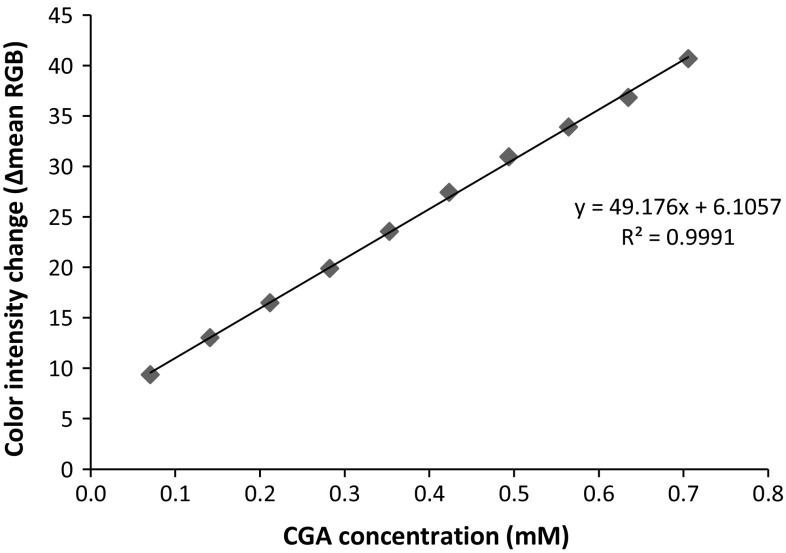
As described earlier, CGA was used as standard for determining TPC since it is well known as major phenolic acid in coffee bean (Farah et al. 2006). The calibration curve was constructed by plotting concentration of CGA added to sensor versus its color intensity change (∆mean RGB), as depicted in Fig. 4. It can be seen that range of the sensor response is linear in the range of 0.07–0.71 mM with coefficient of determination of 0.9991.
Fig. 4.
The calibration curve of CGA solution at 0.07–0.71 mM (n = 3) constructed by the polyphenol sensor
Sensitivity of sensors is described as the slope of linear curve which was calculated to be 49.176 Δmean RGB/mM CGA (α = 0.05, n = 3). The detection limit (LOD) of the polyphenol sensor, which is defined as the concentration of sample generating a signal equal to the blank signal plus three times its standard deviation which was 0.876, was calculated to be 0.002 mM. The reproducibility of the sensor response was tested toward 0.64 mM of CGA and has relative standard deviation (RSD) value lower than 1%, which indicates the developed method has good reproducibility (Yuwono and Indrayanto 2005).
Selectivity
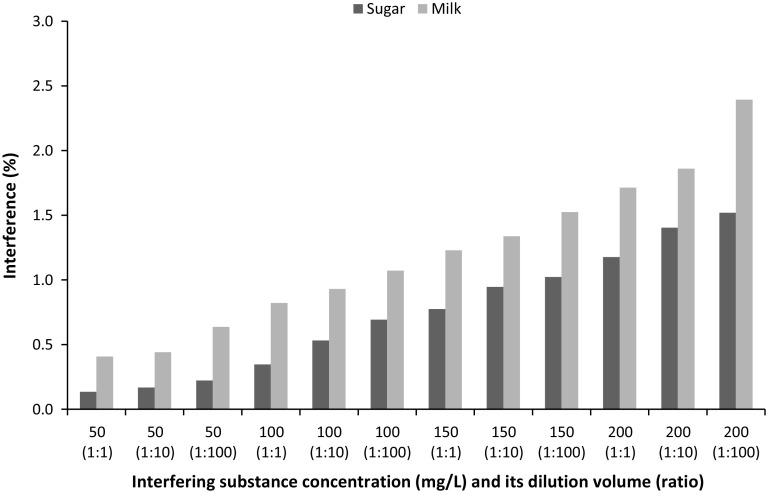
To evaluate the interference of polyphenol sensor, the influence of potential interfering substance, i.e. sugar (sucrose) and milk (skimmed powder), on TPC determination in simulated sample (CGA solution at 150 mg/L concentration) was examined. Different concentration (50, 100, 150, and 200 mg/L in water) and dilution volume (1:1, 1:10, and 1:100 ratios) of interfering substances and their effects on color intensity changes in sensor were investigated. Interfering signal, calculated by subtracting color intensity change of interfering substance added-sample with that of original sample, and divided by color intensity change of original sample was found less than 2.5 and 2.0% for milk and sugar respectively, as depicted in Fig. 5. This finding indicated that sugar and milk at concentration of 200 mg/L and dilution of 1:100 ratios did not interfere greatly with polyphenol measurement in the sensor developed herein.
Fig. 5.
The observed interference signal in 150 mg/L CGA measurement by polyphenol sensor after addition of sugar and milk at various concentrations and volume ratios
Recovery
To evaluate the performance of the proposed method in TPC analysis, simulated sample containing 83 mg/L CGA was analyzed using polyphenol sensor by standard addition method, following recovery test suggested by Huber (2007). After individual addition of a series solution containing 108, 120, and 133 mg/L CGA to represent 30, 45, and 60% of initial analyte concentration, the recovery of CGA was found to be in the range 100–102%. This finding suggested that the sensor has good accuracy and great potential for determining TPC in real coffee samples.
Stability
In this work, various storage conditions were applied for stability test of the developed sensor. The sensor was separately stored in a well-capped cabinet at room (25 °C) and in a chiller at 4 °C temperature. Then, the sensor response to added 0.42 mM CGA was measured by using ImageJ program every day, until 10% decrease of initial response was obtained. It was found that after 15 days the sensor response was observed to decrease more than 10% when it was stored at room temperature. Thus, it can be noted that stability of sensor was only maintained for two weeks at room temperature. In attempt to increase the stability of the sensor, the sensor was also stored at chilling temperature. The sensor response towards CGA solution was found to be stable during 27 days storage at chilling temperature. After this period, the sensor response decreased more than 10%, suggesting that stability of sensor was preserved up to four weeks in a chiller.
Application and measurement of TPC in brewed-filtered coffee
In order to demonstrate the practical use of the polyphenol sensor, various samples prepared from coffee beans of different varieties, such as Arabica and Robusta, were applied. By using standard calibration curve of CGA (“Polyphenol measurement” section), TPC of coffee samples were calculated and expressed as chlorogenic acid equivalent (CGAE) in mg/L (mg/L CGAE). As comparison, the standard FC method was applied for TPC determination of coffee beverages. Here, we followed the TPC method described by Ningsih et al. (2016). The results showed that the proposed method was in good agreement with spectrophotometric method, since the calculated values of t (tcal) were less than table t (ttab) with ttab of 2.776 (df = 4 and α = 0.05) as depicted in Table 1. Moreover, TPC values obtained by polyphenol sensor and using a spectrophotometer were highly correlated, the coefficient of correlation (r) was found to be 0.999. This is indicating the practical use of the colorimetric paper for the determination of TPC of coffee samples.
Table 1.
Results of TPC (mg/L CGAE) of various coffee beverages determined by the polyphenol sensor and the UV/Vis spectrophotometer (n = 3, α = 0.05)
| Sample | Polyphenol sensor | Spectrophotometer | tacal |
|---|---|---|---|
| Arabica | 89.872 ± 0.343 | 88.774 ± 1.091 | 0.193 |
| Robusta | 82.369 ± 1.006 | 82.345 ± 0.743 | 1.520 |
| Green | 97.302 ± 0.202 | 96.869 ± 0.898 | 0.814 |
| Blend | 94.098 ± 0.611 | 94.131 ± 0.545 | 0.069 |
| Ground | 100.124 ± 0.129 | 100.202 ± 0.545 | 0.242 |
| Mongoose | 68.219 ± 0.536 | 68.893 ± 0.945 | 1.074 |
aResults were obtained by paired t test, with t value (ttab) of 2.776 (df = 4 and α = 0.05)
The amount of chemical reagent used (4 µL) was reduced in the developed method, while larger volume of reagent (0.3–3 mL) was employed in the conventional spectrophotometric method. Moreover, since a common flatbed scanner can be employed to obtain the analytical signal, the consumption of electrical power was extremely lowered. Hence, in terms of investment and operational cost, the developed method was proven to be more economical than that of spectrophotometric method for the determination of TPC in brewed-filtered coffee.
Conclusion
Optical chemical sensor in the form of colorimetric paper for measuring TPC of brewed-filtered coffee was developed that is based on NaIO4 and MBTH solution immobilized onto filter paper. In this work, the developed sensor gives a linear response in the range at 0.07–0.71 mM with LOD at 0.02 mM, and results were found to be reproducible, have good recovery and be selective for polyphenol measurement. Furthermore, the proposed method is rapid, easy to operate, low-cost and reliable as a simple polyphenol sensor in the field application. In addition, it can be used as an alternative method for measuring TPC in various brewed-filtered coffees.
Acknowledgements
The authors gratefully thank The Directorate General of Higher Education, Ministry of Culture and Education, Republic of Indonesia, for supporting this work via The Featured Research of University (Penelitian Unggulan Perguruan Tinggi, No. 306/UN25.3.1/LT6/2014).
Compliance with ethical standards
Conflict of interest
The authors declare that they have no conflict of interest.
References
- Abdullah J, Ahmad M, Heng LY, et al. Chitosan-based tyrosinase optical phenol biosensor employing hybrid nafion/sol–gel silicate for MBTH immobilization. Talanta. 2006;70:527–532. doi: 10.1016/j.talanta.2005.12.061. [DOI] [PubMed] [Google Scholar]
- Abdullah J, Ahmad M, Heng LY, et al. An optical biosensor based on immobilization of laccase and MBTH in stacked films for the detection of catechol. Sensors. 2007;7:2238–2250. doi: 10.3390/s7102238. [DOI] [PMC free article] [PubMed] [Google Scholar]
- Amatatongchai M, Sroysee W, Laosing S, Chairam S. rapid screening method for assessing total phenolic content using simple flow injection system with laccase based-biosensor. Int J Electrochem Sci. 2013;8:10526–10539. [Google Scholar]
- Arciuli M, Palazzo G, Gallone A, Mallardi A. Bioactive paper platform for colorimetric phenols detection. Sens Actuators B Chem. 2013;186:557–562. doi: 10.1016/j.snb.2013.06.042. [DOI] [Google Scholar]
- Ascherio A, Zhang SM, Hernán MA, et al. Prospective study of caffeine consumption and risk of Parkinson’s disease in men and women. Ann Neurol. 2001;50:56–63. doi: 10.1002/ana.1052. [DOI] [PubMed] [Google Scholar]
- Ayelign A, Sabally K. Determination of chlorogenic acids (CGA) in coffee beans using HPLC. Am J Res Commun. 2013;1:78–91. [Google Scholar]
- Bae J-H, Park J-H, Im S-S, Song D-K. Coffee and health. Integr Med Res. 2014;3:189–191. doi: 10.1016/j.imr.2014.08.002. [DOI] [PMC free article] [PubMed] [Google Scholar]
- Belay A, Gholap AV. Characterization and determination of chlorogenic acids (CGA) in coffee beans by UV–Vis spectroscopy. Afr J Pure Appl Chem. 2009;3:234–240. [Google Scholar]
- Box JD. Investigation of the Folin–Ciocalteau phenol reagent for the determination of polyphenolic substances in natural waters. Water Res. 1983;17:511–525. doi: 10.1016/0043-1354(83)90111-2. [DOI] [Google Scholar]
- Clifford MN. Chlorogenic acids-their complex nature and routine determination in coffee beans. Food Chem. 1979;4:63–71. doi: 10.1016/0308-8146(79)90031-1. [DOI] [Google Scholar]
- ElKaoutit M, Naranjo-Rodriguez I, Temsamani KR, et al. A comparison of three amperometric phenoloxidase–Sonogel–Carbon based biosensors for determination of polyphenols in beers. Food Chem. 2008;110:1019–1024. doi: 10.1016/j.foodchem.2008.03.006. [DOI] [PubMed] [Google Scholar]
- Farah A, Donangelo CM. Phenolic compounds in coffee. Braz J Plant Physiol. 2006;18:23–36. doi: 10.1590/S1677-04202006000100003. [DOI] [Google Scholar]
- Farah A, de Paulis T, Moreira DP, et al. Chlorogenic acids and lactones in regular and water-decaffeinated arabica coffees. J Agric Food Chem. 2006;54:374–381. doi: 10.1021/jf0518305. [DOI] [PubMed] [Google Scholar]
- Fernandes SC, Moccelini SK, Scheeren CW, et al. Biosensor for chlorogenic acid based on an ionic liquid containing iridium nanoparticles and polyphenol oxidase. Talanta. 2009;79:222–228. doi: 10.1016/j.talanta.2009.03.039. [DOI] [PubMed] [Google Scholar]
- Fulcrand H, Cheminat A, Brouillard R, Cheynier V. Characterization of compounds obtained by chemical oxidation of caffeic acid in acidic conditions. Phytochemistry. 1994;35:499–505. doi: 10.1016/S0031-9422(00)94790-3. [DOI] [Google Scholar]
- Hečimović I, Belščak-Cvitanović A, Horžić D, Komes D. Comparative study of polyphenols and caffeine in different coffee varieties affected by the degree of roasting. Food Chem. 2011;129:991–1000. doi: 10.1016/j.foodchem.2011.05.059. [DOI] [PubMed] [Google Scholar]
- Hidayat MA, Jannah F, Kuswandi B. Development of paper based sensor for the determination of total phenolic content in green tea beverages. Agric Agric Sci Procedia. 2016;9:424–430. doi: 10.1016/j.aaspro.2016.02.159. [DOI] [Google Scholar]
- Higdon JV, Frei B. Coffee and health: a review of recent human research. Crit Rev Food Sci Nutr. 2006;46:101–123. doi: 10.1080/10408390500400009. [DOI] [PubMed] [Google Scholar]
- Huber L. Validation and qualification in analytical laboratories. 2. New York: Informa Healthcare USA; 2007. [Google Scholar]
- Ibtisam K, Karim A. Optimization of instant controlled pressure drop dic-assisted-solvent extraction of total phenols of green coffee beans. J Food Stud. 2013;2:42–61. [Google Scholar]
- Jiménez-Atiénzar M, Cabanes J, Gandía-Herrero F, García-Carmona F. Kinetic analysis of catechin oxidation by polyphenol oxidase at neutral pH. Biochem Biophys Res Commun. 2004;319:902–910. doi: 10.1016/j.bbrc.2004.05.077. [DOI] [PubMed] [Google Scholar]
- Muñoz JL, García-Molina F, Varón R, et al. Calculating molar absorptivities for quinones: application to the measurement of tyrosinase activity. Anal Biochem. 2006;351:128–138. doi: 10.1016/j.ab.2006.01.011. [DOI] [PubMed] [Google Scholar]
- Muñoz J, Garcia-Molina F, Varon R, et al. Kinetic characterization of the oxidation of chlorogenic acid by polyphenol oxidase and peroxidase. Characteristics of the o-quinone. J Agric Food Chem. 2007;55:920–928. doi: 10.1021/jf062081+. [DOI] [PubMed] [Google Scholar]
- Munoz-Munoz JL, García-Molina F, Molina-Alarcón M, et al. Kinetic characterization of the enzymatic and chemical oxidation of the catechins in green tea. J Agric Food Chem. 2008;56:9215–9224. doi: 10.1021/jf8012162. [DOI] [PubMed] [Google Scholar]
- Nadifiyine S, Calas-Blanchard C, Amine A, Marty J-L. Tyrosinase biosensor used for the determination of catechin derivatives in tea: correlation with HPLC/DAD method. Food Nutr Sci. 2013;4:108–118. doi: 10.4236/fns.2013.41015. [DOI] [Google Scholar]
- Ningsih IY, Zulaikhah S, Hidayat MA, Kuswandi B. Antioxidant activity of various Kenitu (Chrysophyllum cainito L.) leaves extracts from Jember, Indonesia. Agric Agric Sci Procedia. 2016;9:378–385. doi: 10.1016/j.aaspro.2016.02.153. [DOI] [Google Scholar]
- Perrone D, Farah A, Donangelo CM, et al. Comprehensive analysis of major and minor chlorogenic acids and lactones in economically relevant Brazilian coffee cultivars. Food Chem. 2008;106:859–867. doi: 10.1016/j.foodchem.2007.06.053. [DOI] [Google Scholar]
- Santagostini L, Mutti FG, Pievo R, et al. Biomimetic modeling of copper complexes: a study of enantioselective catalytic oxidation on D -(+)-catechin and L -(-)-epicatechin with copper complexes. Bioinorg Chem Appl. 2008 doi: 10.1155/2008/762029. [DOI] [PMC free article] [PubMed] [Google Scholar]
- Santana-Gálvez J, Cisneros-Zevallos L, Jacobo-Velázquez D. Chlorogenic acid: recent advances on its dual role as a food additive and a nutraceutical against metabolic syndrome. Molecules. 2017;22:358. doi: 10.3390/molecules22030358. [DOI] [PMC free article] [PubMed] [Google Scholar]
- Santos WJR, Santhiago M, Yoshida IVP, Kubota LT. Novel electrochemical sensor for the selective recognition of chlorogenic acid. Anal Chim Acta. 2011;695:44–50. doi: 10.1016/j.aca.2011.03.018. [DOI] [PubMed] [Google Scholar]
- Sartorelli DS, Fagherazzi G, Balkau B, et al. Differential effects of coffee on the risk of type 2 diabetes according to meal consumption in a French cohort of women: the E3N/EPIC cohort study. Am J Clin Nutr. 2010;91:1002–1012. doi: 10.3945/ajcn.2009.28741. [DOI] [PubMed] [Google Scholar]
- Şenyurt Ö, Eyidoğan F, Yılmaz R, et al. Development of a paper-type tyrosinase biosensor for detection of phenolic compounds. Biotechnol Appl Biochem. 2015;62:132–136. doi: 10.1002/bab.1246. [DOI] [PubMed] [Google Scholar]
- Stalmach A, Mullen W, Nagai C, Crozier A. On-line HPLC analysis of the antioxidant activity of phenolic compounds in brewed, paper-filtered coffee. Braz J Plant Physiol. 2006;18:253–262. doi: 10.1590/S1677-04202006000100018. [DOI] [Google Scholar]
- Tieges Z, Richard Ridderinkhof K, Snel J, Kok A. Caffeine strengthens action monitoring: evidence from the error-related negativity. Cogn Brain Res. 2004;21:87–93. doi: 10.1016/j.cogbrainres.2004.06.001. [DOI] [PubMed] [Google Scholar]
- Upadhyay R, Ramalakshmi K, Jagan Mohan Rao L. Microwave-assisted extraction of chlorogenic acids from green coffee beans. Food Chem. 2012;130:184–188. doi: 10.1016/j.foodchem.2011.06.057. [DOI] [Google Scholar]
- Wenjing L, Sheng Z, Ling Y, et al. Simultaneous determination of 6 phenolic acids in coffee beans by reversed-phase high performance liquid chromatography. Chin J Chromatogr. 2014;29:439–442. doi: 10.3724/sp.j.1123.2011.00439. [DOI] [PubMed] [Google Scholar]
- Yardim Y, Keskin E, Şentürk Z. Voltammetric determination of mixtures of caffeine and chlorogenic acid in beverage samples using a boron-doped diamond electrode. Talanta. 2013;116:1010–1017. doi: 10.1016/j.talanta.2013.08.005. [DOI] [PubMed] [Google Scholar]
- Yuwono M, Indrayanto G. Validation of chromatographic methods of analysis. Profiles Drug Subst Excip Relat Methodol. 2005;32:243–259. doi: 10.1016/S0099-5428(05)32009-0. [DOI] [PubMed] [Google Scholar]


