

Abstract
Protein cysteinyl residues are the mediators of hydrogen peroxide (H2O2)-dependent redox signaling. However, site-specific mapping of the selectivity and dynamics of these redox reactions in cells poses a major analytical challenge. Here we describe a chemoproteomic platform to systematically and quantitatively analyze the reactivity of thousands of cysteines toward H2O2 in human cells. We identified >900 H2O2-sensitive cysteines, which are defined as the H2O2-dependent redoxome. Although redox sites associated with antioxidative and metabolic functions are consistent, most of the H2O2-dependent redoxome varies dramatically between different cells. Structural analyses reveal that H2O2-sensitive cysteines are less conserved than their redox-insensitive counterparts and display distinct sequence motifs, structural features, and potential for crosstalk with lysine modifications. Notably, our chemoproteomic platform also provides an opportunity to predict oxidation-triggered protein conformational changes. The data are freely accessible as a resource at http://redox.ncpsb.org/OXID/.
Hydrogen peroxide (H2O2)1 generated in a wide range of physiological and pathological processes can promote cell damage, but also can activate cell regulatory and signaling pathways as a signaling molecule (1, 2). Site-specific modification of cysteinyl thiols on H2O2-sensitive proteins represents a unique molecular mechanism for transducing oxidant signals into biological responses (3, 4). In species from yeast to human, the evolutionarily conserved catalytic cysteines of peroxiredoxins have the attributes to act as the most reactive sensors of H2O2 (5). The mechanism of H2O2-sensing and transduction by peroxiredoxins is becoming well understood (6). Approximately 20 other proteins, including protein tyrosine phosphatases, metabolic enzymes, and stress sensors, have been characterized in the last two decades as targets of H2O2 with functionally important roles (7–9). However, recent advances suggest that hundreds of cysteines are oxidation-sensitive (10–12). This suggests that the scope of the redox-sensitive proteome is considerably broader than previously imagined and raises important new questions. Is H2O2 redox reactivity an intrinsic feature of certain cysteines in specific sequences and conserved across different cellular proteomes? Does the cell-specific redox environment affect the reactivity of cysteines toward H2O2? Are the relative reactivity and functional contributions of oxidation-sensitive cysteines in H2O2 sensing conserved in different cellular contexts? A fundamental barrier to answering these questions is the lack of methodology to globally quantify site-specific H2O2-dependent cysteine oxidations across native proteomes.
Here we describe a chemoproteomic strategy, called quantitative thiol reactivity profiling (QTRP), which we applied to systematically and quantitatively determine the reactivities of 6566 cysteines on 3557 proteins toward different levels of H2O2 stimulation in multiple human cell lines. This large-scale redox proteomic survey provides a rank order of redox reactivity of these cysteines in cells and reveals—surprisingly—that most cysteines sense H2O2 in a cell-specific manner, thereby presenting a new conceptual framework onto which to build models of cellular redox control. Systems level analyses of this data set uncover the functional contributions of cell-specific redoxomes in H2O2 sensing and the downstream cellular responses. Structural analyses reveal that H2O2-sensitive cysteines are mostly unconserved, but display distinct sequence motifs, structural features, and potential crosstalk with sequence-adjacent lysine modifications. In addition, the data demonstrate potential utility of a redox chemoproteomic strategy in predicting oxidation-triggered protein conformational changes.
EXPERIMENTAL PROCEDURES
Reagents
IPM, light and heavy (13C6) Az-UV-biotin reagents were synthesized as previously described (13, 14). HPLC-grade water, acetonitrile, and methanol were purchased from J.T.Baker (Center Valley, PA). Antibody against V5 (R960–25, diluted at 1:1000) was purchased from Invitrogen (Carlsbad, CA). Antibodies against phospho-p38 MAPK (9211, diluted at 1:1000), p38 MAPK (9212, diluted at 1:1000) were purchased from Cell Signaling Technology (Danvers, MA). Antibodies against β-actin (ab6276, diluted at 1:5000), PRDX-SO2/3H (ab16830, diluted at 1:2000), PRDX2 (ab15572, diluted at 1:2000) were purchased from Abcam (Cambridge, MA).
Cell Culture and Transfection
Human A431, HEK293, HepG2, and U2OS cells (ATCC) were maintained at 37 °C in a 5% CO2, humidified atmosphere and were cultured in DMEM medium (Life Technologies, Waltham, MA, 12430) containing 10% FBS (Atlas Biologicals, Fort Collins, CO). For each QTRP experiment, cells on a 15-cm plate were grown to 80% confluency. After serum-deprivation, the medium was removed and replaced with 15 ml fresh serum-free medium (Pre-warmed to 37 °C) containing different concentration of H2O2 (0.02, 0.05, 0.2, 0.5, 2.0, 5.0 mm). The control plates of cells were treated with 15 ml serum-free medium in parallel. After 10 min incubation in the same condition for cell culture, cells were rinsed quickly with cold PBS three times, and scratched from plates. Cell pellets were then collected by centrifugation at 1500 × g for 3 min at 4 °C.
Cells expressing V5-tagged APIP, or C147A mutant thereof, were derived by transfection of the corresponding plasmids. The original APIP plasmid was purchased from DNASU.org and ligated into the pLX304 vector (Addgene, Cambridge, MA, 25890). pLX304-apip was used as the plasmid DNA template for oligonucleotide-directed mutagenesis. APIP-C147A mutant plasmid was generated by QuikChange site-directed mutagenesis using the following primer:
C147A_F1: cacatcaagagatgataaaaggaataaagaaagctacttccggagggtattat
C147A_R1: ataataccctccggaagtagctttctttattccttttatc atctcttgatgtg
Transfections were performed using Lipofectamine™ 2000 according to the manufacturer's instructions (11668–019, Invitrogen). In brief, HEK293 cells were preseeded in a 10-cm culture plate and reached to 80% confluency prior to transfection. 15 μl Lipofectamine™ 2000 and 10 μg pLX304-apip or pLX304-C147A plasmid were premixed and incubated at RT for 5 min. The plasmid-Lipofectamine complex was added to cells in each plate dropwise. After 4 h incubation, the transfection medium was removed and cells were cultured in regular DMEM medium with 10% FBS for another 48 h.
Probe Labeling and Proteomic Sample Preparation
Cell pellets were lysed on ice for 20 min in four volumes of NETN buffer (50 mm HEPES pH 7.5, 150 mm NaCl, and 1% Igepal) supplemented with 10 μl/ml of HALTTM protease and phosphatase inhibitors (Life Technologies, 78444) containing 200 unit/ml catalase (Sigma-Aldrich, St. Louis, MO, C9322) and 100 μm IPM probe. The labeling reactions were incubated at RT for 1 h with light protection. The lysate was then incubated with DTT (Final concentration = 10 mm) at 75 °C for 15 min to reduce the reversibly oxidized cysteines. Reduced cysteines then were alkylated with 40 mm IAM for 30 min in the dark. The reactions were quenched by protein precipitation, which was performed with a methanol-chloroform system (aqueous phase/methanol/chloroform, 4:4:1, v/v/v) as described previously (15). In brief, proteins were collected at the aqueous/organic phase interface as a solid disk after centrifugation at 1400 × g for 20 min at 4 °C. Liquid layers were discarded and the protein was washed twice in methanol/chloroform (1:1, v/v), followed by centrifugation at 16,000 × g for 10 min at 4 °C to repellet the protein. The protein pellets were resuspended with 50 mm ammonium bicarbonate containing 0.2 m urea. Protein concentrations in the resuspended solution were measured with BCA assay (Life Technologies, 23225) and adjusted to 2 mg/ml. For a typical QTRP experiment, each of the control and H2O2-treated proteome samples (2 mg protein/ml in 1-ml volume) were first digested with sequencing grade trypsin (Promega, Madison, WI, V5113) at a 1:50 (enzyme/substrate) ratio overnight at 37 °C. A secondary digestion was performed by adding additional trypsin to a 1:100 (enzyme/substrate) ratio, followed by incubation at 37 °C for additional 4 h. The tryptic digests were desalted with HLB extraction cartridges (Waters, Milford, MA, WAT094225) as previously described (15). The desalted tryptic digests were reconstituted in a solution containing 30% ACN. CuAAC reaction was performed by the addition of 0.8 mm either light Az-UV-biotin or heavy Az-UV-biotin, 8 mm sodium ascorbate (Sigma-Aldrich, A7631), 1 mm TBTA (Sigma-Aldrich, 678937), and 8 mm CuSO4 (Thermo Fisher Scientific, Waltham, MA C493–500). Samples were allowed to react at room temperature for 2 h in the dark with rotation. The light- and heavy Az-UV-biotin labeled samples then were mixed equally together. The excess biotin reagents were removed by SCX, as previously described (15). In brief, the sample was diluted into SCX loading buffer (5 mm KH2PO4, 25% acetonitrile, pH 3.0), passed through the SCX spin columns (The Nest Group, Southborough, MA, SMM HIL-SCX), and washed with several column volumes of loading buffer. The retained peptides were eluted with SCX loading buffer containing 400 mm NaCl. Eluent was diluted 10× with 50 mm sodium acetate buffer (NaAc, pH 4.5) and then allowed to interact with pre-washed streptavidin Sepharose (GE, Pittsburgh, PA, 17–5113-01) for 2 h at room temperature. Streptavidin Sepharose then was washed with 50 mm NaAc, 50 mm NaAc containing 2 m NaCl, and water twice each with votexing and/or rotation to remove nonspecific binding peptides, and resuspended in 25 mm ammonium bicarbonate. The suspension of streptavidin Sepharose was transferred to several thin-walled borosilicate glass tubes (VWR International, Radnor, PA, 66011–020), irradiated with 365 nm UV light for 2 h at room temperature with stirring. The supernatant was collected, concentrated under vacuum, and desalted with HLB extraction cartridges (Waters, 186000383) as previously described (15). The desalting peptides were evaporated to dryness and stored at −20 °C until analysis.
Preparation of Histones from Cells
Histones were acid-extracted from both HepG2 and U2OS cells treated with or without H2O2 (1 mm, 30 min) using the EpiQuik TM Total Histone Extraction Kit (OP-0006, Epigentek Group Inc, Farmingdale, NY) according to the manufacturer's instructions. Briefly, histones were extracted with lysis buffer containing 0.2 m H2SO4 and precipitated with 33% trichloroacetic acid (TCA) overnight. Samples were dried by vacuum centrifugation and were then resuspended in 50 μl ammonium bicarbonate (100 mm, pH 8.0). Protein concentration was quantified using the bicinchoninic acid assay. Ammonium hydroxide (1 μl ammonium hydroxide for 10 μl propionylation reaction) was then added to the histone samples for keeping the pH between 8.0 and 9.0. Derivatization reagent was prepared by mixing propionic anhydride with 2-propanol in the ratio 1:3 (v/v) and immediately added to the histone samples for 15 min at 37 °C. Samples were dried by vacuum centrifugation and the propionylation reaction were repeated twice. Dried samples were resuspended in ammonium bicarbonate (100 mm, pH 8.0) and then digested at 37 °C overnight with trypsin (1:20, enzyme/substrate). After digestion, homogenates were centrifuged at 12,000 rpm for 10 min and the supernatants were dried by vacuum centrifugation. Dried samples were resuspended in ammonium bicarbonate (100 mm, pH 8.0) and the derivatization reaction was performed again twice to derivatize peptide N-termini. Dried samples were resuspended in 0.1% formic acid and were then desalted by using C18 stage-tips. Digested peptides were then eluted with 50% ACN and 0.1% formic acid. Eluted peptides were dried by vacuum centrifugation, resuspended in 0.1% formic acid, and subjected to LC-MS/MS analysis.
Identification of the Intramolecular C152-C156 Disulfide Bond On GAPDH
Cells were grown and maintained in high glucose DMEM supplemented with 10% fetal bovine serum at 37 °C and 5% CO2. Cells were grown until 80% confluent and subjected to serum deprivation overnight. Cells were then treated with or without 2 mm H2O2 for 10 min. Treatments were stopped by removing the medium and washing the plates quickly with cold PBS three times. Cells were lysed in NETN buffer containing100 mm iodoacetamide for 30 min on ice before centrifugation (13, 000 × g, 10min). The soluble fraction (2 mg) were incubated with 10 μg of Anti-GAPDH antibody (HC301–02, Transgen Biotech, Beijing, China) at 4 °C overnight and precipitated with protein A/G-agarose beads for 2 h at RT. Immunoprecipitated proteins was incubated with non-reducing SDS-PAGE loading buffer (250 mm Tris-HCl, 10% SDS, 0.5% bromphenol blue, 50% glycerol, pH6.8) at RT for 10 min and separated on 10% SDS-PAGE. Proteins on SDS-PAGE gels were stained by Coomassie blue. The bands with corresponding molecular weight (∼36 kD) were excised and subjected to in-gel tryptic digestion. The resulting peptides were analyzed by LC-MS/MS.
LC-MS/MS Analysis
For QTRP experiment, LC-MS/MS analyses were performed on a Q Exactive Plus mass spectrometer (Thermo Fisher Scientific) operated with an Easy-nLC1000 system (Thermo Fisher Scientific). Samples were reconstituted in 0.1% formic acid followed by centrifugation (16,000 × g for 10 min) and the supernatants were pressure-loaded onto a 360 μm outer diameter × 75 μm inner diameter microcapillary precolumn packed with Jupiter C18 (5 μm, 300 Å, Phenomenex, Torrance, CA) and then washed with 0.1% formic acid. The precolumn was connected to a 11 cm 50-μm-inner diameter microcapillary analytical column packed with the ReproSil-Pur C18-AQ (3 μm, 120 Å, Dr. Maisch GebH, Germany) and equipped with an integrated electrospray emitter tip. The spray voltage was set to 2.2 kV and the heated capillary temperature to 250 °C. LC gradient consisted of 0–15 min, 2% B; 35 min, 15% B; 40 min, 20% B; 50 min, 30% B; 55 min, 35% B; 59–65 min, 90% B; 80–85 min, 2% B (A = water, 0.1% formic acid; B = ACN/0.1% formic acid) at a flow rate of 300 nL/min. HCD MS/MS spectra were recorded in the data-dependent mode using a Top 20 method. MS1 spectra were measured with a resolution of 70,000, an AGC target of 3e6, a max injection time of 20 ms, and a mass range from m/z 300 to 1800. HCD MS/MS spectra were acquired with a resolution of 17,500, an AGC target of 2e5, a max injection time of 50 ms, a 1.0 m/z isolation window and normalized collision energy of 28. Peptide m/z that triggered MS/MS scans were dynamically excluded from further MS/MS scans for 20 s.
For all other experiments, samples were reconstituted in 0.1% formic acid and pressure-loaded onto a 2 cm microcapillary precolumn packed with C18 (3 μm, 120 Å, SunChrom, Friedrichsdorf, Germany). The precolumn was connected to a 12 cm 150-μm-inner diameter microcapillary analytical column packed with C18 (1.9 μm, 120 Å, Dr. Maisch) and equipped with a homemade electrospray emitter tip. The spray voltage was set to 2.1 kV and the heated capillary temperature to 320 °C. For histones, LC gradient consisted of 0 min, 7% B; 14 min, 10% B; 51 min, 20% B; 68 min, 30% B; 69–75 min, 95% B (A = water, 0.1% formic acid; B = ACN, 0.1% formic acid) at a flow rate of 600 nL/min. HCD MS/MS spectra were recorded in the data-dependent mode using a Top 20 method. MS1 spectra were measured with a resolution of 70,000, an AGC target of 3e6, a max injection time of 20 ms, and a mass range from m/z 300 to 1400. HCD MS/MS spectra were acquired with a resolution of 17,500, an AGC target of 1e6, a max injection time of 60 ms, a 1.6 m/z isolation window and normalized collision energy of 30. Peptide m/z that triggered MS/MS scans were dynamically excluded from further MS/MS scans for 18 s. For GAPDH, LC gradient consisted of 0 min, 8% B; 15 min, 24% B; 21 min, 35% B; 22 min, 35% B; 30 min, 95% B (A = water, 0.1% formic acid; B = 80% ACN, 0.1% formic acid) at a flow rate of 600 nL/min. The parallel reaction monitoring (PRM) method consisted of an MS1 scan at 70,000 resolution with an AGC value of 3e6, max injection time of 60 ms, and scan range from m/z 300–1400 recorded as MS1 profile data. This was followed by three targeted MS2 scans (VIPELNGK, m/z 859.434, charge 2; IISNACTTNCLAPLAK with disulfide bond, m/z 435.258, IISNACIAMlTTNCIAMLAPLAK, charge 2; m/z 917.440, charge 2) at a resolution of 35,000 and with an AGC value of 1e6, a max injection time of 100 ms, a 2.0 m/z isolation window, normalized collision energy of 27, and recorded as profile data.
Peptide Identification and Quantification
Raw datafiles from 72 LC-MS/MS runs were converted to mzML format using Proteowizard (3.0.5211) (16). The mzML files were searched against a decoy protein database consisting of forward and reversed human RefSeq version 54 database (Sep 25, 2012; 34,590 entries) using MS-GF+ (version 9979) (17). Precursor ion mass tolerance and fragmentation tolerance were both set as 10 ppm for the database search. A specific-tryptic search was employed with a maximum of two missed cleavages allowed. The maximum number of modifications allowed per peptide was three. Different modifications of + 15.9949 Da (oxidation, M), + 57.0214 Da (iodoacetamide alkylation, C), +252.1222 (light IPM-triazohexanoic acid, C), and + 258.1424 (heavy IPM-triazohexanoic acid, C) were searched as variable modifications. No fixed modifications were searched. Spectral identification mzID files generated from the MS-GF+ search were converted to idpXML files for protein assembly using IDPicker 3 (version 3.1.10199.0) (18). The maximum Q value of peptide-spectrum matches (PSMs) was set as 0.5% and each peptide should be identified by at least three spectra in QTRP experiments for each cell line. These stringent filters result in a final false-positive rate below 1% for peptides and their corresponding proteins groups.
Peptide quantifications were performed with Skyline software as previously described (15, 19). Spectral libraries were imported from the mzID files. A subset FASTA database containing all the identifications (with and/or without IPM modification) exported from the IDPicker files was then imported into Skyline (version 3.1). The peptide list was refined in Skyline by removing all unmodified peptides. To further reduce the final false-positive rate of identification and enable reliable quantification of the remaining IPM-modified peptides in the list, all the automatically annotated spectra in the Skyline libraries were manually evaluated as previously described (20). Moreover, the modified peptides whose matched spectra did not contain the major diagnostic fragment ions (m/z 311.12 and 317.14 for light and heavy peptides, respectively, which are generated by fragmentations analogous to those reported for cysteine conjugates (21)) were excluded. After refining the peptide list, Raw files were directly imported into Skyline for automatic peak picking and MS1 filtering using the following criteria. First, the retention time of the PSM-identified peptide was used to position a retention time window (± 2.0 min) across the run lacking the same peptide identification. Second, the resolution for extracting the MS1 filtering chromatogram of the target precursor ions with both light and heavy labeled peptides was set to 60,000 at 400 Th. Following data extraction, graphical displays of chromatographic traces for the top three isotopic peaks were manually inspected for proper peak picking of MS1 filtered peptides and those with isotopic dot product scores lower than 0.8 were rejected. Several additional criteria were used to further ensure the high accuracy and precision of quantification: (1) signal to noise threshold of all the detected peptides was set to 3.0; (2) baseline separation was required between the isotopic peaks of a quantifiable peptide and unknown isobaric interference; (3) manual integration was applied if necessary. The ratios of peptide areas of light peptides to their heavy isotopes (RL:H) were calculated automatically. Quantitation results were obtained from three biological replicates.
RL/H Value Processing
RL:H values (H2O2 treated/control) for each quantifiable peptide in QTRP experiment were combined and their tendency in response to H2O2 titration was classified by STEM software (22). Overlapping quantification results with the same IPM-modified cysteine (e.g. different charge states, variable Met oxidation, or tryptic termini) are grouped together and the median ratio is reported as the final RL:H value. All the final RL:H values were first logarithmically normalized before clustering. For STEM clustering, the algorithm first defines a set of distinct and representative model profiles independent of the data. These model profiles correspond to possible profiles of changing L/H ratios with H2O2 exposure concentration. The statistical significance of the number of cysteines assigned to each profile versus the number expected is then computed. Statistically significant model profiles that are like each other were grouped together to form clusters of profiles. The parameters used were set as default except the following settings: the maximum number of model profiles = 20; the maximum unit change in model profiles between groups = 2; the minimum absolute expression change = 0.8. The most significantly enriched cluster was a group of cysteine sites with declining RL:H values upon H2O2 titration (p < 0.05). IC50 values of these sites were calculated using probit regression analysis tool embed in SPSS software. K-means clustering implemented in STEM was performed in default settings except the number of random starts was set as 100.
Bioinformatics and Structural Analysis
GO enrichment (p < 0.01, FDR<0.05) analyses were performed by comparing the H2O2-sensitive proteins identified in each cell line with the corresponding abundance-corrected proteomes using a functional annotation web tool as previously described (23). RNA-level expression data used for protein abundance correction across four cell lines were obtained from The Human Protein Atlas (24). The consensus sequence motif analysis was conducted by pLogo (25), a linear sequence prediction algorithm based on their statistical significance (p < 0.05). The evolution conservation analysis was based on the residues within homologous proteins of eukaryotic species using eggNOG's multiple sequence alignments (26). The presence or absence of the H2O2-sensitive and insensitive cysteines within the alignments was counted, and the overall percentage of cysteines at the respective positions was calculated for each species. For residue colocalization analysis, information about the PTMs on lysine (K) and arginine (R) residues were obtained from PhosphoSitePlus (27) and the distribution of lysine and arginine residues with or without modifications in the near vicinity (±6 residues) of the H2O2-sensitive and insensitive cysteines were calculated. The crystal structures of the proteins used for calculation of residue solvent accessibility (RSA) and pKa values of H2O2-sensitive and -insensitive cysteines were obtained from protein data bank (PDB) (supplementary Table S9). RSA were calculated with a probe (H2O) radius of 1.4 Å and default gradient using GETAREA (28). The residues which exceeds the ratio value 50% were solvent accessible and buried if it is less than 20%. Theoretical calculations of pKa values were carried out based on PDB structures using the program PROPKA versions 3.0 (29). PARSE was chosen as the forcefield and the pH value was set as 7.0 to enable annotation of protonation states.
Quantification of Intracellular NADP+/NADPH and GSH/GSSG Levels
The NADP+/NADPH ratios were determined based on a GDH cycling reaction, in which a tetrazolium dye is reduced by NADPH in the presence of phenazine methosulfate, using EnzychromTM NADP and NADPH assay kits (ECNP-100 Bioassay Systems, Hayward, CA) following the manufacturer's instructions. In brief, Cells were grown to confluence in 6-well plates and, 24 h before measurement, spent medium was changed to fresh medium. NADP and NADPH in each well of tested cells were extracted at 60 °C for 5 min, followed by pH neutralization and centrifugation at 4 °C (13,000 × g for 5 min). Supernatants were incubated with pre-mixed working reagent containing GDH, glucose and tetrazolium dye for 30 min at RT in 96-well plate. Optical density at 565 nm was measured using a Multiskan MK3 plate reader (Thermo Fisher Scientific).
For determining intracellular GSH/GSSG ratios, cells were grown to 90% confluency on confluence in 6-well plates. Cells on the plates were acidified with ice-cold 5% metaphosphoric acid (w/v) and incubated at 4 °C for 5 min. Then, the supernatant was separated by centrifugation at 13,000 × g for 10 min at 4 °C and transferred to the wells of a 96-well plate. Total, reduced, and oxidized GSH were determined with Ellman's reagent and an enzymatic recycling system in a commercialized assay kit (Nanjing Jiancheng Bioengineering Research Institute, Nanjing, China) following the manufacturer's instructions. The measurement of the absorption (λmax = 412 nm) derived from a colorimetric reaction was conducted on a Multiskan MK3 plate reader.
Western Blotting
Cells were lysed in NTEN lysis buffer containing 100 mm NEM without reducing agents before centrifugation (13, 000g, 10min). For non-reducing gel analysis, lysates were mixed with NuPAGE® LDS loading buffer (Thermo Fisher Scientific, NP0007) and boiled for 10 min. For reducing gel analysis, 125 mm DTT (final concentration) was included in the loading buffer. The proteins resolved by SDS-PAGE were transferred to PVDF membranes (Life Technologies, LC2002). Membranes were blocked in a 1:1 mixture of TBST and blocking buffer (Rockland, Limerick, PA, MB-070) at RT for 1h. The corresponding antibody in the same buffer used for blocking were added to the membrane, and incubated overnight at 4 °C. After incubation, the membranes were washed three times with TBST, incubated with the Infrared Dye-conjugated anti-mouse 680 (Life Technologies, A21058) at RT for 30 min. The membranes were then washed three times with TBST, and then visualized on a LiCor Odyssey scanner (Lincoln, Nebraska), and analyzed using Odyssey v3.0 software.
Experimental Design and Statistical Rationale
Four cell lines, including A431, HEK293, HepG2, and U2OS, were used in this study. Each cell line was treated with six different concentration of H2O2 for 10 min to trigger variable levels of redox changes. Each QTRP experiment was performed in biological triplicate with single LC-MS/MS run to evaluate reproducibility of quantification. The quality of this data set was assessed with coefficient of variation of all the measured light to heavy (L/H) ratios. Two sample t-tests were performed to determine if evolutionary conservation, pKa values, and residue surface accessibility of H2O2-sensitive cysteines were significantly different with those of their insensitive counterparts. H2O2-dependent cysteine oxidation colocalization with other PTMs occurring on lysine and arginine were assessed by Chi-square test. Difference with p value smaller than 0.05 was considered statistically significant.
RESULTS
Quantitative Thiol Reactivity Profiling (QTRP)
In the last decade, there have been tremendous advances in the field of redox proteomics (12, 30). Protein thiols targeted by H2O2, GSNO, and lipid electrophiles can be globally profiled by a quantitative chemoproteomic strategy called isoTOP-ABPP. Alternatively, the specific oxidized forms including S-sulfenylation, S-nitrosylation, S-glutathionylation, can be enriched and identified by differential alkylation approaches (e.g. resin-assisted capture, biotin-switch technique, oxiTMT) and chemoselective labeling strategies (15, 31–35). Inspired by these studies, we developed a chemoproteomic platform to measure the ability of H2O2 to affect thiol reactivity toward an electrophilic iodoacetamide-alkyne probe (IPM) in native cell proteomes. We chose a relatively low concentration of IPM (100 μm) for thiol labeling in that a high mm concentration of thiol alkylating reagents can also react with oxidized forms of cysteines (36, 37). Moreover, it has been well-demonstrated that 100 μm of iodoacetamide-based reagent is able to completely label the native free thiol proteome (10, 38–43). Our strategy is termed quantitative thiol reactivity profiling (QTRP). As shown in Fig. 1A, the harvested proteomes from cells treated in situ with or without H2O2 were reacted with the IPM probe for alkynylation of reactive protein thiols and then digested into tryptic peptides. An isotopically labeled and UV-cleavable azido-biotin tag was then conjugated to the alkynylated peptides using copper catalyzed alkyne azide cycloaddition reaction (CuAAC, click chemistry). Isotopically light (12C) and heavy (13C) tags were conjugated to the samples with or without H2O2 treatment, respectively. Equal amounts of the corresponding light and heavy samples were mixed and subjected to successive streptavidin enrichment, photorelease, and liquid chromatography-tandem mass spectrometry (LC-MS/MS)-based proteomic analysis. The reduction in the thiol-reactive probe reactivity of cysteines in the presence of competing H2O2 were quantified from light/heavy precursor peptide m/z ratios for all the IPM labeled cysteinyl peptides, which indicates their relative reactivities toward H2O2. In principle, the lower the measured light/heavy ratio, the more reactive the cysteine was toward H2O2. To gain a more comprehensive understanding of H2O2 target reactivity profiles, we treated cells with six different concentrations of H2O2 (from 0.02 mm to 5 mm) to trigger variable levels of redox changes in four different human cell lines, including A431, HEK293, HepG2, and U2OS. The cells were stimulated for 10 min with H2O2 to detect early redox changes. Three biological replicates were performed for each stimulus in all four cell lines tested in this study, resulting in a total of 72 high-resolution LC-MS/MS runs (supplemental Table S1–S4).
Fig. 1.

Quantitative thiol reactivity profiling (QTRP). A, General workflow for QTRP. thiol proteomes from cells were labeled with IPM probe and then digested into tryptic peptides. isotopically light (12c) and heavy (13c) tagged UV-cleavable azido-biotin were conjugated to the samples with or without H2O2 Treatment, respectively, through CuAAC. Equal amounts of the corresponding light and heavy samples were mixed and subjected to successive streptavidin enrichment, photorelease, and mass spectrometry-based proteomic analysis. Competition ratios are measured by dividing the MS1 ion peaks for IPM-labeled peptides in control (Heavy, Blue) versus H2O2 treatment (light, red) samples. B, The measured light to heavy ratios of the APIP peptide containing the H2O2-sensitive cysteine, C147, quantified by QTRP in four cell lines under H2O2 titration. data are presented as mean values ± S.D.; n = three biological replicates. C, Representative MS ion chromatograms for The APIP C147 peptide in HEK293 cells. D, Verification of C147 as a H2O2-sensitive cysteine in APIP. HEK293 cells expressed with V5-tagged APIP or C147A mutant were treated with the indicated concentration of H2O2. Proteins from cell lysates were separated with reducing and non-reducing SDS-page gel electrophoresis and analyzed by immunoblotting with anti-V5.
We first evaluated the analytical performance of QTRP in this data set (supplemental Fig. S1). Typically, we identified 3795 ± 669 probe-modified peptides in single LC-MS/MS run; detection was facilitated by high enrichment specificity (77.2%-96.8% identified peptides were probe-labeled). In contrast, several previous studies using isoTOP-ABPP required fractionation and much more measurement time, while identifying fewer cysteine-containing peptides (supplemental Fig. S1). The major difference between our chemoproteomic approach and isoTOP-ABPP is the workflow design. In our workflow, click chemistry is performed on a peptide-level after tryptic digestion to enable relatively higher yield of biotinylated conjugates, whereas isoTOP-ABPP is performed click reaction on a protein-level. Moreover, 56.8–79.5% of the cysteine sites were repeatedly identified in all three biological replicates (supplemental Fig. S2). To enable highly accurate quantification of thiol reactivity, we applied stringent criteria to choose quantifiable peptides (15). The quality of this data set is further indicated by the high reproducibility among three biological replicates for all four cell lines, with the average coefficient of variation of all the measured light to heavy (L/H) ratios lower than 20% for each cell line (supplemental Fig. S3). In total, we quantified the responses to H2O2 of 6566 cysteines on 3557 proteins (Table I and supplemental Table S5). The extracted ion chromatograms for the IPM-labeled peptides from a potential H2O2 target (Apaf-1 interacting protein, APIP C147) and a well-known redox sensor (PRDX5 C100) are shown in Fig. 1C and supplemental Fig. S4, respectively, which demonstrate the coelution of the light and heavy species, the high sensitivity, and the precision of quantification. However, we could not detect several well-known redox sensitive cysteines such as peroxidatic cysteines of typical 2-Cys peroxiredoxins and CXXC motif of thioredoxins, probably because these deeply buried cysteines maybe be inaccessible to the IPM probe for steric reasons or rapid formation of intramolecular disulfide bond outcompete probe-thiol reactions. To further validate the MS result, we expressed wildtype and C147A mutant APIP with a V5 tag in HEK293 cells and analyzed the effect of H2O2 treatment by reducing and non-reducing SDS-PAGE. H2O2-induced oxidation of wildtype APIP led to altered migration on non-reducing gels in a dose-dependent manner, whereas C147A mutant APIP was unaffected (Fig. 1D).
Table I. IPM probe-labeled cysteine sites identified and quantified in four cell lines across 72 QTRP experiments.
| Cell line | Distinct peptides | Distinct proteins | Quantifiable peptides | Quantifiable cysteine sites | Proteins with quantifiable cysteine |
|---|---|---|---|---|---|
| A431 | 5313 | 2802 | 3714 | 3529 | 2094 |
| HEK293 | 7001 | 3506 | 3557 | 3433 | 2196 |
| HepG2 | 7224 | 3435 | 3713 | 3563 | 2212 |
| U2OS | 6072 | 3132 | 3616 | 3459 | 2126 |
| Total | 11595 | 5119 | 6959 | 6566 | 3557 |
QTRP Identifies the H2O2-sensitive Cysteines in Human Proteomes
The mean abundance of proteomic cysteines in all four cell lines was not affected by H2O2 (supplemental Fig. S5), but we hypothesized that this masked possibly significant individual differences. We used the data mining tool STEM (22) to identify 1259 cysteines on 1031 proteins, for which the measured L/H ratios display a descending trend upon H2O2 titration, suggesting that they might be potential H2O2-sensors (supplemental Fig. S6A). To further compare the cysteine reactivities to H2O2 in four different cell lines, we calculated the half-maximal inhibitory concentrations (IC50) for H2O2-dependent oxidation of these cysteine sites (supplemental Table S6). Accordingly, the cysteines quantified in this study could be classified into three categories. The cysteines with calculated IC50 value lower than 0.5 mm were defined as highly H2O2-sensitive targets; those within the range from 0.5 to 2.5 mm were considered to be moderately sensitive, whereas the rest were classified as insensitive. The examples for each of three categories were illustrated in supplemental Fig. S6B. In total, we found 916 cysteine sites on 765 proteins with IC50 values less than 2.5 mm in at least one cell line (supplemental Table S6). By comparing this H2O2-dependent redoxome with intrinsic thiol reactivity data set generated by Weerapana et al. (40), we found only ∼2.3% (21/916) of the H2O2-sensitive cysteines exhibited high or moderate reactivity (or rapid reaction kinetics with thiol reactive probe, supplemental Fig. S7). This finding suggested that the distinct site-specific target preference of H2O2 may not be dominated by the intrinsic reactivity of thiol proteome. In addition, it is important to note that these IC50 values only represent the effects of exogenously added H2O2 on thiol proteomes; the intracellular H2O2 concentration may be much lower (44). Regardless, the data set contains many well-known redox-sensitive proteins, including antioxidants (PRDX5, TXN2, and PARK7), protein tyrosine phosphatases (PTPN1), metabolic enzymes (GAPDH, PKM), and a DNA damage sensor (ATM). However, novel H2O2-sensitive sites comprise most of the data set (supplemental Table S6). We also developed a web portal database, OXID (http://redox.ncpsb.org/OXID/), as a compendium of proteome-wide analyses to identify and quantify oxidation-sensitive proteins.
Systems-level Analyses Reveal Cell-Specific Redoxome For Sensing H2O2
The data sets reveal that different cells display strikingly different and largely nonoverlapping H2O2 redoxomes (Fig. 2A). U2OS had the highest number of H2O2-sensitive cysteines (510), followed by A431 (360), HepG2 (152) and HEK293 (48). Ranking the IC50 values revealed that the top 20 most H2O2-sensitive cysteines in four cell lines are quite different (supplemental Fig. S8A). We also noted that the same cysteines could react differently with H2O2 in a cell-specific manner (supplemental Fig. S8B). For example, the catalytic cysteine (C100) of PRDX5 was found to be H2O2-sensitive only in HEK293 cells, the only non-cancer cell line used in this study. In another example, the active site of PTPN1 (PTP1B), Cys215, was moderately sensitive to H2O2 only in U2OS cells (IC50 = 2.1 mm). Considering that PTPN1 controls many key tyrosine dephosphorylation events, we next asked whether the cell-specific H2O2-sensitivity of PTPN1 could affect its cellular activity. To this end, we compared the changes of phosphorylation level on Y182 of p38 MAPK, a substrate of PTPN1 (45), in U2OS and HepG2 cells. As expected, p38 MAPK was phosphorylated upon H2O2 treatment in a dose-dependent manner in U2OS, but not in HepG2 cells (supplemental Fig. S8C). In addition, we found that many enzymes involved in histone lysine acetylation were H2O2-sensitive only in U2OS cells, such as EP300, HDAC1, and HDAC3. Gene Ontology (GO) classification also revealed enrichment of U2OS redoxome in chromatin organization (p = 1.76 × 10⁻⁵, FDR = 3.56 × 10⁻³) and histone modification (p = 3.42 × 10⁻⁴, FDR = 3.46 × 10⁻²) (Fig. 2B and supplemental Table S7). These findings suggested a potential link between H2O2 sensing and regulation of histone marks. To test this hypothesis, we used a label-free LC-MS/MS proteomic approach to identify and quantify several histone lysine acetylation events in cells (supplemental Table S8). Notably, we found that H2O2 treatment (1 mm, 30 min) significantly changed levels of acetylation on H2AK9, H2AK36, H2BK85, H3K4, H4K5, and H4K20 in U2OS cells, whereas no effects were observed on these sites in HepG2 cells upon the same treatment (Fig. 2C and supplemental Fig. S9).
Fig. 2.
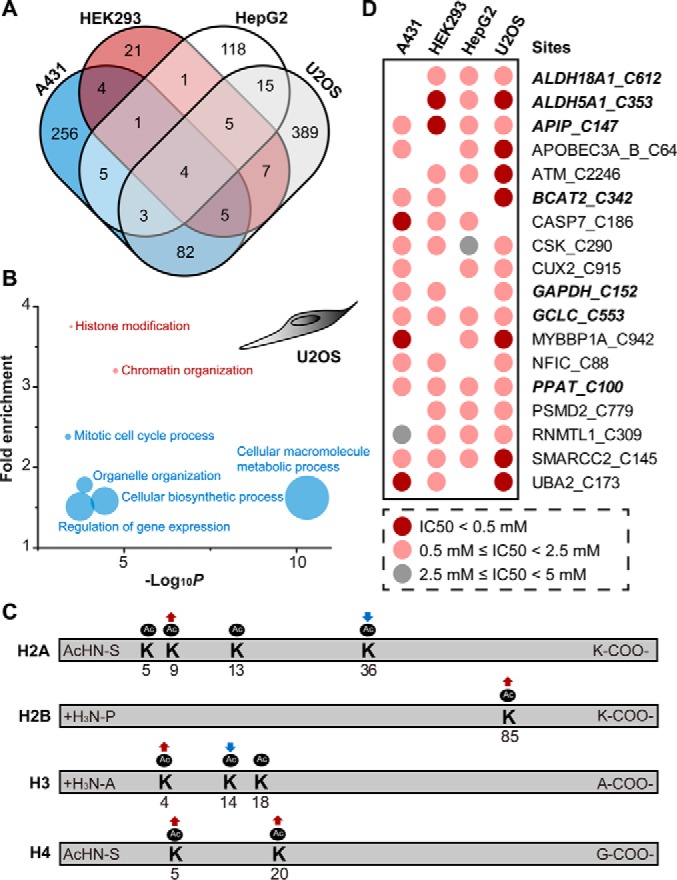
Cell-specific redoxome for sensing H2O2. A, Venn diagram showing the overlap of potential H2O2-sensitive cysteines (calculated IC50 values of H2O2 lower than 2.5 mM) identified in four cell lines. B, Significantly (p < 0.01, Fisher test, FDR < 0.05) enriched GO biological processes and terms from U2OS Redoxome. Each point is proportional in size to the number of H2O2-senstive proteins associated with the term. C, Effects of H2O2-dependent oxidation on histone lysine acetylation in U2OS cells. Detailed label-free proteomic quantification results are shown in supplemental Fig. S8. D, Heat map of cysteines with IC50 < 2.5 mM in at least three cell lines. Proteins related to small molecule metabolism and biosynthesis were shown in bold italic format.
We next asked whether differential H2O2-dependent redox sensing is also controlled by the status of cellular antioxidant systems. We compared the expression levels of several major antioxidant proteins in four tested cell lines. Notably, each cell line has a distinct expression pattern of these antioxidants (supplemental Fig. S8D). Moreover, U2OS cells produce a relatively low level of reducing capacity, including GSH/GSSG and NADP/NADPH systems (supplemental Fig. S8E–F), thereby explaining their susceptibility to oxidation. Together, these findings suggested that H2O2-sensing mediated by cysteines depends not only on intrinsic cysteinyl thiol reactivities, but also on broader characteristics of protein composition and networks in each specific cellular context.
Nonetheless, a small group of cysteines, which accounted for ∼0.3% of all quantifiable cysteines, was sensitive to H2O2 in at least three of the tested cell lines (Fig. 2D). Notably, many of these ubiquitous H2O2-sensitive cysteines are in enzymes related to small molecule metabolism and biosynthesis. These findings suggest that cysteines with key metabolic functions are conserved in H2O2 sensing. Interestingly, mounting evidence suggests that H2O2 can trigger cellular defensive response through metabolic reprograming. For example, the rapid accumulation of NADPH in response to H2O2 is generated by metabolic flux through oxidation of major glycolytic enzymes, such as GAPDH and PKM (8, 46). In addition, many proteins involved in branched chain amino acid (BCAA; i.e. leucine, isoleucine and valine) degradation are also H2O2-sensitive in most tested cell lines. Among these is a known H2O2 sensor, the branched chain aminotransferase BCAT2, which has a key redox-switch (C342-C345) (47). Inhibition of BCAA degradation is associated with increased energy expenditure and protein turnover, which is a well-recognized adaptive cellular response to oxidative stress (48, 49).
Although many known redox sensors and regulators were identified in our data set (supplemental Fig. S8B), we failed to identify the peroxidatic cysteines of four typical 2-Cys peroxiredoxins (PRDX1–4), the most H2O2-sensitive sites known. We measured the levels of overoxidation of 2-Cys PRDXs in four cell lines upon titrated H2O2 treatment using an antibody-based approach (50). We found that these first-line redox sensors became overoxidized in the range of 0.05–0.2 mm (supplemental Fig. S10A). However, only 4.2–11.8% of the H2O2-dependent redoxome changes were also triggered by relatively low level of H2O2 levels (< 0.2 mm); most H2O2 redox alterations did not occur until the 2-Cys PRDXs were extensively oxidized (supplemental Fig. S10B). This finding provides the first experimental evidence for the “floodgate model” proposed over a decade ago, in which 2-Cys PRDXs can act as a peroxide floodgate to keep resting levels of H2O2 low, yet permit higher levels during oxidative stress and redox signaling (51, 52).
Structural Determinants of Cysteine-mediated H2O2 Sensing
Because many known redox-sensitive cysteines are evolutionarily conserved across different species, we first investigated the evolutionary conservation of all the identified H2O2-sensitive cysteines (IC50 < 2.5 mm) using eggNOG multiple sequence alignments (26). Surprisingly, only ∼21.8% of H2O2-sensitive cysteines (such as C47 of PRDX6 and C152 of GAPDH) display a cysteine conservation ∼80% across disparate species, whereas conservation rates of most of the H2O2-sensitive cysteines are widely divergent. H2O2-sensitive cysteines were found to be less conserved than redox-insensitive cysteines (Fig. 3A), suggesting that the non-conserved H2O2-sensitive cysteines may have evolved more recently. Notably, emerging evidence suggests that H2O2 plays important roles in the development of multicellular microbial communities, which may take ∼1.5 billion years to arise from their single-cell ancestors (53). We therefore presumed that H2O2-sensing cysteines have co-evolved functionally with other redox/metabolic pathways.
Fig. 3.

Structural determinants of cysteine-mediated H2O2 sensing. A, Evolutionary analysis of H2O2-sensitive cysteines compared to insensitive counterparts. B, Sequence motif analysis of H2O2-sensitive cysteines. images were generated with plogo and scaled to the height of the largest column within the sequence visualization. The red horizontal lines on the plogo plots denote p = 0.05 thresholds. C, Comparison of calculated pKa values of H2O2-sensitive and insensitive cysteines from 25 proteins. pKa predictions were performed by PROPKA 3.0 from the experimental crystal structures. D, H2O2-dependent cysteine oxidation colocalization with other ptms occurring on lysine and arginine (P values were assessed by Chi-square test). E, Comparison of the RSA values of H2O2-sensitive and insensitive cysteines from the same protein structures as those used in (C). RSA values were calculated by GETAREA. F, INTERPRO domains associated with H2O2 targeting sites. For (A), (C), and (E), statistical significance was calculated with two sample t-tests.
Next, we examined flanking sequences of H2O2-sensitive cysteines with the pLogo algorithm for the presence of linear motifs (25). Interestingly, cysteine was under-represented in the ±3 position of the H2O2-sensitive sites identified in this study (Fig. 3B), although the CXXC motif is H2O2-sensitive on many known redox sensors, such as thioredoxins. This discrepancy may be explained by the moderate kinetic reactivity of the iodoacetamide-based probe, which probably cannot compete with the rapid formation of disulfide bond in the CXXC motif under our experimental conditions. Another interesting finding is that the basic amino acids such as lysine (K) and arginine (R) are over-represented at the adjacent position of the H2O2-sensitive sites (Fig. 3B). It is known that these positively charged residues act as hydrogen donors, which are capable of stabilizing thiolate anions, thereby reducing the pKa of the adjacent thiols. In principle, thiols with low pKa have higher reactivity at physiological pH, thus facilitating reaction of H2O2 with the thiolate anion (54). Using the PROPKA 3.0 algorithm (55), we calculated the pKa values of cysteines on 25 proteins with crystal 3D structures (supplemental Table S9). Indeed, the average predicted pKa of 26 H2O2-sensitive cysteines was 10.0 ± 2.1, which was slightly, but significantly lower than that of the remaining 130 H2O2-insensitive sites on the same proteins (pKa of 11.2 ± 2.3) (Fig. 3C). On the other hand, K/R residues are the targets of diverse PTMs (such as acetylation, methylation, or ubiquitination), which play key roles in the regulation of diverse cellular processes. Notably, cysteine oxidation status has already been linked to some of these PTMs (56, 57). In this regard, we next asked whether these H2O2 sensing events participate in crosstalk with PTMs on proximal K/R residues. Our analyses revealed that H2O2-sensitive cysteines colocalize with lysine acetylation and ubiquitination and arginine methylation, but not lysine methylation and sumoylation (Fig. 3D). Although this relationship suggests testable hypotheses, the mechanistic significance of these potential regulatory crosstalk relationships remains to be investigated.
We also estimated the residue surface accessibility (RSA) of all cysteines within the same protein structures (supplemental Table S9). Strikingly, 50% of H2O2-sensitive cysteines were calculated with an average RSA of 30.1%, whereas H2O2-insensitive cysteines within the same proteins exhibited much lower RSA (9.8%) (Fig. 3E), indicating that H2O2 preferentially targets cysteines in the most highly solvent-exposed areas of proteins.
Furthermore, we asked that whether these H2O2-sensitive sites fall into certain protein domains. Classification of these H2O2 sensors to known protein domains using InterPro indicated 19 H2O2-sensitive proteins contain zinc finger domains (Fig. 3F and supplemental Table S7), which are known to facilitate formation of cysteine thiolates (58). In addition, we identified other distinct domains which are overrepresented in our redoxome, including HEAT repeats (17), bromodomain (13), and helicase (17) (Fig. 3F). Domains formed by HEAT-repeats are important for the formation of protein-protein interactions and appear in many proteins involved in intracellular transport (59). Of interest, many HEAT-domain containing proteins, such as importins and exportins were found to be H2O2-sensitive, though their redox-regulatory roles in nuclear transport require further exploration.
Oxidation Triggers Conformational Changes of H2O2-sensitive Proteins
We identified and quantified the reactivity of the resolving cysteines of all four typical 2-Cys peroxiredoxins toward H2O2 (supplemental Fig. S11A). Surprisingly, we found the detected L/H ratios of these cysteines increased upon H2O2 treatment in at least one cell line, which suggested that the thiols on these resolving cysteines were more available under conditions of oxidative stress. This observation may be explained by the well-recognized catalytic mechanism of 2-Cys peroxiredoxins, which is illustrated by the crystal structures of reduced and oxidized human PRDX4 (supplemental Fig. S11B) (60, 61). In the reduced state of PRDX4, the conserved Cp loop forms a helix, positioning the peroxidatic cysteine (C124) in the buried active-site pocket; the resolving cysteine (C245) in the C-terminal arm is also buried. Upon H2O2 treatment, the buried C124 is oxidized to a cysteine sulfenic acid. The sulfenic acid formation subsequently unfolds the active site and converts the both peroxidatic and resolving cysteines into solvent-exposed sites. In agreement with this mechanism, the relative solvent accessibility of C124 and C245 on reduced PRDX4 was calculated as 0 and 0%, respectively. These values were dramatically increased to 27.1% and 52.9% in the oxidized form, respectively. Therefore, the resolving cysteines of the oxidized 2-Cys peroxiredoxins should be more readily available for chemical labeling than those of reduced forms. Notably, other typical 2-Cys peroxiredoxins also are subjected to dramatic conformational changes in order either to generate protective intermolecule disulfide bonds or to recruit sulfiredoxin (62).
This unexpected observation inspired us to find more cysteines whose solvent surface exposure was increased by oxidation-triggered conformational changes. We used K-means clustering to identify a small group of cysteines with responses to H2O2 like those of resolving cysteines of 2-Cys peroxiredoxins (supplemental Table S10). Among sites that exhibit this behavior are the two non-catalytic cysteines of GAPDH (C156 and C247). As shown in Fig. 4A–4B, < 0.2 mm H2O2 could induce dramatic increases in the L/H ratios of C156 and C247 on GAPDH. These ratios decrease as the concentration of H2O2 increases. According to the crystal structures of GAPDH, C152 is highly exposed on the protein surface, whereas C156 is deeply buried in a hydrophobic core. The distance between these two sites is ∼9 Å, which should prevent them from forming an intra-molecular disulfide bond (63). However, Rinalducci et al. identified the intra-molecule C152-C156 disulfide bond on GAPDH isolated from red blood cells formed during long-term storage (64). To further investigate whether C152 and C156 of GAPDH form intra-molecule disulfide linkage under short-term oxidation, we isolated the endogenous GAPDH from HEK293 cells treated with or without H2O2 and perform mass spectrometric analysis. Interestingly, we identified unequivocally a tryptic peptide containing C152–156 disulfide linkage from H2O2 treated cells, whereas the quantity of this peptide was much higher than in untreated samples, as measured by parallel reaction monitoring (PRM) (Fig. 4C–4D). These observations suggest that large conformational changes must occur for the GAPDH molecule to form C152–156 disulfide bond. This notion is supported by the changes of probe-labeling efficiency during GAPDH oxidation. Thus, we propose a possible mechanism of H2O2-induced intra-molecule disulfide bond formation on GAPDH. Upon H2O2 treatment, oxidation of C152 of GAPDH triggers a dramatic conformational change in the protein, which led two originally buried cysteines (C156 and C247) to be exposed and become accessible for further reaction. (i.e. disulfide bond formation or other oxidative modifications). The C152–156 disulfide bond formation induced by H2O2 could presumably prevent the key catalytic site of GAPDH from overoxidation. Taken together, the results suggest that H2O2-induced conformational changes may represent a common mode for avoidance of overoxidation in oxidation-sensitive proteins.
Fig. 4.

H2O2-dependent oxidation triggers dramatic structural changes of GAPDH. A, The measured light to heavy ratios of the peptides containing all three cysteines of GAPDH quantified by QTRP in four cell lines under H2O2 titration. C152, C156, and C247 were displayed in black, red, and blue color, respectively. B, Representative MS ion chromatograms from QTRP experiments for the peptides corresponding to all three cysteines of GAPDH in HEK293 cells. C, Representative MS/MS spectrum of a disulfide-bond (C152-C156) containing peptide from GAPDH in HEK293 cells. D, The PRM chromatographic traces of the disulfide-bond (C152-C156) containing peptide (lower) and its reduced form (upper; reduced cysteines were carbamidomethylated by iodoacetamide, depicted with asterisk) from endogenous GAPDH in HEK293 cells treated with or without H2O2. E, The relative abundance of GAPDH C152/C156 containing peptides in HEK293 cells treated with or without H2O2. To minimize the protein-level variation, the ratios of PRM peak areas of IISNAC152TTNC156LAPLAK in either disulfide bond or reduced form between H2O2-treated samples and controls were normalized with those obtained from an unmodified peptide (VIPELNGK) from GAPDH. For (A) and (E), data are presented as mean values ± S.D.; n = three biological replicates.
DISCUSSION
Here we have described a quantitative chemoproteomic strategy called QTRP (Fig. 1) to systematically investigate the reactions between H2O2 and proteomic cysteines in human cells. The analyses enabled discovery of a cohort of known and novel H2O2-sensitive cysteines and a proteome-wide comparison of their redox behavior in cells. Our most notable finding is that the H2O2-sensitive redoxome is highly variable between different cells. The cell redoxomes we analyzed shared a relatively small set of H2O2 sensors, consisting primarily of well-known antioxidants (peroxiredoxin and thioredoxin family) and metabolic enzymes (GAPDH, PKM2, BCAT2, and ALDH5A1). We hypothesize that this conserved redox-responsive antioxidant- and metabolism-regulating network combines with a much larger, more cell type-specific set of redox-sensitive cysteines to constitute the H2O2-sensitive redoxome. This hypothesis is consistent with the requirement that different cells must develop distinct redox sensing mechanisms to cope with diverse and dynamic environmental or metabolic stress conditions while accommodating a variety of differentiated cellular functions. This hypothesis is supported by our observation that most of H2O2-sensitive cysteines are not evolutionarily conserved and only a few cysteines with key roles in antioxidant and metabolic functions have been fixed during evolution.
Our analyses also suggest that the cysteine-mediated H2O2 sensing events in human cells are more complicated than previously anticipated. Because different cells usually display different phenotypic responses upon H2O2 stimulation, there are longstanding debates on the role of H2O2 in regulation of redox adaptive responses, such as oxidation reduction and proteostasis (65, 66). It is noteworthy that the oxidation-sensitive proteins involved in these biological processes may function in seemingly contradictory ways in cells treated with H2O2. For example, antioxidant enzymes, such as PRDX5 and TXN2, can be deactivated by overdose of H2O2. Meanwhile, H2O2-dependent inhibition of key metabolic enzymes (GAPDH, PKM2) may elevate cellular antioxidant responses by regulating the production of reducing equivalents such as NADPH (8, 46). Likewise, in the process of ubiquitin-mediated proteolysis, the deubiquitinating enzymes can be inhibited by H2O2, which results in accumulation of ubiquitinated proteins upon H2O2 treatment (67–69), whereas dissociation of the 26S proteasome mediated by H2O2 may compromise proteolysis of these ubiquitinated proteins (70). Thus, the phenotypic outcome of H2O2 stress in cells reflects the net effect of H2O2 on multiple sensors. We found that most H2O2 sensors exhibit quite different reactivities toward H2O2 in different cells, which results in the cell-specific phenotypic changes upon H2O2 treatment.
Besides many well-known redox sensors identified in the data set (supplemental Fig. S8B), our data contain many interesting leads for future functional studies. For example, we found that C779 of PSMD2, a regulatory subunit of the 26S proteasome, displays varying sensitivity to H2O2 in different cell contexts (Fig. 2D), suggesting a potential role of this site in regulation of H2O2-induced dissociation and inactivation of the 26S proteasome complex (70). Another ubiquitous target of H2O2 in human cells is C290 of C-terminal Src Kinase (CSK), which is an important regulator of the oncoprotein Src (Fig. 2D). CSK can interact with Src through an intermolecular disulfide bond in vitro (71). However, the biological purpose of this disulfide bond formation is largely unknown. Whether the H2O2-dependent C290 of CSK transduces this redox signal to Src or other downstream effectors in cells through intermolecular disulfide bond remains to be determined.
To better understand H2O2 sensing at a systems level, we performed bioinformatics and structural analysis of the data set, which uncovered previously unknown regulatory functions, crosstalk and distinct target preference of H2O2 (Fig. 2–3). Of interest, the analysis identified the potential crosstalk between H2O2-dependent cysteine oxidation and lysine acetylation by sequence proximity. In accordance with this finding, H2O2 was found to preferentially target bromodomains of several histone acetyltransferases, which is involved in transcriptional regulation through the recognition of acetyl lysine modifications on diverse proteins (72). Moreover, this potential crosstalk could be further confirmed by the observation of H2O2-induced perturbation on several histone lysine acetylation events in U2OS cells. H2O2 may also stimulate dynamic interplay between cysteine oxidation and other chemical modifications at the same site, such as S-ADP-ribosylation (73) and S-fatty-acylation (74). Another important feature of this study is that QTRP provides a new opportunity to predict conformational changes on certain H2O2 sensors, as illustrated by our evidence for an unexpected mode for avoidance of overoxidation of GAPDH. In combination with simple chemical tools that preferentially and stably label reactive groups of proteins, this chemoproteomics approach should be adapted to provide global and site-specific assessment of protein surface accessibility for studying dynamic structural change and interaction of proteins.
In conclusion, our quantitative chemoproteomic strategy has substantially expanded the scope of the observable redoxome and suggests a change in functional paradigm from a small set of conserved switches to a much larger, adaptable and cell type specific system. Our data set provides a basis for greatly expanded exploration of the complex networks controlled by H2O2-induced redox sensing, transduction and cellular adaptive responses. Recent advances in chemoproteomic strategy include the development of novel chemical probes for in vivo and/or organelle-specific labeling of thiol redox proteome (75, 76), as well as advances in mass spectrometry-based proteomics to increase sensitivity and throughput for analyzing probe-modified peptides. We foresee this strategy being used to further explore the dynamics of reactive thiol proteomes in numerous physiological and pathophysiological contexts.
Data Availability
The mass spectrometry proteomics data have been deposited to the ProteomeXchange Consortium via the PRIDE (77) partner repository with the data set identifier PXD007153 and 10.6019/PXD007153.
Supplementary Material
Footnotes
Author contributions: L.F. and C.M. performed the biochemical experiments; K.L. performed bioinformatics and structural analyses; C.T., R.S., and Y.Y. provided technical assistance; M.S. and D.G. developed the web portal of OXID; K.T. and N.P. synthesized the IPM probe and Azido-UV-biotin reagents; D.C.L. supervised the project and edited the manuscript. J.Y. conceived and supervised the project, designed and developed the chemoproteomic method, performed the biochemical experiments, analyzed the data and wrote the manuscript.
* Part of this work was supported by the National Key R&D Program of China (No. 2016YFA0501303), the National Natural Science Foundation of China (No. 31500666 and No. 81573395), the Beijing Natural Science Foundation (No.5162009), and Beijing Nova Program (No. Z171100001117014) to J.Y. and the National Institutes of Health (U24CA159988) to D.C.L.
 This article contains supplemental material.
1 The abbreviations used are:
- H2O2
- hydrogen peroxide
- ACN
- acetonitrile
- Az-UV-biotin
- azido biotin with a photocleavable linker
- BCA
- bicinchoninic acid
- CuAAC
- copper catalyzed azide-alkyne cycloaddition
- DMEM
- Dulbecco's modified eagle's medium
- DTT
- dithiothreitol
- FDR
- false discovery rate
- HCD
- high energy collisional dissociation
- GDH
- glucose dehydrogenase
- GSNO
- S-nitrosoglutathione
- GSH
- reduced glutathione
- GSSG
- oxidized glutathione
- GO
- gene ontology
- LC-MS/MS
- liquid chromatography-tandem mass spectrometry
- LDS
- lithium dodecyl sulfate
- IAM
- iodoacetamide
- IPM
- Iodo-N-(prop-2-yn-1-yl) acetamide
- isoTOP-ABPP
- isotopic tandem orthogonal proteolysis-activity based protein profiling
- NEM
- N-ethylmaleimide
- PBS
- phosphate buffered saline
- PTMs
- posttranslational modifications
- PVDF
- polyvinylidene difluoride
- RT
- room temperature
- SCX
- strong cation exchange
- TBST
- tris-buffered saline plus 0.05% Tween-20 (v/v)
- TBTA
- tris[(1-benzyl-1H-1,2,3-triazol-4-yl)methyl]amine.
REFERENCES
- 1. Giorgio M., Trinei M., Migliaccio E., and Pelicci P. G. (2007) Hydrogen peroxide: A metabolic by-product or a common mediator of ageing signals? Nat. Rev. Mol. Cell Biol. 8, 722–728 [DOI] [PubMed] [Google Scholar]
- 2. Holmstrom K. M., and Finkel T. (2014) Cellular mechanisms and physiological consequences of redox-dependent signalling. Nat. Rev. Mol. Cell Biol. 15, 411–421 [DOI] [PubMed] [Google Scholar]
- 3. Paulsen C. E., and Carroll K. S. (2013) Cysteine-mediated redox signaling: chemistry, biology, and tools for discovery. Chem. Rev. 113, 4633–4679 [DOI] [PMC free article] [PubMed] [Google Scholar]
- 4. Dickinson B. C., and Chang C. J. (2011) Chemistry and biology of reactive oxygen species in signaling or stress responses. Nat. Chem. Biol. 7, 504–511 [DOI] [PMC free article] [PubMed] [Google Scholar]
- 5. Wood Z. A., Schroder E., Robin Harris J., and Poole L. B. (2003) Structure, mechanism and regulation of peroxiredoxins. Trends Biochem. Sci. 28, 32–40 [DOI] [PubMed] [Google Scholar]
- 6. Rhee S. G., and Kil I. S. (2017) Multiple functions and regulation of mammalian peroxiredoxins. Annu. Rev. Biochem. [DOI] [PubMed] [Google Scholar]
- 7. Karisch R., Fernandez M., Taylor P., Virtanen C., St-Germain J. R., Jin L. L., Harris I. S., Mori J., Mak T. W., Senis Y. A., Ostman A., Moran M. F., and Neel B. G. (2011) Global proteomic assessment of the classical protein-tyrosine phosphatome and “redoxome”. Cell 146, 826–840 [DOI] [PMC free article] [PubMed] [Google Scholar]
- 8. Anastasiou D., Poulogiannis G., Asara J. M., Boxer M. B., Jiang J. K., Shen M., Bellinger G., Sasaki A. T., Locasale J. W., Auld D. S., Thomas C. J., Vander Heiden M. G., and Cantley L. C. (2011) Inhibition of pyruvate kinase M2 By reactive oxygen species contributes to cellular antioxidant responses. Science 334, 1278–1283 [DOI] [PMC free article] [PubMed] [Google Scholar]
- 9. Guo Z., Kozlov S., Lavin M. F., Person M. D., and Paull T. T. (2010) Atm activation by oxidative stress. Science 330, 517–521 [DOI] [PubMed] [Google Scholar]
- 10. Deng X., Weerapana E., Ulanovskaya O., Sun F., Liang H., Ji Q., Ye Y., Fu Y., Zhou L., Li J., Zhang H., Wang C., Alvarez S., Hicks L. M., Lan L., Wu M., Cravatt B. F., and He C. (2013) Proteome-wide quantification and characterization of oxidation-sensitive cysteines in pathogenic bacteria. Cell Host Microbe 13, 358–370 [DOI] [PMC free article] [PubMed] [Google Scholar]
- 11. Rosenwasser S., Graff Van Creveld S., Schatz D., Malitsky S., Tzfadia O., Aharoni A., Levin Y., Gabashvili A., Feldmesser E., and Vardi A. (2014) Mapping the diatom redox-sensitive proteome provides insight into response to nitrogen stress in the marine environment. Proc. Natl. Acad. Sci. U.S.A. 111, 2740–2745 [DOI] [PMC free article] [PubMed] [Google Scholar]
- 12. Yang J., Carroll K. S., and Liebler D. C. (2016) The expanding landscape of the thiol redox proteome. Mol. Cell. Proteomics 15, 1–11 [DOI] [PMC free article] [PubMed] [Google Scholar]
- 13. Lin D., Saleh S., and Liebler D. C. (2008) Reversibility of covalent electrophile-protein adducts and chemical toxicity. Chem. Res. Toxicol. 21, 2361–2369 [DOI] [PMC free article] [PubMed] [Google Scholar]
- 14. Yang J., Tallman K. A., Porter N. A., and Liebler D. C. (2015) Quantitative chemoproteomics for site-specific analysis of protein alkylation by 4-Hydroxy-2-nonenal in cells. Anal. Chem. 87, 2535–2541 [DOI] [PMC free article] [PubMed] [Google Scholar]
- 15. Yang J., Gupta V., Tallman K. A., Porter N. A., Carroll K. S., and Liebler D. C. (2015) Global, in situ, site-specific analysis of protein S-sulfenylation. Nat. Protoc. 10, 1022–1037 [DOI] [PMC free article] [PubMed] [Google Scholar]
- 16. Chambers M. C., Maclean B., Burke R., Amodei D., Ruderman D. L., Neumann S., Gatto L., Fischer B., Pratt B., Egertson J., Hoff K., Kessner D., Tasman N., Shulman N., Frewen B., Baker T. A., Brusniak M. Y., Paulse C., Creasy D., Flashner L., Kani K., Moulding C., Seymour S. L., Nuwaysir L. M., Lefebvre B., Kuhlmann F., Roark J., Rainer P., Detlev S., Hemenway T., Huhmer A., Langridge J., Connolly B., Chadick T., Holly K., Eckels J., Deutsch E. W., Moritz R. L., Katz J. E., Agus D. B., Maccoss M., Tabb D. L., and Mallick P. (2012) A cross-platform toolkit for mass spectrometry and proteomics. Nat. Biotechnol. 30, 918–920 [DOI] [PMC free article] [PubMed] [Google Scholar]
- 17. Kim S., And Pevzner P. A. (2014) Ms-Gf+ makes progress towards a universal database search tool for proteomics. Nat. Commun. 5, 5277. [DOI] [PMC free article] [PubMed] [Google Scholar]
- 18. Holman J. D., Ma Z. Q., And Tabb D. L. (2012) Identifying proteomic Lc-Ms/Ms data sets with bumbershoot and Idpicker. Curr. Protoc. Bioinformatics Chapter 13, Unit13 17 [DOI] [PMC free article] [PubMed] [Google Scholar]
- 19. Schilling B., Rardin M. J., Maclean B. X., Zawadzka A. M., Frewen B. E., Cusack M. P., Sorensen D. J., Bereman M. S., Jing E., Wu C. C., Verdin E., Kahn C. R., Maccoss M. J., and Gibson B. W. (2012) Platform-independent and label-free quantitation of proteomic data using Ms1 extracted ion chromatograms in skyline: application to protein acetylation and phosphorylation. Mol. Cell. Proteomics 11, 202–214 [DOI] [PMC free article] [PubMed] [Google Scholar]
- 20. Tabb D. L., Friedman D. B., and Ham A. J. (2006) Verification of automated peptide identifications from proteomic tandem mass spectra. Nat. Protoc. 1, 2213–2222 [DOI] [PMC free article] [PubMed] [Google Scholar]
- 21. Levsen K., Schiebel H. M., Behnke B., Dotzer R., Dreher W., Elend M., and Thiele H. (2005) Structure elucidation of phase II metabolites by tandem mass spectrometry: an overview. J. Chromatogr. A 1067, 55–72 [DOI] [PubMed] [Google Scholar]
- 22. Ernst J., Nau G. J., and Bar-Joseph Z. (2005) Clustering short time series gene expression data. Bioinformatics 21, I159–I168 [DOI] [PubMed] [Google Scholar]
- 23. Scholz C., Lyon D., Refsgaard J. C., Jensen L. J., Choudhary C., and Weinert B. T. (2015) Avoiding abundance bias in the functional annotation of post-translationally modified proteins. Nat. Methods 12, 1003–1004 [DOI] [PubMed] [Google Scholar]
- 24. Uhlen M., Fagerberg L., Hallstrom B. M., Lindskog C., Oksvold P., Mardinoglu A., Sivertsson A., Kampf C., Sjostedt E., Asplund A., Olsson I., Edlund K., Lundberg E., Navani S., Szigyarto C. A., Odeberg J., Djureinovic D., Takanen J. O., Hober S., Alm T., Edqvist P. H., Berling H., Tegel H., Mulder J., Rockberg J., Nilsson P., Schwenk J. M., Hamsten M., Von Feilitzen K., Forsberg M., Persson L., Johansson F., Zwahlen M., Von Heijne G., Nielsen J., and Ponten F. (2015) Proteomics. Tissue-based map of the human proteome. Science 347, 1260419. [DOI] [PubMed] [Google Scholar]
- 25. O'shea J. P., Chou M. F., Quader S. A., Ryan J. K., Church G. M., and Schwartz D. (2013) Plogo: a probabilistic approach to visualizing sequence motifs. Nat. Methods 10, 1211–1212 [DOI] [PubMed] [Google Scholar]
- 26. Huerta-Cepas J., Szklarczyk D., Forslund K., Cook H., Heller D., Walter M. C., Rattei T., Mende D. R., Sunagawa S., Kuhn M., Jensen L. J., Von Mering C., and Bork P. (2016) Eggnog 4.5: A hierarchical orthology framework with improved functional annotations for eukaryotic, prokaryotic and viral sequences. Nucleic Acids Res. 44, D286–D293 [DOI] [PMC free article] [PubMed] [Google Scholar]
- 27. Hornbeck P. V., Kornhauser J. M., Tkachev S., Zhang B., Skrzypek E., Murray B., Latham V., and Sullivan M. (2012) Phosphositeplus: a comprehensive resource for investigating the structure and function of experimentally determined post-translational modifications in man and mouse. Nucleic Acids Res. 40, D261–D270 [DOI] [PMC free article] [PubMed] [Google Scholar]
- 28. Fraczkiewicz R., and Braun W. (1998) Exact and efficient analytical calculation of the accessible surface areas and their gradients for macromolecules. J. Comp. Chem. 19, 319–333 [Google Scholar]
- 29. Olsson M. H., Sondergaard C. R., Rostkowski M., and Jensen J. H. (2011) Propka3: consistent treatment of internal and surface residues in empirical PKA predictions. J. Chem. Theory Comput 7, 525–537 [DOI] [PubMed] [Google Scholar]
- 30. Duan J., Gaffrey M. J., and Qian W. J. (2017) Quantitative proteomic characterization of redox-dependent post-translational modifications on protein cysteines. Mol. Biosyst. 13, 816–829 [DOI] [PMC free article] [PubMed] [Google Scholar]
- 31. Duan J., Kodali V. K., Gaffrey M. J., Guo J., Chu R. K., Camp D. G., Smith R. D., Thrall B. D., and Qian W. J. (2016) Quantitative profiling of protein S-glutathionylation reveals redox-dependent regulation of macrophage function during nanoparticle-induced oxidative stress. ACS Nano 10, 524–538 [DOI] [PMC free article] [PubMed] [Google Scholar]
- 32. Guo J., Nguyen A. Y., Dai Z., Su D., Gaffrey M. J., Moore R. J., Jacobs J. M., Monroe M. E., Smith R. D., Koppenaal D. W., Pakrasi H. B., and Qian W. J. (2014) Proteome-wide light/dark modulation of thiol oxidation in cyanobacteria revealed by quantitative site-specific redox proteomics. Mol. Cell. Proteomics 13, 3270–3285 [DOI] [PMC free article] [PubMed] [Google Scholar]
- 33. Guo J., Gaffrey M. J., Su D., Liu T., Camp D. G. 2nd, Smith R. D., and Qian W. J. (2014) Resin-assisted enrichment of thiols as a general strategy for proteomic profiling of cysteine-based reversible modifications. Nat. Protoc. 9, 64–75 [DOI] [PMC free article] [PubMed] [Google Scholar]
- 34. Su D., Gaffrey M. J., Guo J., Hatchell K. E., Chu R. K., Clauss T. R., Aldrich J. T., Wu S., Purvine S., Camp D. G., Smith R. D., Thrall B. D., and Qian W. J. (2014) Proteomic identification and quantification of S-glutathionylation in mouse macrophages using resin-assisted enrichment and isobaric labeling. Free Radic Biol. Med. 67, 460–470 [DOI] [PMC free article] [PubMed] [Google Scholar]
- 35. Yang J., Gupta V., Carroll K. S., and Liebler D. C. (2014) Site-specific mapping and quantification of protein S-sulphenylation in cells. Nat. Commun. 5, 4776. [DOI] [PMC free article] [PubMed] [Google Scholar]
- 36. Chen X., Wu H., Park C. M., Poole T. H., Keceli G., Devarie-Baez N. O., Tsang A. W., Lowther W. T., Poole L. B., King S. B., Xian M., and Furdui C. M. (2017) Discovery of heteroaromatic sulfones as a new class of biologically compatible thiol-selective reagents. ACS Chem. Biol. 12, 2201–2208 [DOI] [PMC free article] [PubMed] [Google Scholar]
- 37. Reisz J. A., Bechtold E., King S. B., Poole L. B., and Furdui C. M. (2013) Thiol-blocking electrophiles interfere with labeling and detection of protein sulfenic acids. FEBS J. 280, 6150–6161 [DOI] [PMC free article] [PubMed] [Google Scholar]
- 38. Backus K. M., Correia B. E., Lum K. M., Forli S., Horning B. D., Gonzalez-Paez G. E., Chatterjee S., Lanning B. R., Teijaro J. R., Olson A. J., Wolan D. W., and Cravatt B. F. (2016) Proteome-wide covalent ligand discovery in native biological systems. Nature 534, 570–574 [DOI] [PMC free article] [PubMed] [Google Scholar]
- 39. Wang C., Weerapana E., Blewett M. M., and Cravatt B. F. (2014) A chemoproteomic platform to quantitatively map targets of lipid-derived electrophiles. Nat. Methods 11, 79–85 [DOI] [PMC free article] [PubMed] [Google Scholar]
- 40. Weerapana E., Wang C., Simon G. M., Richter F., Khare S., Dillon M. B., Bachovchin D. A., Mowen K., Baker D., and Cravatt B. F. (2010) Quantitative Reactivity Profiling Predicts Functional Cysteines In Proteomes. Nature 468, 790–795 [DOI] [PMC free article] [PubMed] [Google Scholar]
- 41. Zhou Y., Wynia-Smith S. L., Couvertier S. M., Kalous K. S., Marletta M. A., Smith B. C., and Weerapana E. (2016) Chemoproteomic strategy to quantitatively monitor transnitrosation uncovers functionally relevant S-nitrosation sites on cathepsin D and Hadh2. Cell Chem Biol 23, 727–737 [DOI] [PMC free article] [PubMed] [Google Scholar]
- 42. Medina-Cleghorn D., Bateman L. A., Ford B., Heslin A., Fisher K. J., Dalvie E. D., and Nomura D. K. (2015) Mapping proteome-wide targets of environmental chemicals using reactivity-based chemoproteomic platforms. Chem. Biol. 22, 1394–1405 [DOI] [PMC free article] [PubMed] [Google Scholar]
- 43. Ford B., Bateman L. A., Gutierrez-Palominos L., Park R., and Nomura D. K. (2017) Mapping proteome-wide targets of glyphosate in mice. Cell Chem. Biol. 24, 133–140 [DOI] [PubMed] [Google Scholar]
- 44. Antunes F., and Cadenas E. (2000) Estimation of H2O2 gradients across biomembranes. FEBS Lett. 475, 121–126 [DOI] [PubMed] [Google Scholar]
- 45. Medgyesi D., Hobeika E., Biesen R., Kollert F., Taddeo A., Voll R. E., Hiepe F., and Reth M. (2014) The protein tyrosine phosphatase Ptp1b is a negative regulator of Cd40 and Baff-R signaling and controls B cell autoimmunity. J. Exp. Med. 211, 427–440 [DOI] [PMC free article] [PubMed] [Google Scholar]
- 46. Deng X., Liang H., Ulanovskaya O. A., Ji Q., Zhou T., Sun F., Lu Z., Hutchison A. L., Lan L., Wu M., Cravatt B. F., and He C. (2014) Steady-state hydrogen peroxide induces glycolysis in staphylococcus aureus and Pseudomonas aeruginosa. J. Bacteriol. 196, 2499–2513 [DOI] [PMC free article] [PubMed] [Google Scholar]
- 47. Conway M. E., Poole L. B., and Hutson S. M. (2004) Roles for cysteine residues in the regulatory Cxxc motif of human mitochondrial branched chain aminotransferase enzyme. Biochemistry 43, 7356–7364 [DOI] [PubMed] [Google Scholar]
- 48. She P., Reid T. M., Bronson S. K., Vary T. C., Hajnal A., Lynch C. J., and Hutson S. M. (2007) Disruption of Bcatm in mice leads to increased energy expenditure associated with the activation of a futile protein turnover cycle. Cell Metab. 6, 181–194 [DOI] [PMC free article] [PubMed] [Google Scholar]
- 49. Vogel C., Silva G. M., and Marcotte E. M. (2011) Protein expression regulation under oxidative stress. Mol. Cell. Proteomics 10, M111.009217. [DOI] [PMC free article] [PubMed] [Google Scholar]
- 50. Woo H. A., Kang S. W., Kim H. K., Yang K. S., Chae H. Z., and Rhee S. G. (2003) Reversible oxidation of the active site cysteine of peroxiredoxins to cysteine sulfinic acid. immunoblot detection with antibodies specific for the hyperoxidized cysteine-containing sequence. J. Biol. Chem. 278, 47361–47364 [DOI] [PubMed] [Google Scholar]
- 51. Wood Z. A., Poole L. B., and Karplus P. A. (2003) Peroxiredoxin evolution and the regulation of hydrogen peroxide signaling. Science 300, 650–653 [DOI] [PubMed] [Google Scholar]
- 52. Woo H. A., Chae H. Z., Hwang S. C., Yang K. S., Kang S. W., Kim K., and Rhee S. G. (2003) Reversing the inactivation of peroxiredoxins caused by cysteine sulfinic acid formation. Science 300, 653–656 [DOI] [PubMed] [Google Scholar]
- 53. Cap M., Vachova L., and Palkova Z. (2012) Reactive oxygen species in the signaling and adaptation of multicellular microbial communities. Oxid. Med. Cell Longev. 976753, 2012. [DOI] [PMC free article] [PubMed] [Google Scholar]
- 54. Winterbourn C. C. (2008) Reconciling the chemistry and biology of reactive oxygen species. Nat. Chem. Biol. 4, 278–286 [DOI] [PubMed] [Google Scholar]
- 55. Rostkowski M., Olsson M. H., Sondergaard C. R., and Jensen J. H. (2011) Graphical analysis of Ph-dependent properties of proteins predicted using Propka. BMC Struct. Biol. 11, 6. [DOI] [PMC free article] [PubMed] [Google Scholar]
- 56. Dansen T. B., Smits L. M., Van Triest M. H., De Keizer P. L., Van Leenen D., Koerkamp M. G., Szypowska A., Meppelink A., Brenkman A. B., Yodoi J., Holstege F. C., and Burgering B. M. (2009) Redox-sensitive cysteines bridge P300/Cbp-mediated acetylation and Foxo4 activity. Nat. Chem. Biol. 5, 664–672 [DOI] [PubMed] [Google Scholar]
- 57. Grune T., Merker K., Sandig G., and Davies K. J. (2003) Selective degradation of oxidatively modified protein substrates by the proteasome. Biochem. Biophys. Res. Commun. 305, 709–718 [DOI] [PubMed] [Google Scholar]
- 58. Matthews R. G., and Goulding C. W. (1997) Enzyme-catalyzed methyl transfers to thiols: the role of zinc. Curr. Opin. Chem. Biol. 1, 332–339 [DOI] [PubMed] [Google Scholar]
- 59. Andrade M. A., Petosa C., O'donoghue S. I., Muller C. W., and Bork P. (2001) Comparison of arm and heat protein repeats. J. Mol. Biol. 309, 1–18 [DOI] [PubMed] [Google Scholar]
- 60. Cao Z., Tavender T. J., Roszak A. W., Cogdell R. J., and Bulleid N. J. (2011) Crystal structure of reduced and of oxidized peroxiredoxin iv enzyme reveals a stable oxidized decamer and a non-disulfide-bonded intermediate in the catalytic cycle. J. Biol. Chem. 286, 42257–42266 [DOI] [PMC free article] [PubMed] [Google Scholar]
- 61. Perkins A., Parsonage D., Nelson K. J., Ogba O. M., Cheong P. H., Poole L. B., and Karplus P. A. (2016) Peroxiredoxin catalysis at atomic resolution. Structure 24, 1668–1678 [DOI] [PMC free article] [PubMed] [Google Scholar]
- 62. Jonsson T. J., Johnson L. C., and Lowther W. T. (2008) Structure of the sulphiredoxin-peroxiredoxin complex reveals an essential repair embrace. Nature 451, 98–101 [DOI] [PMC free article] [PubMed] [Google Scholar]
- 63. Peralta D., Bronowska A. K., Morgan B., Doka E., Van Laer K., Nagy P., Grater F., and Dick T. P. (2015) A proton relay enhances H2O2 Sensitivity Of GAPDH to facilitate metabolic adaptation. Nat Chem Biol 11, 156–163 [DOI] [PubMed] [Google Scholar]
- 64. Rinalducci S., Marrocco C., and Zolla L. (2015) Thiol-based regulation of glyceraldehyde-3-phosphate dehydrogenase in blood bank-stored red blood cells: a strategy to counteract oxidative stress. Transfusion 55, 499–506 [DOI] [PubMed] [Google Scholar]
- 65. Mitozo P. A., De Souza L. F., Loch-Neckel G., Flesch S., Maris A. F., Figueiredo C. P., Dos Santos A. R., Farina M., and Dafre A. L. (2011) A study of the relative importance of the peroxiredoxin-, catalase-, and glutathione-dependent systems in neural peroxide metabolism. Free Radic Biol. Med. 51, 69–77 [DOI] [PubMed] [Google Scholar]
- 66. Hanzen S., Vielfort K., Yang J., Roger F., Andersson V., Zamarbide-Fores S., Andersson R., Malm L., Palais G., Biteau B., Liu B., Toledano M. B., Molin M., and Nystrom T. (2016) Lifespan control by redox-dependent recruitment of chaperones to misfolded proteins. Cell 166, 140–151 [DOI] [PubMed] [Google Scholar]
- 67. Lee J. G., Baek K., Soetandyo N., and Ye Y. (2013) Reversible inactivation of deubiquitinases by reactive oxygen species in vitro and in cells. Nat. Commun. 4, 1568. [DOI] [PMC free article] [PubMed] [Google Scholar]
- 68. Kulathu Y., Garcia F. J., Mevissen T. E., Busch M., Arnaudo N., Carroll K. S., Barford D., and Komander D. (2013) Regulation of A20 and other Otu deubiquitinases by reversible oxidation. Nat. Commun. 4, 1569. [DOI] [PMC free article] [PubMed] [Google Scholar]
- 69. Cotto-Rios X. M., Bekes M., Chapman J., Ueberheide B., and Huang T. T. (2012) Deubiquitinases As a signaling target of oxidative stress. Cell Rep. 2, 1475–1484 [DOI] [PMC free article] [PubMed] [Google Scholar]
- 70. Wang X., Yen J., Kaiser P., and Huang L. (2010) Regulation of the 26s proteasome complex during oxidative stress. Sci. Signal. 3, Ra88. [DOI] [PMC free article] [PubMed] [Google Scholar]
- 71. Kemble D. J., and Sun G. (2009) Direct and specific inactivation of protein tyrosine kinases in the Src and Fgfr Families By Reversible Cysteine Oxidation. Proc. Natl. Acad. Sci. U.S.A. 106, 5070–5075 [DOI] [PMC free article] [PubMed] [Google Scholar]
- 72. Fujisawa T., and Filippakopoulos P. (2017) Functions of bromodomain-containing proteins and their roles in homeostasis and cancer. Nat. Rev. Mol. Cell Biol. 18, 246–262 [DOI] [PubMed] [Google Scholar]
- 73. Westcott N. P., Fernandez J. P., Molina H., and Hang H. C. (2017) Chemical proteomics reveals ADP-ribosylation of small gtpases during oxidative stress. Nat Chem Biol 13, 302–308 [DOI] [PMC free article] [PubMed] [Google Scholar]
- 74. Burgoyne J. R., Haeussler D. J., Kumar V., Ji Y., Pimental D. R., Zee R. S., Costello C. E., Lin C., Mccomb M. E., Cohen R. A., and Bachschmid M. M. (2012) Oxidation of Hras cysteine thiols by metabolic stress prevents palmitoylation in vivo and contributes to endothelial cell apoptosis. Faseb J 26, 832–841 [DOI] [PMC free article] [PubMed] [Google Scholar]
- 75. Abo M., and Weerapana E. (2015) A caged electrophilic probe for global analysis of cysteine reactivity in living cells. J. Am. Chem. Soc. 137, 7087–7090 [DOI] [PubMed] [Google Scholar]
- 76. Abo M., Bak D. W., and Weerapana E. (2017) Optimization of caged electrophiles for improved monitoring of cysteine reactivity in living cells. Chembiochem 18, 81–84 [DOI] [PMC free article] [PubMed] [Google Scholar]
- 77. Vizcaino J. A., Csordas A., Del-Toro N., Dianes J. A., Griss J., Lavidas I., Mayer G., Perez-Riverol Y., Reisinger F., Ternent T., Xu Q. W., Wang R., and Hermjakob H. (2016) 2016 Update of the pride database and its related tools. Nucleic Acids Res. 44, 11033. [DOI] [PMC free article] [PubMed] [Google Scholar]
Associated Data
This section collects any data citations, data availability statements, or supplementary materials included in this article.
Supplementary Materials
Data Availability Statement
The mass spectrometry proteomics data have been deposited to the ProteomeXchange Consortium via the PRIDE (77) partner repository with the data set identifier PXD007153 and 10.6019/PXD007153.