Figure 3.
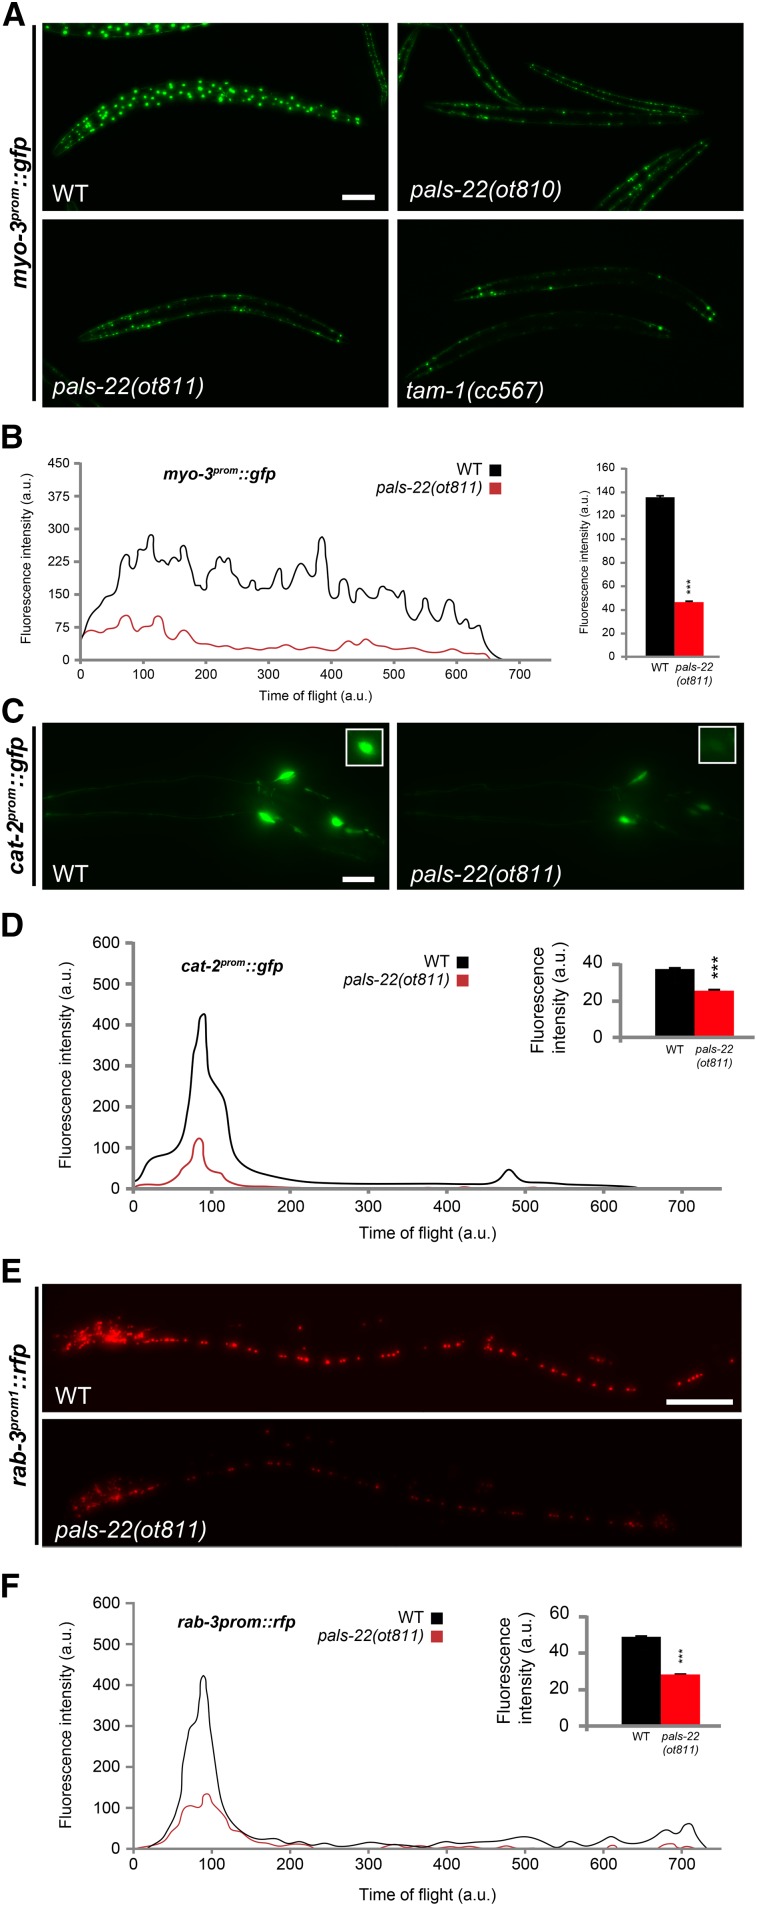
pals-22 mutants show silencing of several multicopy arrays. (A) The myo-3prom::gfp transcriptional reporter is brightly expressed in all body muscles in wild-type (WT) N2 worms, with a combination of mitochondrial and nuclear localization. In pals-22(ot810), pals-22(ot811), and tam-1(cc567) mutants, a generalized reduction in GFP fluorescence is observed. All images correspond to L4 worms. Bar, 50 µm. (B) Fluorescence profile of a representative individual day 1 adult worm expressing myo-3prom::gfp in WT (black line) or pals-22(ot811) mutant background (red line) obtained with a COPAS FP-250 system. Time of flight indicates worm length, with lower values corresponding to the head of the worms. a.u., arbitrary units. Inset bar graph displays quantification of total fluorescence intensity averaged over 1000 animals analyzed by COPAS. The data are presented as mean + SEM. Unpaired t-tests were performed for pals-22(ot811) compared to WT; *** P < 0.001. (C) GFP images showing silencing of cat-2prom::gfp expression in the head of pals-22(ot811) mutants (right) compared to WT L4 worms (left). The cat-2prom::gfp transcriptional reporter is expressed in all dopamine neurons: CEPD, CEPV, and ADE in the head, and PDE in the posterior midbody (top right insets). Bar, 10 µm. (D) Fluorescence profile of a representative individual day 1 adult worm expressing cat-2prom::gfp in WT (black line) or pals-22(ot811) mutant background (red line) obtained with a COPAS FP-250 system. Time of flight indicates worm length, with lower values corresponding to the head of the worms. a.u., arbitrary units. Inset bar graph displays quantification of total fluorescence intensity averaged over 1000 animals analyzed by COPAS. The data are presented as mean + SEM. Unpaired t-tests were performed for pals-22(ot811) compared to WT; *** P < 0.001. (E) Red fluorescent protein images showing silencing of rab-3prom1::rfp expression in the head of pals-22(ot811) mutants (right) compared to WT L4 worms (left). (F) Fluorescence profile of a representative individual day 1 adult worm expressing rab-3prom1::rfp in WT (black line) or pals-22(ot811) mutant background (red line) obtained with a COPAS FP-250 system. Time of flight indicates worm length, with lower values corresponding to the head of the worms. a.u., arbitrary units. Inset bar graph displays quantification of total fluorescence intensity averaged over 1000 animals analyzed by COPAS. The data are presented as mean + SEM. Unpaired t-tests were performed for pals-22(ot811) compared to WT; *** P < 0.001.

