

Abstract
Visual textures are a class of stimuli with properties that make them well-suited for addressing general questions about visual function at the levels of behavior and neural mechanism. They have structure across multiple spatial scales, they put the focus on the inferential nature of visual processing, and they help bridge the gap between stimuli that are analytically convenient and the complex, naturalistic stimuli that have the greatest biological relevance. Key questions that are well-suited for analysis via visual textures include the nature and structure of perceptual spaces, modulation of early visual processing by task, and the transformation of sensory stimuli into patterns of population activity that are relevant to perception.
Keywords: spatial vision, image statistics, segmentation, perceptual spaces, visual mechanisms, top-down modulation
Introduction
Visual texture is a pervasive aspect of what we see: it is the visual consequence of the fact that objects and surfaces are made out of distinctive materials. Indeed, images of the real world can be thought of as having two complementary components: objects and “stuff” – wood, skin, fabric, etc. (Adelson 2001). Just as information about objects is primarily conveyed by their shape, information about “stuff” is primarily conveyed by visual texture (Adelson 2001, Motoyoshi et al. 2007). This partition, though, is far from absolute: visual texture also conveys information about shape – for example, discontinuities indicate object boundaries (Schmid & Victor 2014), and distortions of textures indicate 3D slant (Li & Zaidi 2000, Li & Zaidi 2004) and curvature (Todd et al. 1997, Todd et al. 2004).
Independent of these varied and critical roles of visual texture in scene analysis, the domain of visual textures is an important system for the experimental study of visual processing and sensory coding in general. This is especially the case when the term “visual texture” is expanded, as it commonly is, to include artificial images that have texture-like qualities. Figure 1 serves to provide a glimpse of the variety of images that are included in this broadened meaning: artificial textures in Figure 1A–P, R, and T, and natural textures in Figure 1Q and S. We will discuss these examples in more detail below.
Figure 1.

The diversity of visual textures. A: Micropattern texture constructed according to the algorithm of (Julesz 1962), Figure 9. B: Micropattern texture of (Julesz et al. 1973). C and D: First- and second-order Markov textures, constructed according to the algorithms of (Julesz 1962) Figures 3 and 5. E and F: Isotripole textures, constructed according to the fourth-order Markov algorithm of (Julesz et al. 1978), Figures 3 and 4. G and H: Isodipole micropattern textures constructed according to the algorithms of (Caelli & Julesz 1978), Figure 5, and (Caelli et al. 1978), Figure 7. I, J, and K: IID textures with polynomial modulators of degree 1, 2, and 3, constructed according to the method of (Chubb et al. 2007), Figure 2. L: Line-token micropattern texture, similar to that of (Nothdurft & Li 1985) and (Wolfson & Landy 1995). M: Gabor micropattern texture, constructed by the method of (Graham et al. 1993), Figure 8. N and O: Compound grating textures with a single orientation (N) and 8 directions (“octotropic plaid”), constructed according to the method of (Li & Zaidi 2000) Figures 8 and 6. P: Isotropic Gaussian noise with three frequency bands, constructed according to the method of (Gurnsey & Fleet 2001) Figure 1. Q–T: Photographic textures (Q and S) and matching synthetic textures (R and T), from (Portilla & Simoncelli 2000), Figures 4 and 6, reproduced with permission of the publisher. Panels A, B, G, H, and L show a background texture with a contrasting texture in a square “target” region on the lower right. Panels C–F, I–K, and M show contrasting textures in bipartite fields. The remaining panels (N–T) show a single texture throughout the field.
We take the viewpoint of textures as probes of vision not only for historical and conceptual reasons, but also in the hope that it will entice vision scientists to make greater use of this domain. We focus on the questions one can ask and the kinds of answers one can expect to obtain. In particular, we examine how textures may be used to gain insight into the general computations carried out in early vision and how they are modulated by top-down influences. We first consider psychophysical approaches and then turn to neurophysiological investigations. In broad strokes, the former addresses the “algorithmic” level and the latter the “implementation” level (Marr 1982) – and both highlight the many ways that textures are valuable tools for the study of vision.
There are several related reasons why visual textures are effective probes for analyzing the psychophysics and neurophysiology of visual processing. Perhaps the most fundamental reason is that the ability to test models depends on the diversity of stimuli used to probe them. By combining elements of structure and randomness, textures fill an analytical gap in the stimulus sets we have to study visual processing. On the one hand, elementary stimuli such as gratings and random stimuli such as white noise provide mathematically principled ways to analyze early visual processing. However, both approaches fail beyond the initial cortical stages, because such stimuli rarely contain the features to which extrastriate neurons are tuned. Natural scenes, on the other hand, contain such features, but the complex structure of natural stimuli – for example, that some kinds of features tend to occur together – makes it difficult to identify the computations that produce neuronal responses. Visual textures provide a path forward: by manipulating the structured components of a visual texture, one can create stimuli that are enriched to emphasize a specific set of features.
A second aspect of the utility of textures is that gathering information from textures necessarily requires rapid integration across space, a key aspect of early visual processing in general. Texture-based paradigms can be used to probe the extent and specificity of mechanisms that underlie this integration (Victor & Conte 1989), with the expectation that the characteristics that are identified apply to spatial vision in general.
Finally, judgments based on textures require statistical inference. This too is an essential part of visual processing: determining the scene that generated an image is necessarily an ill-posed problem and useful judgments can only be made by combining the incoming visual information with a set of priors. Because the visual texture paradigm explicitly requires judgments that are made based on statistics, this crucial aspect of vision remains in the forefront.
Historical background: probing visual mechanisms with texture
The recognition that studies of texture perception can provide insight into general computational mechanisms underlying vision has its origins in Bela Julesz’ work, more than 50 years ago (Julesz 1962). Julesz not only established this overall context, but also produced many insights and techniques that have stood the test of time. This body of work is well-known for two ideas – the notion of “preattentive processing” (Julesz 1981a, Julesz 1981b) and the Julesz Conjecture (Julesz 1962, Julesz et al. 1973). Each of these ideas opened up fertile domains of research, which we selectively describe in later sections. Subsequent studies, including those of Julesz himself, led to substantial revision and refinement of both ideas, which nevertheless remain pre-eminent in shaping the field.
Many of Julesz’s studies were based on textures built from micropatterns – i.e., arrays consisting of repeated placement of a small token, possibly with some jitter or variation in orientation (Fig. 1A,B, G, and H). He observed that often, a texture patch built from one micropattern could be readily segmented from a background texture built from a different micropattern (e.g., Figs. 1A, G, and H), but only if these micropatterns differed along specific dimensions (Julesz 1962, Julesz 1981a, Julesz 1981b, Julesz & Bergen 1983, Julesz et al. 1973) (e.g., not in Fig. 1B). Similarly, subjects could quickly identify the location of a single unique element within a large array of contrasting elements, but only if this element differed from its neighbors along specific dimensions – such as its orientation (Julesz 1981a, Julesz 1981b). He reasoned that since these tasks – texture segmentation and “pop-out” (Bergen & Julesz 1983, Julesz & Bergen 1983)—appeared to be performed automatically and without effort (in contrast to conjunctive feature search, (Treisman & Gelade 1980)), they did not require attention, and therefore designated them “preattentive” processing. However, later studies – using dual tasks – showed that at least some attentional resources are required (Joseph et al. 1997). As we describe below, this observation that attention is involved in texture processing opened the door to the use of textures to study how top-down influences can affect earlier processing.
An intriguing aspect of these early studies was that in most cases, the feature dimensions that supported these tasks could be described in simple mathematical terms – “first-order” or “second-order” statistics (see Glossary) (Julesz 1962, Julesz 1981a, Julesz 1981b, Julesz et al. 1973). The functional relevance of this observation is that simple linear spatial filtering, as performed either by idealized center-surround retinal ganglion cell outputs, or oriented filters in primary visual cortex, could extract these statistics, provided that the population responses were pooled in a quadratic fashion. The strong form of this observation – that texture segmentation and “pop-out” could only be supported by first- or second-order statistics – became known as the “Julesz Conjecture”(Victor 1994a, Yellott 1993). However, Julesz himself recognized early on (Caelli & Julesz 1978, Caelli et al. 1978, Julesz 1962, Julesz et al. 1973) that the Julesz Conjecture was false (e.g., Fig. 1 E–H).
Importantly, the exceptions to the conjecture appeared to relate to visual features that were (and are) believed to be extracted in visual cortex, beyond extraction of orientation: features such as connectivity and clumping (Julesz 1962), collinearity (Fig. 1G), and closure (Caelli & Julesz 1978, Caelli et al. 1978) (Fig. 1H). Julesz and colleagues (Julesz 1962, Julesz 1981a, Julesz et al. 1973) pointed out that some of these features could be extracted by mechanisms that extracted first- or second-order features, provided that they acted on a pre-processed version of the image, rather than on the raw image itself. Thus, although the “Julesz Conjecture” does not hold, the texture paradigm supported the broader notion that specific image statistics are extracted by local, parallel processing, with different kinds of image statistics extracted as processing unfolds.
Later work, using texture synthesis strategies based on Markov random fields (Gilbert 1980) and other means (Julesz et al. 1978, Victor & Brodie 1978) identified many further examples of specific types of higher-order statistics that support texture segregation (Fig. 1E, F), as well as large classes of higher- order statistics that do not (Victor & Conte 1991). Recent physiological studies have shown that the perceptually-relevant high-order statistics are indeed extracted by visual cortex, primarily in V2 (Yu et al. 2015)
What is a visual texture?
At first it might seem that the term “visual texture” does not need definition, as its intuitive meaning, a visual image of a material texture (see for example Fig. 1Q, S), would seem to suffice. However, this term has come to denote a much larger class of visual images, most of which do not correspond to images of natural materials (Caelli & Julesz 1978, Caelli et al. 1978, Chubb et al. 1994, Graham 1989, Julesz 1962, Landy & Bergen 1991, Landy & Oruc 2002, Nothdurft 2000, Sutter et al. 1995, Victor & Brodie 1978, Victor et al. 2015) – see Fig. 1 A–P for examples. The justification for the use of the term “visual texture” for these artificially-constructed stimuli is that they capture an essential feature of natural visual textures: an image in which distinctive local features are arranged in a spatially extended fashion.
Typically, a texture involves a mixture of order and disorder, but the nature of this mixture can take many forms. One kind of mixture is shown in Figs. 1B, G, H, and L : these images consist of stereotyped elements arranged on a grid, but the elements are in random orientations. Another kind of mixture is shown in Figs. 1C, I, J, and K: each half of the image is characterized a specific distribution of gray values, but individual pixel values are drawn randomly from this distribution. A third kind of mixture is shown in Figs. 1E and F: these images are generated by specifying the margins in a random fashion, and then applying a deterministic rule to fill the interior. Yet another kind of mixture is shown in Figs. 1N, O, and P: here, the visual structure is determined by the choice of specific spatial frequencies and their orientations, but their phases are chosen at random.
A definition of visual texture
Despite this variety, it is possible to frame a definition that encompasses these (and other) hybrids of structure and randomness, while excluding others – for example, an image of a specific face – that, intuitively, we would not want to consider to be a “texture.” The basic idea that we would like to capture is that, much as a small sample swatch of material conveys the properties of the entire unseen bolt, a single image of a visual texture conveys the properties of a much larger collection of images. Put another way, one can recognize a sample of material without having seen that particular example. So a visual texture is not just a single image, but rather, an ensemble of images, along with a way to sample this ensemble to obtain other individual images that typify it. This criterion– that individual samples typify the larger collection – is the key component of many authors’ definitions of texture (Portilla & Simoncelli 2000, Victor 1994b, Zhu et al. 1998). In many other studies of texture – including the seminal work of Julesz, this idea is not made explicit, but the methods of texture construction guarantee that it holds.
Formalizing this notion rests on the concept of an “image statistic.” In essence, an image statistic is a mathematically-defined feature of an image, or an ensemble (collection) of images. For example, the mean luminance value is an image statistic; another simple image statistic is the fraction of pixels in an image that have a specific gray-level value. These image statistics can be computed by examining the luminance of one point at a time, and are therefore called “first-order.” Other image statistics require examining the luminance at two or more points of an image simultaneously. For example, spatial correlations can be captured by the average value of the product of the luminance at two image points separated by a given displacement – this is an example of a second-order statistic because it requires examining two points in the image simultaneously.
As these examples show, determining the value of the image statistic entails an averaging process, such as computing a mean or computing a probability. This averaging process can be carried out in two contrasting ways. One can draw a sample image from the ensemble and compute the average over that sample. Alternatively, one can choose a single location in space, and compute the average over all samples in the ensemble, focusing at that particular location. The core property of a visual texture is that these two kinds of averages – a spatial average within an image, and an average across the ensemble – yield identical results. With some additional formalism that we suppress here, this mathematical property is “ergodicity.”
We emphasize that although a single image is often used to illustrate a visual texture, doing so requires knowledge (often implicit) about how this image is representative of an ensemble. For example, a sine grating could be taken as a representative of an ensemble consisting of sine gratings at random spatial phases. Similarly, an array of line segments whose orientations are either horizontal or vertical is an example drawn from an ensemble of images, each of which is independently created in this fashion.
At first glance it might appear that our definition would exclude textures generated by placing tokens on a regular grid, because ensemble averages computed at the grid points will not match ensemble averages computed at points in the gaps. However, we can include this important class of stimuli within the definition by requiring that the ensemble randomizes over all starting positions of the grid. With this understanding, the present formalization of visual texture, along with the extensions mentioned below, includes most of the stimuli that are typically called “textures”, while avoiding the paradoxes that arise if a texture were taken to mean an individual image (Victor 1994a, Yellott 1993). Additionally, there is direct experimental evidence that in carrying out texture-based tasks, humans in fact form internal representations of ensembles, rather than individual examples (Victor & Conte 2004, Victor & Conte 2006).
Our definition implies that visual textures are spatially homogeneous in a statistical sense: ensemble averages at each location must all match the average across space, and therefore, must match each other. As a consequence, visual textures must be infinite in spatial extent– or at least the algorithm for generating examples of images must be extensible to arbitrarily large regions. The requirement for spatial homogeneity eliminates from the definition the kinds of collections that we would not want to consider textures – such as collections of natural scenes or of faces. These collections do not conform to the definition of texture because their statistical properties differ across space: for example, statistics determined by averaging over the upper halves of all images will not be the same as statistics determined from the lower halves. Haphazard collections – for example, an ensemble consisting of a face, a teapot, a house, and a Gabor patch – are also not visual textures, for the same reason.
Finally, the concept of a visual texture has implications for experimental design. Because visual textures are ensembles, studies of responses to a visual texture require some kind of sampling of this ensemble. That is, experiments necessarily consist of a sequence of trials, in which different examples of a texture are presented on each trial. Because of the defining property of textures – that spatial and ensemble averages are equivalent – we can think of this sampling either as choosing different finite regions within an infinite image, or, by choosing the same region within a randomly-chosen image.
Extensions of the definition
The above definition of visual texture can be extended in several ways. First, while we focus here on grayscale images, the notion of image statistics and therefore visual texture extends immediately to chromatic and even hyperspectral images. The variety of image statistics is now much greater, as each pixel is represented by a list of scalars (one for each chromatic or spectral channel), rather than by a single grayscale value (Hansen et al. 2008, Li & Lennie 1997, te Pas & Koenderink 2004). Similarly, the notion of a static visual texture extends to that of a texture movie: the image is an array with two dimensions for space and one for time (Hu & Victor 2010).
It is also often useful to modify the requirement that image statistics computed across the ensemble are homogeneous globally to the more relaxed requirement that they are homogeneous over suitably-specified local regions. The motivation for this is the following. Consider a smooth 3D object that is “painted” with an example of a visual texture. Because of the object’s 3D shape, each portion of the surface will have a different tilt with respect to the viewer, and these tilts will each distort the projection of the surface texture onto the image plane. Observers are able to use this gradually changing texture to draw inferences about 3D shape (Li & Zaidi 2004, Todd et al. 1997, Todd et al. 2004), demonstrating that they can estimate image statistics locally.
The domain of textures
Textures form a diverse domain. Not only do they vary along all of the traditional parameters used to define visual stimuli – such as luminance, contrast, spatial frequency, and orientation, but even within one of these parameters, there are a wealth of possibilities. For example, textures can differ not only in their mean luminance or contrast, but in any aspect of the distribution of luminance values, such as its skewness, or the prevalence of a specific gray level. Similarly, textures can differ not only in their dominant orientation, but also, in the extent to which orientations vary; they may even have multiple dominant orientations, as in the octotropic plaids (Fig. 1O) of Li and Zaidi (Li & Zaidi 2000).
Moreover, the examples of Figure 1 show that textures may also vary in ways that are not captured by these traditional parameters – such as naturalness or artificiality, and regularity vs. randomness. For textures that are derived from (or appear to be derived from) images of natural material, verbal descriptions (Bhushan et al. 1997) corresponding to material properties (e.g., glossy vs. matte, soft vs. hard, rough vs. smooth) appear appropriate, but the verbal repertoire is somewhat limited (Bhushan et al. 1997) and verbal descriptions may not be fully satisfactory.
Informally, each of the parameters needed to specify a texture can be considered to be a “dimension” of the domain. However, the correspondence is inexact, because although the parameters represent degrees of freedom, they are not necessarily independent. The origin of these dependencies is that the probabilities in a distribution must add up to 1, and, more subtly, that lower moments of a distribution constrain higher ones. The former leads to linear interdependencies among the parameters; the latter, more problematically, leads to nonlinear interdependencies. A useful geometric view of this situation is that the texture parameters may be thought of as coordinates, but the axes for these coordinates are curved: changing the value of one parameter may necessitate changing the value of another.
Specifying and constructing textures
The variety of texture parameters, along with their interdependencies, leads to two related technical problems. How should a texture be specified? And, how are those specifications translated into construction of texture samples? We consider two overall classes of approaches here: strategies that are applicable when the interdependencies among texture parameters are simple to control, and strategies that attempt to deal with more complex interdependencies. In addition to strategies developed for the purpose of probing the visual system, we also mention strategies that have been developed in the computer graphics community (Bar-Joseph et al. 2001, DeBonet & Viola 1997, Efros & Leung 1999, Xu et al. 2000). Although the primary motivation for these techniques is to fill in or reproduce a texture sample in a way that is visually acceptable, these methods also provide valuable tools to probe the visual system, especially when naturalistic textures are of interest.
Perhaps the simplest way to control the interdependencies of the texture parameters is to restrict the range of spatial correlations. The extreme case is that there are no correlations between pixels. That is, the luminance assigned to each pixel is independently drawn from a specified distribution; this mathematical description both defines the texture and is an explicit algorithm for texture generation. An alternate but essentially equivalent construction is the “scramble” texture: pixels are colored to match a distribution exactly, and then spatially scrambled (Chubb et al. 2004, Chubb & Nam 2000). Examples are shown in Fig. 1C, I, J, and K.
A somewhat less-restrictive strategy allows for spatial correlations, but only over a limited range. At each point in a grid, a micropattern is randomly chosen from a library. The library might consist (for example) of line segments(Fig. 1L) (Wolfson & Landy 1999), tokens with pairs of line segments at a fixed relative orientation, such as X’s, L’s, and T’s (Bergen & Julesz 1983), Gabor patches of specified spatial frequency and orientation (Fig. 1M)(Graham et al. 1993), or other sets of tokens (Fig. 1A, B, G, H)(Caelli & Julesz 1978, Caelli et al. 1978, Julesz 1962). Generally, the tokens are smaller than the spacing between the grid points so that overlaps are not of concern.
The computer-graphics approaches of (Efros & Leung 1999) and (Xu et al. 2000) are conceptually related to the micropattern strategy, and can generate an impressive variety of naturalistic textures. These approaches start with a sample texture – typically a photographic image – then cut out patches, and then rearrange them to create new texture examples. In (Efros & Leung 1999), discontinuities at the borders of the rearranged patches are minimized by “growing” the synthesized texture outward from a starting patch; in (Xu et al. 2000), texture patches are relocated in a chaotic fashion and then discontinuities at their edges are reduced by a bridging process. As a consequence, there is a sharp demarcation between local statistics, which are preserved, and longer-range ones, which are not.
One can also control the interaction of texture parameters by working in the frequency domain. This enables construction of textures with long-range spatial correlations, provided that the luminance distribution is Gaussian (Fig 1O and P). Here, the covariances (the pairwise spatial correlations) are not specified directly, but rather, via their Fourier transform (the power spectrum), since the power at each spatial frequency can be specified independently. To synthesize such textures, one first creates a sample of uncorrelated Gaussian noise, and then applies a spatial filter whose modulation transfer function has an amplitude equal to the square root of the desired power spectrum. Closely related is the strategy of superimposing a finite number of sinusoids in random phase (fig. 1N). Note that since both methods necessarily create images with random phases, multipoint correlations – at any spatial scale – cannot be specified.
The limitations of the above approaches have led to the development of a second class of strategies to control image statistics of multiple orders and/or spatial scales. Several of these methods deal with the interdependence of such statistics by drawing inspiration from statistical mechanics. Here, a small number of image statistics are explicitly specified, and these are used to construct textures that are as random as possible, given the specified statistics. These “maximum-entropy” textures crisply demonstrate the way in which a texture is a mixture of structure (the specified statistics) and randomness (all other statistics). Maximum-entropy textures can be viewed as generalizations of some of the approaches mentioned above. Specifically, IID (independent identically-distributed) textures (Chubb et al. 1994) are maximum-entropy textures in which the first-order statistics are specified (Fig. 1 C, I, J, and K). Correlated Gaussian noises, constructed by filtering Gaussian white noise are maximum-entropy textures in which the covariances (or, equivalently, the power spectra) are specified (Fig. 1O, P).
The properties of entropy give the maximum-entropy approach mathematical appeal. A maximum-entropy ensemble is guaranteed to be uniquely determined by its defining statistics. Moreover, any visual texture can be viewed as the limit of a sequence of maximum-entropy textures, each of which is specified by a finite number of image statistics (Zhu et al. 1998). The coordinate system generated by these statistics has an intrinsic geometry based on information theory (Amari 2001), in which distance corresponds to statistical discriminability.
The main limitation of the maximum-entropy approach is that although the maximum-entropy ensemble is guaranteed to exist for any set self-consistent statistics, constructing it (and drawing samples from it) may be difficult. A general strategy, but a computationally-intensive one, has been developed by (Zhu et al. 1998); in essence, this method iteratively alters individual pixels in an image to increase its entropy, subject to the specified statistical constraints. For several special cases (in addition to the IID and correlated-Gaussian cases discussed above), computationally-efficient alternatives exist. Chief among these is that when certain kinds of a local statistics are specified, a Markov process (Gilbert 1980) can be used to generate a maximum-entropy texture. Sampling this Markov process – i.e., synthesizing an example of a texture that manifests its statistics – can be accomplished by seeding the image with a small number of random pixels and then applying an arithmetic recursion rule that sequentially specifies the luminance values of the remaining pixels (Fig. 1C–F). But when two or more local statistics are specified, the Markov strategy only succeeds if the recursion rules obey certain algebraic constraints (Champagnat et al. 1998, Gilbert 1980, Pickard 1980). This restricts the basic Markov approach to specific combinations of local image statistics. For combinations of image statistics that fail to meet these constraints, there are extensions of this basic idea; these extensions suffice to capture all of the statistics of 2×2 patches of pixels (Victor & Conte 2012).
Other general strategies approximate a maximum-entropy texture through an iterative approach, and are applicable to a wide range of interdependent image statistics. In the paradigmatic example of this approach (Portilla & Simoncelli 2000), statistics are organized into an pyramid, whose levels correspond to different spatial scales. At each scale, statistics include values derived from the individual pixels (variance, skewness, and kurtosis) and the outputs of linear filters placed on the texture (including autocorrelations, cross-correlations, and cross-scale correlations). This approach allows parametrization and synthesis of an impressively wide variety of textures (e.g., Fig. 1R, T), including both natural and artificial ones. The approach also shows that, although these parameter classes are interdependent, none can be omitted without a substantial loss of the ability to specify and synthesize naturalistic textures(Portilla & Simoncelli 2000). However, the mapping from individual parameters to textures is quite complex: while any texture corresponds to a specific set of parameters, the converse is not true: generic parameter sets not derived from texture examples may not correspond to realizable textures.
Two related approaches also use a multiscale model, but their synthesis procedure is based on wavelets (Bar-Joseph et al. 2001, DeBonet & Viola 1997). Of note, the Bar-Joseph method is applicable to mixtures of textures and texture movies.
A framework for textures and tasks
To begin, it is helpful to be explicit about a shared assumption of models aimed at accounting for texture perception:
1. All spontaneous visual distinctions are produced by a limited set of basic mechanisms (the M black circles in Figs. 2A and 2B), each of which transforms the pattern of light seen by the observer into a neural image (Robson 1980) reflecting the spatial distribution of a specific image statistic.
Figure 2.
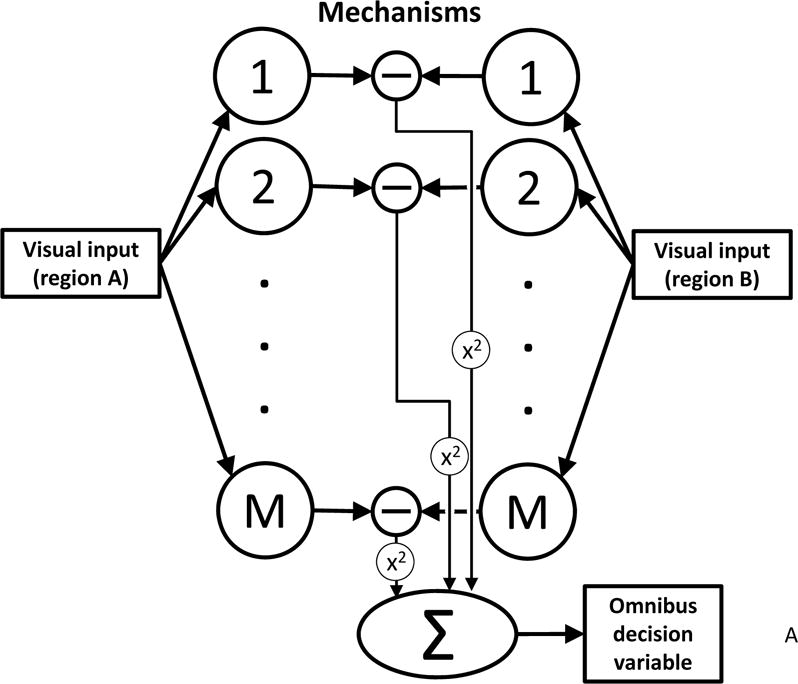

Two classes of models for texture processing. A. Unbiased salience: the back pocket model of texture segregation (Chubb & Landy 1991). Textures to be discriminated produce activations in an array of mechanisms (1,2,…,M), which are sensitive to specific aspects of texture. The levels of activation are compared across textures, and the differences combined to produce an omnibus decision variable. B. Biased salience: the interaction of task and mechanism. While individual mechanisms remain fixed (as in A), top-down processes combine these mechanisms with task-specific weights to synthesize a task- specific decision variable.
The primary motivation for using textures as stimuli is to determine the image statistics sensed by these mechanisms. To appreciate the importance of this goal, reflect that if indeed all visible differences result from differential activation of these basic mechanisms, then the statistics they compute are nothing less than the elementary substances of human vision.
Early models of texture processing focused on explaining “preattentive” texture segmentation— visual effects that occur with no effort of attention. Consequently, attention played no role in these models (illustrated in Fig. 2A), all of which shared the same general form (e.g., (Caelli 1985, Graham & Sutter 1998, Julesz & Bergen 1983, Malik & Perona 1990)). Under these “back-pocket models” (so called because researchers routinely pulled such models from a back pocket to account for new instances of preattentive texture segmentation (Chubb & Landy 1991)), two other assumptions are made:
2. The effect of any texture on human vision can be summarized by its “activation vector,” i.e., the set activation levels the texture produces in the basic mechanisms, and
3. Performance in any texture discrimination task is determined by some omnibus decision statistic (shown in Fig. 2A as a quadratic combination of component differences) that quantifies the disparity between the activation vectors of the textures.
Although attention plays no role in the back pocket model, it is clear that top-down attention can influence texture judgments. Consider, for example, the visual task confronted by a prospector. When a uranium prospector examines a sample of ore whose image presents an expanse of randomly variegated, interpenetrating lobes of different minerals, she is performing a subtly calibrated visual computation. If the prospector is skilled in her trade, the summary statistic produced by this computation provides at least a rough estimate of the concentration of uranium in the ore. The key neural tools required for judgments of this sort are the basic mechanisms. It should be noted, however, that the same prospector would need to use a different visual statistic if she were looking for copper instead of uranium.
The inferences afforded by an experiment depend crucially how the experiment manipulates top-down attention. “Unbiased salience” experiments aim to fix the attentional state of the observer in some neutral fashion while varying the properties of the textures to be discriminated. Experiments in this class typically assume a back pocket model of the sort diagrammed in Fig. 2A. Other “biased salience” experiments explicitly manipulate the attentional state of the observer across different conditions. Experiments in this class typically assume a model of the sort diagrammed in Fig. 2B. We discuss, in turn, each type of experiment and the sorts of inferences it is likely to enable.
Unbiased-salience experiments
Many unbiased salience experiments have attempted to neutralize the potential effects of top-down attention by mixing different texture discrimination conditions in the same block. For example, (Victor et al. 2015) studied the mechanisms enabling discrimination within a 10-dimensional space of binary textures (some examples are shown in Fig. 1C–E). In these experiments, on each trial, the stimulus comprised a target bar of texture against a square background of some other texture, and the task was to judge the location (right of, left of, above, or below the center of the background texture field) of the target bar. Crucially, on any given trial, the observer did not know what quality would define the target texture relative to the background texture; thus, the observer had to be ready for any sort of difference. By keeping the observer in the same fixed state of uncertainty across all trials, unbiased-salience experiments of this sort seek to insure that the activation vector produced by any given texture is used in the same way across all trials in which that texture occurs.
What can unbiased-salience experiments tell us about mechanisms? In a parameterized space of textures, every texture corresponds to a particular N-dimensional point (a parameter vector). In this context, a mechanism can be identified with a function that maps N-dimensional points onto the activations their textures produce in the mechanism. Assuming that this function changes sufficiently gradually across N-space, we can approximate a mechanism’s behavior near any reference point in terms of its activation gradient at that point: i.e., the line through the reference point along which activation changes most rapidly. The slope of this line corresponds to the sensitivity with which changes in that parameter influence the activation of the mechanism. For this reason, the function mapping the N parameters onto these slopes is sometimes called the “sensitivity function” of the mechanism at the reference point. The difference in activation produced in the mechanism by any two points in the neighborhood of the reference point is proportional to the distance that separates them along the activation gradient.
A consequence of the above observations is that if human vision happens to contain only a single mechanism that is sensitive to variations in a particular N-dimensional texture space, then the locus of parameter vectors that yield threshold performance in an unbiased salience experiment relative to a given reference base point will consist of two hyperplanes on opposite sides of that point, each orthogonal to the activation gradient of the mechanism. In this case, it is straightforward to measure the sensitivity function characterizing the mechanism at the reference point. Several experiments have been lucky enough to discover such texture spaces in which discrimination is controlled by the activation of a single mechanism (e.g.,(Chubb et al. 1994, Keeble et al. 1995)).
In most experiments, however, the locus of points yielding threshold discrimination from a reference point turns out to be a convex hypersurface surrounding that point. Such a finding signals that multiple mechanisms interact to determine the salience of the difference between textures. It may sometimes still be possible to infer the sensitivity functions of the underlying mechanisms (Logvinenko 2003); typically, however, the threshold hypersurface is ellipsoidal and hence consistent with a quadratic combination rule (as illustrated in Fig. 2A). In this case, it is impossible to determine the mechanism sensitivity functions(Poirson et al. 1990). Thus, although unbiased-salience experiments can determine a lower bound on the number of basic mechanisms, usually they cannot tell us what those mechanisms sense.
Biased-salience experiments
While “unbiased salience” experiments may be relevant to some real-world tasks, many visual tasks entail prior knowledge of the relevant stimulus features. For example, when one searches, one often knows what one is searching for (as in the task of the prospector mentioned above), and such prior knowledge may improve performance. Moreover, manipulating this prior knowledge experimentally provides a way to go beyond estimation of dimensionality, to determine the sensitivity of individual mechanisms.
Figure 2B shows a simple way to formalize how the basic mechanisms might be recruited for different tasks. In this context the basic mechanisms constitute the library that can be used by top- down processes to synthesize a task-specific decision variable (i.e., a tool for performing this task), when there is a priori knowledge of what that variable should be. We postulate that this synthesis consists of linear combination of the available mechanisms, with task-specific weights.
Note that this class of models makes qualitatively different predictions from the back-pocket models that account for the results of unbiased-salience experiments. As noted above, in unbiased- salience experiments, threshold surfaces are typically ellipsoidal (Chubb & Landy 1991, Landy & Oruc 2002, Victor et al. 2015). In contrast, the model of Figure 2B predicts that when the task is specified, then the threshold surface is flat, and is a hyperplane normal to the decision variable. Moreover, as the task is changed, the tool may also change, resulting in a change in the slant of threshold surface. Experiments confirm these predictions (Chubb & Nam 2000, Nam & Chubb 2000, Silva & Chubb 2014).
This task-dependence allows us to distinguish between models of mechanisms, even if these models produce the same thresholds in an unbiased salience task. Figure 3 shows how. For simplicity, we consider a two-parameter domain of textures. We consider three sets of hypothetical mechanisms in this space (columns); these sets of mechanisms are shown as vectors in the top row, where the vectors’ lengths and directions indicate their sensitivities to the two parameters. The second row of the Figure shows the threshold contour that would be obtained in an unbiased-salience task based on these mechanisms and quadratic summation. By design, each of these very different sets of mechanisms produces the same threshold contour, underscoring the well-known ambiguity that prevents inferring mechanisms from perceptual distances (Poirson et al. 1990).
Figure 3.

Task-dependence is informative about underlying mechanisms. A. Three candidate sets of mechanisms; mechanisms are shown as vectors whose directions and lengths indicate their sensitivities to two parameters of texture. In an unbiased-salience task (B), each of these sets of mechanisms leads to the same threshold ellipse. C and D show that these models lead to disparate results in a “seed expansion” experiment. In each experimental condition (each colored “fan”), the predominant quality that distinguishes the target texture from the background has a specific direction in the parameter space. This direction is given by the seed, which is shown as the heavier line in the middle of each fan; other stimuli used in the experiment have similar but not identical directions (the four flanking lines). To account for task performance, we posit that in each seed condition the subject synthesizes the best available tool for the task from a linear combination of the available mechanisms (as in Figure 2). Since resources are limited, there is a limitation on the weights used to combine these mechanisms, and hence a limitation on the tools that can be synthesized. The best available tool (vector with arrowhead) is the one with the largest projection onto the seed. Panel C simulates the results when the sum of the weights is constrained; panel D, when the sum of the squares of the weights is constrained. Thresholds are indicated by the open circles; as the data show (Silva & Chubb 2014), these thresholds lie along a line. When the sum of the weights is constrained (panel C), the ideal tool is always one of the original mechanisms (matching a mechanism of panel A); when the sum of squared weights is constrained (panel D), tools may combine two or more mechanisms. Note also that when no mechanism has a positive projection onto the seed (green fan in column 1 of rows C and D), thresholds are infinite.
The remaining rows of Figure 3 show how this ambiguity can be resolved via paradigms that explicitly change the task. Here we use the “seed expansion” paradigm (Chubb et al. 2012, Silva & Chubb 2014). In this paradigm, the subject’s task is to detect the location of a small patch of target texture in a large background of some other texture. In each experimental condition, the predominant quality differentiating the target from the background on each trial is a particular direction in parameter space. Four such conditions are illustrated here, corresponding to the four colored “fans” in Figure 3C and D. A key aspect of the experimental design is that within each condition, the directions probed on different trials deviate only slightly from a common direction, called the “seed direction” (indicated by the central ray of a given “fan” in Figure 3C and D).
To carry out the task, the subject must use her mechanisms to synthesize a tool that captures the deviation of the target from the background. As mentioned above with regard to Figure 2B, we postulate that this synthesis amounts to selecting a linear combination of the available mechanisms. But if resources are limited, there is a constraint on the weights used to combine them. This in turn limits the achievable tools. The ideal tool is the achievable tool that has the largest projection onto the seed.
Crucially, the tool direction and the seed direction need not match. This mismatch is informative about the underlying mechanisms. The last two rows of Figure 3 illustrate this for two kinds of constraints: a constraint on the sum of the weights, and a constraint on the sum of their squares. In the former case (Figure 3C), the ideal tool will always be one of the original mechanisms, namely, the mechanism that projects maximally onto the seed. This is because when the sum of weights is constrained, exchanging a portion of this mechanism for an equally-weighted portion of a less-sensitive mechanism can only reduce the effectiveness of the tool. In the latter case (Figure 3D), the ideal tool may have nonzero weights from multiple mechanisms for which there is a positive correlation with the seed. But even in this case, the ideal tool need not be aligned with the seed.
Perceptually relevant dimensions
Although only some of the parameters required to specify textures are relevant to perception (Chubb et al. 2004, Chubb et al. 2007, Julesz 1962, Julesz et al. 1973, Tkačik et al. 2010, Victor & Conte 1991), the number of perceptually relevant dimensions is still very high. To get an idea of this dimensionality, one can seek to determine a minimal number of mechanisms that are required to account for thresholds within some pre-defined subset of textures. Any single study of this kind necessarily provides a very conservative lower bound, but combining studies that examine different aspects of texture provides a better idea of the dimensionality – though still a lower bound.
We illustrate this by considering three such studies. (i) Bergen, Wilson, and Cowan (Bergen et al. 1979) showed that four mechanisms were needed to account for thresholds for a subset of one- dimensional, oriented textures (sums of pairs of gratings). (ii) (Chubb et al. 2004, Chubb et al. 2007) showed that three mechanisms were needed to account for thresholds for IID textures; this set of textures has no overlap with those of (Bergen et al. 1979). (iii) (Victor et al. 2015) showed that nine mechanisms were needed to account for thresholds for binary textures with local correlations; this set of textures has a one-dimensional overlap with the space studied by Chubb et al, namely, the binary IID textures. Taken together, this yields a lower bound of 15 dimensions: (4 from (Bergen et al. 1979), 3 from (Chubb et al. 2004), 9 from (Victor et al. 2015), minus the one overlap of the last two studies) – and doesn’t even take into consideration dimensions that are associated with orientation, color, and scale.
Threshold discriminations are but one of the texture-related tasks that the visual system needs to perform. When other tasks are used as assays – suprathreshold similarity judgments and estimation of material properties – estimates of dimensionality are much lower. Specifically, Gurnsey et al. (Gurnsey & Fleet 2001) found a dimensionality of 3 by applying multidimensional scaling to similarity judgments of isotropic Gaussian noises, Rao and Lohse (Rao & Lohse 1996)found a dimensionality of 3 by applying principal components analysis and related techniques to verbal ratings of the Brodatz (Brodatz 1965) natural texture collection. These too are necessarily lower limits, but there is no straightforward way to combine the estimates across studies to find an improved lower bound: the barrier is uncertainty as to the correspondence between the dimensions identified across different studies. One potential solution to this problem would be the identification of correspondences between the low-level statistical features of texture, and the factors that determine higher-level attributes, but this is not possible at present. We know that high-order correlations are needed for “naturalness” (Freeman et al. 2013) and some kinds of fourth-order correlations are related to porosity (Barbosa et al. 2013). However, with the exception of gloss (Motoyoshi et al. 2007, Wijntjes & Pont 2010), a correspondence between perceived surface properties and image statistics is not yet delineated.
Finally, while it is tempting to attribute the differences between these two approaches (i.e., estimates based on thresholds, vs. estimates based on suprathreshold judgments) to methodological differences or sample-size limitations, we believe that a more fundamental issue is important: that task modulates texture processing. Additionally, task may alter the way that texture representations are read out (Victor et al. 2014).
Basic mechanisms and peripheral vision
Recent work suggests that sensitivity throughout the peripheral visual field may be conferred entirely by the same basic mechanisms used in texture processing. The starting point for this suggestion is the remarkable effectiveness of the algorithm of (Portilla & Simoncelli 2000) (see above) in synthesizing new patches of texture that appear visually equivalent to the original. But clearly this equivalence must have its limits: if a page of this book were fed as input into the algorithm, the output image would appear “texty”, but would not be readable. (It would be surprising if it were otherwise – then the algorithm could be used to reliably fill in missing sections of documents!). Such an image has been called a “mongrel” of the original text (Balas et al. 2009).
Interestingly, when mongrels are viewed in the periphery (beyond the limits where the original text would be readable), they often look remarkably similar to the original images. More generally, if one replaces each peripheral region of a picture of a scene by a mongrel of the region, the resulting image looks very similar to the original scene provided one fixates the center. These observations suggest that visual sensitivity in the periphery is limited to the statistics provided by basic mechanisms. This conjecture is supported by experiments showing that many results in visual search and crowding can be understood simply by scrutinizing mongrels of the stimuli (Balas et al. 2009, Rosenholtz et al. 2012): tasks are easy if foveal inspection of stimulus mongrels tends to yield the right answer and difficult if not.
Physiological studies
As in many other domains of systems neuroscience, physiological studies of visual texture processing serve to anchor studies at the behavioral level by identifying the cellular and circuit mechanisms that implement the necessary computations. In so doing, physiological studies of visual texture also address a broader issue: delineation of the aspects of population activity that are relevant to perception.
Identifying the neural loci of texture processing is a more subtle matter than merely seeking the earliest stage of visual processing in which a neural population carries the information needed to determine texture identity or texture boundary. This formulation is overly simplistic, and would lead to the vacuous conclusion that the photoreceptors are the locus of texture processing, as further processing cannot create information that the photoreceptors have not already captured.
We therefore need to focus not on whether texture information is present in a given neural population, but rather, on whether this information is overt. This in turn is intimately related to the general problem of understanding neural population codes – which is one of the reasons that the study of visual textures holds enduring interest. Visual textures are, in essence, pictorial representations of spatial correlations, which are in turn transformed across layers of neural processing. Our inferences as to where texture analysis takes place therefore depend on the statistical features of neural activity that we consider to be manifest carriers of information, in contrast to covert carriers of information that are not available to perception until they are further transformed.
A standard way forward is to assert that information in a population becomes manifest when the overall population activity measured over some time window has changed. While this criterion leaves open the precise definition of a population (e.g., ON vs. OFF cells, cells of specific receptive field sizes, or specific orientation tunings) and how population activity should be measured (e.g., mean firing rate, RMS firing rate, etc.), it has a number of advantages. By specifying a link between individual neural properties and a population signal, it makes a direct connection between computational models of neurons and models such as the “back-pocket” models (Chubb & Landy 1991, Landy & Oruc 2002). It makes explicit the rationale for mass measures of population activity, such as the visual evoked potential and fMRI. Finally, for typical (“ergodic”) textures, it provides a rigorous justification for measuring population activity by sampling the responses of a limited number of neurons, across a large number of texture examples.
What does this viewpoint imply about texture discrimination? It is helpful to approach this question in steps, considering the ways that physiologically-motivated neural models interact with different kinds of image statistics. As a simple example, a population of linear neurons – except for neurons whose centers and surrounds are in perfect balance – will have an average population firing rate that covaries with the mean luminance of the stimulus; thus such populations provide an average firing rate that could support discriminations between textures that differ in mean luminance.
Our main interest is in discriminating between textures that differ in their spatial structure. For textures with identical mean luminances, strict linearity means that such textures will all elicit the same average response across a population. But the range of firing rates driven by a specific texture will depend on how the texture elements relate to the neural receptive fields: if the match is a good one, there will be occasional neurons that are driven well; if not, firing rates will tend to be more uniform across the population. Thus, a population measure that is sensitive to the variance of firing rates will typically provide a signal that distinguishes between textures with different spatial frequency contents, i.e., with different second-order statistics. The details of this measure are unimportant – whether it is a strict measure of variance (i.e., average squared firing rate), or merely summation of firing rates following the rectifying nonlinearity consequent to a firing threshold. The key requirement is that the population measure goes beyond capturing a strict average of the signal that emerges from a linear filter. For example, a stylized population of center-surround neurons with a low maintained discharge will distinguish between textures consisting of gratings of different frequencies, or dots of different sizes. Thus, population signals that discriminate second-order statistics are present beginning at the level of the retinal ganglion cell and the lateral geniculate nucleus.
It is worthwhile noting that at this level, there are systematic differences between ON- and OFF-center neurons, with an overall bias towards smaller receptive fields and greater sensitivity in the OFF pathway (Balasubramanian & Sterling 2009, Chichilnisky & Kalmar 2002, Kremkow et al. 2014, Nichols et al. 2013, Zemon et al. 1988). This asymmetry is further accentuated in primary visual cortex (Kremkow et al. 2014, Xing et al. 2010), ultimately leading to a greater perceptual salience of darks than lights (Chubb et al. 2004, Komban et al. 2011).
While these simple computational mechanisms will generically distinguish between textures that differ in their second-order statistics, an important caveat is that in order to provide a differential signal between two textures, receptive field shapes need to match one texture better than another. That is, circularly-symmetric receptive fields can distinguish between textures with dots of different sizes or gratings of different spatial frequencies, even if they are not specifically matched to the texture tokens (Nothdurft 1990)– but not between textures with tokens that differ only in orientation, such as textures built from Gabor patches or line-segment tokens. For such discriminations, oriented receptive fields – which emerge in V1 – are critical (Lamme et al. 1992, Nothdurft & Li 1985, Song & Baker 2007).
Understanding discriminations that involve higher-order statistics requires moving beyond a qualitative consideration of stylized neuronal models. This step is an important one, as high-order image statistics are the carriers of form information, such as contours, edges and corners (Morrone & Burr 1988, Oppenheim & Lim 1981). The key issue is that simple kinds of nonlinearities, such as firing rate thresholds and saturations, suffice to generate differential responses to spatial statistics of arbitrarily high order, merely because they are not polynomials. So it does not suffice to identify such signals or demonstrate whether models will produce them; it is necessary to determine whether they are of sufficient magnitude and specificity to account for perceptual phenomena. This requires physiological experiments using the texture stimuli themselves, as computational models of neurons that are constructed with other stimuli cannot be guaranteed to have sufficiently accurate predictive value.
Two recent studies have shown that nonlinear processing with the appropriate specificity to account for human sensitivity to high-order statistical features originates primarily in visual area V2. Freeman et al. (Freeman et al. 2013) examined neural responses to naturalistic textures and to phase-scrambled versions of the same textures. These textures shared the same first- and second-order statistics, but only the naturalistic textures contained third- and higher-order correlations. In both the macaque (as measured by single-unit activity) and the human (as measured by fMRI), V2 showed more vigorous responses to the naturalistic textures than to the phase-scrambled ones. Only very minor differences were seen in V1. Yu et al. (Yu et al. 2015) used a complementary strategy, examining neuronal responses in macaque V1 and V2 to responses to synthetic textures constructed to contain specific third- and fourth-order correlations. Neurons that responded differentially to these stimuli were rare in V1 (such neurons had been previously noted in the macaque (Purpura et al. 1994) and functional imaging suggests their presence in man (Beason-Held et al. 2000, Beason-Held et al. 1998)), but were seen in approximately a third of the units in the supragranular layers of V2. Critically, neuronal responses were selective for the kinds of third- and fourth-order correlations that were perceptually salient. The complementary use of naturalistic textures (Freeman et al. 2013) and synthetic ones (Yu et al. 2015) is important, in that it not only shows that sensitivity to high-order statistics is relevant for real- world stimuli, but also that these statistics per se (and not “naturalness”) suffice to drive neural responses. More broadly, these studies suggest an overarching theme for the computations carried out by area V2 – extraction of the local primitives (edges, corners, illusory contours) needed to delineate objects.
Finally, we note that segmentation based on texture and texture discrimination are likely distinct processes (Nothdurft 1994). Figure 4 shows two examples that illustrate this: in both cases, there is a salient border formed between two regions that have identical complements of texture elements, because of discontinuities that occur at the borders – bars shifted by half a spatial cycle (Fig. 4A), and an orientation discontinuity (Fig. 4B). The neural substrate of the responses to these contours likely resides in V2 (Schmid et al. 2014), and may be linked to iso-orientation suppression. For a review of this topic, and its relationship to pop-out, see (Schmid & Victor 2014).
Figure 4.

Examples of salient boundaries due to local discontinuities between regions containing the same texture. A. Segregation due to a spatial phase discontinuity. B. Segregation due to an orientation discontinuity. Demonstration due to (Nothdurft 1994), example reproduced with permission from (Inverso et al. 2016).
Conclusion
We have surveyed selected lines of study concerning visual texture, emphasizing the nature of the domain and the kinds of computational models that perceptual experiments can probe. While there is value in understanding how visual texture participates in specific tasks (e.g., determining object boundaries and determining 3D shape), we suggest that the most important experimental uses of visual texture are for analyzing the kinds of statistical information that neural populations can carry and the ways in which top-down and bottom-up signals interact.
Acknowledgments
This work is supported in part by NIH EY07977.
Glossary
- Back-pocket model
A class of models for texture discrimination and segmentation in which several heterogeneous image statistics are computed, and a decision is made based on the overall difference between them(Chubb & Landy 1991, Landy & Oruc 2002). The overall difference is typically computed as the sum of the squares of the differences between the individual statistics. See Figure 2A
- Binary texture
A texture composed of pixels that have only two luminance values, typically black and white
- Blackshot
A first-order image statistic that quantifies the fraction of pixels whose luminance is near black (Chubb et al. 2004)
- Correlation
The pairwise correlation between two variables, X and Y, is their covariance normalized by their variances, (see Covariance). Higher-order correlations are similarly computed from products of three or more variables
- Covariance
A second-order statistic describing the joint distribution of two quantities, such as the luminances at a pixel and its neighbor. Formally, the covariance X and Y is given by CXY = 〈(X −〈X〉)(Y −〈Y〉)〉, where 〈〉 denotes an average over the image or image ensemble. The variance of a quantity is its covariance with itself
- Ensemble (of images)
A collection of images along with a probabilistic rule for drawing samples from this collection
- Entropy
A quantification of the degree of randomness in a distribution or ensemble. A “maximum-entropy” distribution or ensemble is one in which the entropy is maximized, subject to specified constraints. For example, a Gaussian distribution is a maximum-entropy distribution, given a constraint on mean and variance
- Ergodicity
An ensemble property, indicating (when applied to image ensembles) that averages determined by sequential sampling across the ensemble are equivalent to averages that are computed by spatial sampling of a typical image
- Image statistic
A summary quantity computed from a single image, or a collection of images. Simple (“first-order”) image statistics (for example, the mean luminance, or the fraction of pixels whose luminances have a particular grayscale value), are computed from the distribution of luminance values; more complex image statistics (such as a covariance or a correlation) are computed from the joint distribution of luminance values at two or more locations in the image. The meaning extends to color images and spatiotemporal images (movies).
- IID (Independent, identically-distributed) texture
A texture in which each pixel is independently colored, by drawing randomly from the same distribution
- Isodipole textures
A pair of textures for which all first- and second-order statistics are identical
- Isotripole (isotrigon) textures
A pair of textures for which all first-, second-, and third-order statistics are identical
- Markov process
A random sequence in which the probabilistic choice of an element at each step depends only on the preceding element
- Markov random field
An extension of Markov processes to image ensembles, in which the probabilistic choice of the luminance value assigned to each pixel depends only on the luminance values assigned to its neighbors
- Micropattern
A small element that is replicated in random positions and/or orientations to create a visual texture
- Multipoint correlation
An image statistic equal to the normalized product of contrast values at two or more points
- Order (of an image statistic)
The number of locations in an image that must be simultaneously sampled to compute the value of the image statistic. For example, the mean is a first-order statistic, since it can be computed by averaging the luminance value at single locations, sampled independently. Local contrast is a second-order statistic, since it is computed from the luminance difference between a pair of nearby locations. Note that the meaning of “order” in relation to an image statistic is distinct from its meaning in describing motion (and sometimes form) mechanisms. The distinction is as follows. “First-order motion” is based on second-order statistics, since it is computed from a cross-correlation between two points in spacetime (Reichardt 1961). “Second-order motion” (Cavanagh & Mather 1989, Chubb & Sperling 1988, Chubb & Sperling 1989) is based on fourth-order statistics, because it is computed from correlations between two contrasts, each of which is in turn a second-order statistic – and therefore requires knowledge of four points in a image
- Phase correlation
A multipoint correlation at three or more points. The basis for this term is that computing the multipoint correlations of order 3 or higher from the Fourier components of an image requires knowledge of their relative phases. In contrast, computing correlations of order 2 only requires knowledge of the Fourier amplitudes
- Power spectrum
A second-order statistic that quantifies frequency content. For an image or image ensemble, the power spectrum is a function of spatial frequency. Formally, the power spectrum is only defined for an infinite ensemble; in practice, it is estimated from Fourier components of a limited number of finite samples
- Scramble texture
A texture in which pixel colors are drawn to match a specific distribution, and then the pixels are spatially scrambled. When the number of pixels is large, the result is essentially the same as an IID texture (see “IID texture”)
References
- Adelson EH. On seeing stuff: the perception of materials by humans and machines. Proceedings of the SPIE, Human Vision and Electronic Imaging VI. 2001;4299:1–12. [Google Scholar]
- Amari S-I. Information geometry on hierarchy of probability distributions. IEEE Transactions on Information Theory. 2001;47:1701–11. [Google Scholar]
- Balas B, Nakano L, Rosenholtz R. A summary-statistic representation in peripheral vision explains visual crowding. J Vis. 2009;9:13.1–18. doi: 10.1167/9.12.13. [DOI] [PMC free article] [PubMed] [Google Scholar]
- Balasubramanian V, Sterling P. Receptive fields and functional architecture in the retina. J Physiol. 2009;587:2753–67. doi: 10.1113/jphysiol.2009.170704. [DOI] [PMC free article] [PubMed] [Google Scholar]
- Bar-Joseph Z, El-Yaniv R, Lischinski D, Werman M. Texture mixing and texture movie synthesis using statistical learning. IEEE Trans on Visualization and Computer Graphics. 2001;7:120–35. [Google Scholar]
- Barbosa MS, Bubna-Litic A, Maddess T. Locally countable properties and the perceptual salience of textures. J Opt Soc Am A Opt Image Sci Vis. 2013;30:1687–97. doi: 10.1364/JOSAA.30.001687. [DOI] [PubMed] [Google Scholar]
- Beason-Held LL, Purpura KP, Krasuski JS, Desmond RE, Mangot DJ, et al. Striate cortex in humans demonstrates the relationship between activation and variations in visual form. Exp Brain Res. 2000;130:221–6. doi: 10.1007/s002210050024. [DOI] [PubMed] [Google Scholar]
- Beason-Held LL, Purpura KP, Van Meter JW, Azari NP, Mangot DJ, et al. PET reveals occipitotemporal pathway activation during elementary form perception in humans. Vis Neurosci. 1998;15:503–10. doi: 10.1017/s0952523898153117. [DOI] [PubMed] [Google Scholar]
- Bergen JR, Julesz B. Parallel versus serial processing in rapid pattern discrimination. Nature. 1983:696–98. doi: 10.1038/303696a0. [DOI] [PubMed] [Google Scholar]
- Bergen JR, Wilson HR, Cowan JD. Further evidence for four mechanisms mediating vision at threshold: sensitivities to complex gratings and aperiodic stimuli. J Opt Soc Am. 1979;69:1580–7. doi: 10.1364/josa.69.001580. [DOI] [PubMed] [Google Scholar]
- Bhushan N, Rao AR, Lohse GL. The texture lexicon: Understanding the categorization of visual texture terms and their relationship to texture images. Cognitive Science. 1997;21:219–46. [Google Scholar]
- Brodatz P. Textures: a Photographic Album for Artists and Designers. New York: Dover; 1965. [Google Scholar]
- Caelli T. Three processing characteristics of visual texture segmentation. Spat Vis. 1985;1:19–30. doi: 10.1163/156856885x00044. [DOI] [PubMed] [Google Scholar]
- Caelli T, Julesz B. On perceptual analyzers underlying visual texture discrimination: part I. Biol Cybern. 1978;28:167–75. doi: 10.1007/BF00337138. [DOI] [PubMed] [Google Scholar]
- Caelli T, Julesz B, Gilbert E. On perceptual analyzers underlying visual texture discrimination: Part II. Biol Cybern. 1978;29:201–14. doi: 10.1007/BF00337276. [DOI] [PubMed] [Google Scholar]
- Cavanagh P, Mather G. Motion: the long and short of it. Spat Vis. 1989;4:103–29. doi: 10.1163/156856889x00077. [DOI] [PubMed] [Google Scholar]
- Champagnat F, Idier J, Goussard Y. Stationary Markov Random Fields on a finite rectangular lattice. IEEE Trans Inf Theory. 1998;44:2901–16. [Google Scholar]
- Chichilnisky EJ, Kalmar RS. Functional asymmetries in ON and OFF ganglion cells of primate retina. J Neurosci. 2002;22:2737–47. doi: 10.1523/JNEUROSCI.22-07-02737.2002. [DOI] [PMC free article] [PubMed] [Google Scholar]
- Chubb C, Econopouly J, Landy MS. Histogram contrast analysis and the visual segregation of IID textures. J Opt Soc Am A Opt Image Sci Vis. 1994;11:2350–74. doi: 10.1364/josaa.11.002350. [DOI] [PubMed] [Google Scholar]
- Chubb C, Landy M. Orthogonal distribution analysis: a new approach to the study of texture perception. In: Landy MS, Movshon JA, editors. Computational models of visual processing. Cambridge, MA: MIT Press; 1991. pp. 291–301. [Google Scholar]
- Chubb C, Landy MS, Econopouly J. A visual mechanism tuned to black. Vision Res. 2004;44:3223–32. doi: 10.1016/j.visres.2004.07.019. [DOI] [PubMed] [Google Scholar]
- Chubb C, Nam JH. Variance of high contrast textures is sensed using negative half-wave rectification. Vision Res. 2000;40:1677–94. doi: 10.1016/s0042-6989(00)00007-9. [DOI] [PubMed] [Google Scholar]
- Chubb C, Nam JH, Bindman DR, Sperling G. The three dimensions of human visual sensitivity to first-order contrast statistics. Vision Res. 2007;47:2237–48. doi: 10.1016/j.visres.2007.03.025. [DOI] [PubMed] [Google Scholar]
- Chubb C, Scofield I, Chiao C-C, Sperling G. A method for analyzing the dimensions of preattentive visual sensitivity. J Math Psychol. 2012;56:427–43. [Google Scholar]
- Chubb C, Sperling G. Drift-balanced random stimuli: a general basis for studying non-Fourier motion perception. J Opt Soc Am [A] 1988;5:1986–2007. doi: 10.1364/josaa.5.001986. [DOI] [PubMed] [Google Scholar]
- Chubb C, Sperling G. Two motion perception mechanisms revealed through distance-driven reversal of apparent motion. Proc Natl Acad Sci U S A. 1989;86:2985–89. doi: 10.1073/pnas.86.8.2985. [DOI] [PMC free article] [PubMed] [Google Scholar]
- DeBonet J, Viola P. A non-parametric mult-scale statistical model for natural images. Adv Neural Info Processing. 1997;9:773–79. [Google Scholar]
- Efros AA, Leung TK. Texture synthesis by non-parametric sampling. Presented at International Conference on Computer Vision; Corfu, Greece. 1999. [Google Scholar]
- Freeman J, Ziemba CM, Heeger DJ, Simoncelli EP, Movshon JA. A functional and perceptual signature of the second visual area in primates. Nat Neurosci. 2013;16:974–81. doi: 10.1038/nn.3402. [DOI] [PMC free article] [PubMed] [Google Scholar]
- Gilbert EN. Random colorings of lattice on squares in the plane. SIAM J Alg Disc Meth. 1980;1:152–59. [Google Scholar]
- Graham N. Visual pattern analyzers. Oxford: Clarendon Press; 1989. [Google Scholar]
- Graham N, Sutter A. Spatial summation in simple (Fourier) and complex (non-Fourier) texture channels. Vision Res. 1998;38:231–57. doi: 10.1016/s0042-6989(97)00154-5. [DOI] [PubMed] [Google Scholar]
- Graham N, Sutter A, Venkatesan C. Spatial-frequency- and orientation-selectivity of simple and complex channels in region segregation. Vision Res. 1993;33:1893–911. doi: 10.1016/0042-6989(93)90017-q. [DOI] [PubMed] [Google Scholar]
- Gurnsey R, Fleet DJ. Texture space. Vision Res. 2001;41:745–57. doi: 10.1016/s0042-6989(00)00307-2. [DOI] [PubMed] [Google Scholar]
- Hansen T, Giesel M, Gegenfurtner KR. Chromatic discrimination of natural objects. J Vis. 2008;8:2.1–19. doi: 10.1167/8.1.2. [DOI] [PubMed] [Google Scholar]
- Hu Q, Victor JD. A set of high-order spatiotemporal stimuli that elicit motion and reverse-phi percepts. Journal of Vision. 2010;10:9.1–16. doi: 10.1167/10.3.9. [DOI] [PMC free article] [PubMed] [Google Scholar]
- Inverso M, Sun P, Chubb C, Wright CE, Sperling G. Evidence against global attention filters selective for absolute bar-orientation in human vision. Atten Percept Psychophys. 2016;78:293–308. doi: 10.3758/s13414-015-1005-3. [DOI] [PubMed] [Google Scholar]
- Joseph JS, Chun MM, Nakayama K. Attentional requirements in a ‘preattentive’ feature search task. Nature. 1997;387:805–7. doi: 10.1038/42940. [DOI] [PubMed] [Google Scholar]
- Julesz B. Visual pattern discrimination. IRE Trans Inf Theory. 1962:84–92. [Google Scholar]
- Julesz B. Textons, the elements of texture perception, and their interactions. Nature. 1981a;290:91–7. doi: 10.1038/290091a0. [DOI] [PubMed] [Google Scholar]
- Julesz B. A theory of preattentive texture discrimination based on first-order statistics of texture. Biol Cyb. 1981b:131–38. doi: 10.1007/BF00335367. [DOI] [PubMed] [Google Scholar]
- Julesz B, Bergen JR. Textons, the fundamental elements in preattentive vision and perception of textures. The Bell System Technical Journal. 1983;62:1619–45. [Google Scholar]
- Julesz B, Gilbert EN, Shepp LA, Frisch HL. Inability of humans to discriminate between visual textures that agree in second-order statistics–revisited. Perception. 1973;2:391–405. doi: 10.1068/p020391. [DOI] [PubMed] [Google Scholar]
- Julesz B, Gilbert EN, Victor JD. Visual discrimination of textures with identical third-order statistics. Biol Cybern. 1978;31:137–40. doi: 10.1007/BF00336998. [DOI] [PubMed] [Google Scholar]
- Keeble DR, Kingdom FA, Moulden B, Morgan MJ. Detection of orientationally multimodal textures. Vision Res. 1995;35:1991–2005. doi: 10.1016/0042-6989(94)00284-s. [DOI] [PubMed] [Google Scholar]
- Komban SJ, Alonso JM, Zaidi Q. Darks are processed faster than lights. J Neurosci. 2011;31:8654–8. doi: 10.1523/JNEUROSCI.0504-11.2011. [DOI] [PMC free article] [PubMed] [Google Scholar]
- Kremkow J, Jin J, Komban SJ, Wang Y, Lashgari R, et al. Neuronal nonlinearity explains greater visual spatial resolution for darks than lights. Proc Natl Acad Sci U S A. 2014;111:3170–5. doi: 10.1073/pnas.1310442111. [DOI] [PMC free article] [PubMed] [Google Scholar]
- Lamme VAF, van Dijk BW, Spekreijse H. Texture segregation is processed by primary visual cortex in man and monkey. Evidence from VEP experiments. Vision Res. 1992;32:797–807. doi: 10.1016/0042-6989(92)90022-b. [DOI] [PubMed] [Google Scholar]
- Landy MS, Bergen JR. Texture segregation and orientation gradient. Vision Res. 1991;31:679–91. doi: 10.1016/0042-6989(91)90009-t. [DOI] [PubMed] [Google Scholar]
- Landy MS, Oruc I. Properties of second-order spatial frequency channels. Vision Res. 2002;42:2311–29. doi: 10.1016/s0042-6989(02)00193-1. [DOI] [PubMed] [Google Scholar]
- Li A, Lennie P. Mechanisms underlying segmentation of colored textures. Vision Res. 1997;37:83–97. doi: 10.1016/s0042-6989(96)00152-6. [DOI] [PubMed] [Google Scholar]
- Li A, Zaidi Q. Perception of three-dimensional shape from texture is based on patterns of oriented energy. Vision Res. 2000;40:217–42. doi: 10.1016/s0042-6989(99)00169-8. [DOI] [PubMed] [Google Scholar]
- Li A, Zaidi Q. Three-dimensional shape from non-homogeneous textures: carved and stretched surfaces. J Vis. 2004;4:860–78. doi: 10.1167/4.10.3. [DOI] [PubMed] [Google Scholar]
- Logvinenko AD. Method of quadratic approximation: A new approach to identification of analysers and channels in human vision. Journal of Mathematical Psychology. 2003;47:495–506. [Google Scholar]
- Malik J, Perona P. Preattentive texture discrimination with early vision mechanisms. J Opt Soc Am A. 1990;7:923–32. doi: 10.1364/josaa.7.000923. [DOI] [PubMed] [Google Scholar]
- Marr D. Vision. New York: W. H. Freeman & Co.; 1982. [Google Scholar]
- Morrone MC, Burr DC. Feature detection in human vision: a phase-dependent energy model. Proc R Soc Lond B Biol Sci. 1988;235:221–45. doi: 10.1098/rspb.1988.0073. [DOI] [PubMed] [Google Scholar]
- Motoyoshi I, Nishida S, Sharan L, Adelson EH. Image statistics and the perception of surface qualities. Nature. 2007;447:206–9. doi: 10.1038/nature05724. [DOI] [PubMed] [Google Scholar]
- Nam JH, Chubb C. Texture luminance judgments are approximately veridical. Vision Res. 2000;40:1695–709. doi: 10.1016/s0042-6989(00)00006-7. [DOI] [PubMed] [Google Scholar]
- Nichols Z, Nirenberg S, Victor J. Interacting linear and nonlinear characteristics produce population coding asymmetries between ON and OFF cells in the retina. J Neurosci. 2013;33:14958–73. doi: 10.1523/JNEUROSCI.1004-13.2013. [DOI] [PMC free article] [PubMed] [Google Scholar]
- Nothdurft HC. Texture discrimination by cells in the cat lateral geniculate nucleus. Exp Brain Res. 1990;82:48–66. doi: 10.1007/BF00230837. [DOI] [PubMed] [Google Scholar]
- Nothdurft HC. Common properties of visual segmentation. Ciba Found Symp. 1994;184:245–59. doi: 10.1002/9780470514610.ch13. discussion 60-71. [DOI] [PubMed] [Google Scholar]
- Nothdurft HC. Salience from feature contrast: additivity across dimensions. Vision Res. 2000;40:1183–201. doi: 10.1016/s0042-6989(00)00031-6. [DOI] [PubMed] [Google Scholar]
- Nothdurft HC, Li CY. Texture discrimination: representation of orientation and luminance differences in cells of the cat striate cortex. Vision Res. 1985;25:99–113. doi: 10.1016/0042-6989(85)90084-7. [DOI] [PubMed] [Google Scholar]
- Oppenheim AV, Lim JS. The importance of phase in signals. Proc IEEE. 1981;69:529–41. [Google Scholar]
- Pickard DK. Unilateral Markov fields. Adv Appl Probab. 1980;12:655–71. [Google Scholar]
- Poirson A, Wandell B, Varner D, Brainard D. Surface characterizations of color thresholds. J Opt Soc Am. 1990;A7 doi: 10.1364/josaa.7.000783. [DOI] [PubMed] [Google Scholar]
- Portilla J, Simoncelli EP. A parametric texture model based on joint statistics of complex wavelet coefficients. International Journal of Computer Vision. 2000;40:49–71. [Google Scholar]
- Purpura KP, Victor JD, Katz E. Striate cortex extracts higher-order spatial correlations from visual textures. Proc Natl Acad Sci U S A. 1994;91:8482–6. doi: 10.1073/pnas.91.18.8482. [DOI] [PMC free article] [PubMed] [Google Scholar]
- Rao AR, Lohse GL. Towards a texture naming system: identifying relevant dimensions of texture. Vision Res. 1996;36:1649–69. doi: 10.1016/0042-6989(95)00202-2. [DOI] [PubMed] [Google Scholar]
- Reichardt W, editor. Autocorrelation, a principle for the evaluation of sensory information by the central nervous system. Cambridge, MA: MIT Press; 1961. pp. 303–17. [Google Scholar]
- Robson JG. Neural images: The physiological basis of spatial vision. In: Harris CS, editor. Visual coding and adaptability. Hillsdale, NJ: Erlbaum; 1980. pp. 177–214. [Google Scholar]
- Rosenholtz R, Huang J, Raj A, Balas BJ, Ilie L. A summary statistic representation in peripheral vision explains visual search. J Vis. 2012;12 doi: 10.1167/12.4.14. [DOI] [PMC free article] [PubMed] [Google Scholar]
- Schmid AM, Purpura KP, Victor JD. Responses to orientation discontinuities in V1 and V2: physiological dissociations and functional implications. J Neurosci. 2014;34:3559–78. doi: 10.1523/JNEUROSCI.2293-13.2014. [DOI] [PMC free article] [PubMed] [Google Scholar]
- Schmid AM, Victor JD. Possible functions of contextual modulations and receptive field nonlinearities: pop-out and texture segmentation. Vision Res. 2014;104:57–67. doi: 10.1016/j.visres.2014.07.002. [DOI] [PMC free article] [PubMed] [Google Scholar]
- Silva AE, Chubb C. The 3-dimensional, 4-channel model of human visual sensitivity to grayscale scrambles. Vision Res. 2014;101:94–107. doi: 10.1016/j.visres.2014.06.001. [DOI] [PubMed] [Google Scholar]
- Song Y, Baker CL., Jr Neuronal response to texture- and contrast-defined boundaries in early visual cortex. Vis Neurosci. 2007;24:65–77. doi: 10.1017/S0952523807070113. [DOI] [PubMed] [Google Scholar]
- Sutter A, Sperling G, Chubb C. Measuring the spatial frequency selectivity of second-order texture mechanisms. Vision Res. 1995;35:915–24. doi: 10.1016/0042-6989(94)00196-s. [DOI] [PubMed] [Google Scholar]
- te Pas SF, Koenderink JJ. Visual discrimination of spectral distributions. Perception. 2004;33:1483–97. doi: 10.1068/p5324. [DOI] [PubMed] [Google Scholar]
- Tkačik G, Prentice JS, Victor JD, Balasubramanian V. Local statistics in natural scenes predict the saliency of synthetic textures. Proc Natl Acad Sci U S A. 2010;107:18149–54. doi: 10.1073/pnas.0914916107. [DOI] [PMC free article] [PubMed] [Google Scholar]
- Todd JT, Norman JF, Koenderink JJ, Kappers AM. Effects of texture, illumination, and surface reflectance on stereoscopic shape perception. Perception. 1997;26:807–22. doi: 10.1068/p260807. [DOI] [PubMed] [Google Scholar]
- Todd JT, Oomes AH, Koenderink JJ, Kappers AM. The perception of doubly curved surfaces from anisotropic textures. Psychol Sci. 2004;15:40–6. doi: 10.1111/j.0963-7214.2004.01501007.x. [DOI] [PubMed] [Google Scholar]
- Treisman AM, Gelade G. A feature-integration theory of attention. Cogn Psychol. 1980;12:97–136. doi: 10.1016/0010-0285(80)90005-5. [DOI] [PubMed] [Google Scholar]
- Victor J. Images, statistics, and textures: a comment on “Implications of triple correlation uniqueness for texture statistics and the Julesz conjecture”. Journal of the Optical Society of America. 1994a;A11:1680–84. [Google Scholar]
- Victor JD. Images, Statistics, and Textures - Implications of Triple Correlation Uniqueness for Texture Statistics and the Julesz Conjecture - Comment. Journal of the Optical Society of America a-Optics Image Science and Vision. 1994b;11:1680–84. [Google Scholar]
- Victor JD, Brodie S. Discriminable textures with identical Buffon needle statistics. Biol Cybern. 1978;31:231–34. doi: 10.1007/BF00336998. [DOI] [PubMed] [Google Scholar]
- Victor JD, Conte MM. Cortical interactions in texture processing: scale and dynamics. Vis Neurosci. 1989;2:297–313. doi: 10.1017/s0952523800001218. [DOI] [PubMed] [Google Scholar]
- Victor JD, Conte MM. Spatial organization of nonlinear interactions in form perception. Vision Res. 1991;31:1457–88. doi: 10.1016/0042-6989(91)90125-o. [DOI] [PubMed] [Google Scholar]
- Victor JD, Conte MM. Visual working memory for image statistics. Vision Res. 2004;44:541–56. doi: 10.1016/j.visres.2003.11.001. [DOI] [PubMed] [Google Scholar]
- Victor JD, Conte MM. Encoding and stability of image statistics in working memory. Vision Res. 2006;46:4152–62. doi: 10.1016/j.visres.2006.07.023. [DOI] [PubMed] [Google Scholar]
- Victor JD, Conte MM. Local image statistics: maximum-entropy constructions and perceptual salience. J Opt Soc Am A Opt Image Sci Vis. 2012;29:1313–45. doi: 10.1364/JOSAA.29.001313. [DOI] [PMC free article] [PubMed] [Google Scholar]
- Victor JD, Rizvi SM, Conte MM. Society for Neuroscience Abstracts. Washington, DC: Society for Neuroscience; 2014. Dual representations of a visual perceptual space. [Google Scholar]
- Victor JD, Thengone DJ, Rizvi SM, Conte MM. A perceptual space of local image statistics. Vision Res. 2015;117:117–35. doi: 10.1016/j.visres.2015.05.018. [DOI] [PMC free article] [PubMed] [Google Scholar]
- Wijntjes MW, Pont SC. Illusory gloss on Lambertian surfaces. J Vis. 2010;10:13. doi: 10.1167/10.9.13. [DOI] [PubMed] [Google Scholar]
- Wolfson SS, Landy MS. Discrimination of orientation-defined texture edges. Vision Res. 1995;35:2863–77. doi: 10.1016/0042-6989(94)00302-3. [DOI] [PubMed] [Google Scholar]
- Wolfson SS, Landy MS. Long range interactions between oriented texture elements. Vision Res. 1999;39:933–45. doi: 10.1016/s0042-6989(98)00144-8. [DOI] [PubMed] [Google Scholar]
- Xing D, Yeh CI, Shapley RM. Generation of black-dominant responses in V1 cortex. J Neurosci. 2010;30:13504–12. doi: 10.1523/JNEUROSCI.2473-10.2010. [DOI] [PMC free article] [PubMed] [Google Scholar]
- Xu Y-Q, G B, Shum H. Chaos Mosaic: Fast and memory efficient texture synthesis. Microsoft Technial Report. 2000:1–31. MSR-TR-2000-32. [Google Scholar]
- Yellott J. Implications of triple correlation uniqueness for texture statistics and the Julesz conjecture. Journal of the Optical Society of America. 1993:777–93. [Google Scholar]
- Yu Y, Schmid AM, Victor JD. Visual processing of informative multipoint correlations arises primarily in V2. Elife. 2015;4 doi: 10.7554/eLife.06604. [DOI] [PMC free article] [PubMed] [Google Scholar]
- Zemon V, Gordon J, Welch J. Asymmetries in ON and OFF visual pathways of humans revealed using contrast-evoked cortical potentials. Vis Neurosci. 1988;1:145–50. doi: 10.1017/s0952523800001085. [DOI] [PubMed] [Google Scholar]
- Zhu SC, Wu Y, Mumford D. Filters, random fields and maximum entropy (FRAME): Towards a unified theory for texture modeling. International Journal of Computer Vision. 1998;27:107–26. [Google Scholar]