

Summary
Dendritic cells (DCs), a bridge for innate and adaptive immune responses, play a key role in the development of multiple sclerosis (MS) and experimental autoimmune encephalomyelitis (EAE), an animal model for MS. Administration of tolerogenic DCs has been used as an immunotherapy in autoimmune diseases. Deficiency of vitamin D is an environmental risk factor of MS. In this study, we induced tolerogenic DCs by 1,25‐dihydroxyvitamin D3 and transferred the tolerogenic DCs (VD 3‐DCs) into EAE mice by adoptive transfer. We found that VD 3‐DCs inhibited the infiltrations of T helper type 1 (Th1) and Th17 cells into spinal cord and increased the proportions of regulatory T cells (CD4+ CD25+ Foxp3+), CD4+ IL‐10+ T cells and regulatory B cells (CD19+ CD5+ CD1d+) in peripheral immune organs, which resulted in attenuated EAE. However, the proportions of T helper type 1 (Th1) and Th17 cells in spleen and lymph nodes and the levels of pro‐inflammatory cytokines and IgG in serum also increased after transfer of VD 3‐DCs. We conclude that transfer of VD 3‐DCs suppressed EAE by increasing proportions of regulatory T cells, CD4+ IL‐10+ T cells and regulatory B cells in spleen and reducing infiltration of Th1 and Th17 cells into spinal cord, which suggests a possible immunotherapy method using VD 3‐DCs in MS.
Keywords: 1,25‐dihydroxyvitamin D3; experimental autoimmune encephalomyelitis; multiple sclerosis; tolerogenic dendritic cells
Abbreviations
- 1,25(OH)2D3
1,25‐dihydroxyvitamin D3
- APC
allophycocyanin
- Breg cells
regulatory B cells
- CNS
central nervous system
- DCs
dendritic cells
- EAE
experimental autoimmune encephalomyelitis
- FITC
fluorescein isothiocyanate
- ICAM‐1
intercellular adhesion molecule‐1
- IFN‐γ
interferon‐γ
- IL‐10
interleukin‐10
- LFA‐1
lymphocyte function associated antigen‐1
- MHC‐II
major histocompatibility complex class II
- MS
multiple sclerosis
- NF‐κB
nuclear factor κB
- PE
phycoerythrin
- p.i.
post‐immunization
- Th1 cells
T helper type 1 cells
- Th17 cells
T helper type 17 cells
- TLR4
Toll‐like receptor 4
- TNF
tumour necrosis factor
- Treg cells
regulatory T cells cells
- VD3‐DCs
vitamin D‐induced dendritic cells
Introduction
Multiple sclerosis (MS) is an inflammatory demyelinating disease in the central nervous system (CNS), which leads to a very high level of neurological disability.1 However, lack of efficient specific immunotherapy in MS has been a serious problem.
Dendritic cells (DCs), a bridge between innate and adaptive immune responses, are a type of antigen‐presenting cell that participate in the initiation and development of MS and experimental autoimmune encephalomyelitis (EAE), an animal model of MS.2 Besides inducing an immune response, DCs can also generate immunological tolerance.3 DCs play an essential role in protecting against a severe autoimmune response under steady conditions and DC‐depleted mice developed spontaneous severe autoimmune disease.4 Tolerogenic DCs are a special type of DC that contribute to tolerance rather than immunity. Tolerogenic DCs suppress immune responses by expressing co‐inhibitory molecules, secreting anti‐inflammatory cytokines, inducing T‐cell anergy and generating regulatory T (Treg) cells.5
The Treg cell is a regulatory cell that has the ability to maintain peripheral tolerance and prevent autoimmune diseases. It can reduce the functions of some pathogenic cells by molecule secretion or direct contact.6 T helper type 1 (Th1) cells, a subset of pathogenic T cells, play an important role in the pathogenesis of MS and EAE.7 Adoptive transfer of myelin‐specific Th1 cells into mice induced severe EAE.7 T helper type 17 (Th17) cells are also a subset of pathogenic T cells that contribute to the development of MS and EAE. Th17 cells exist in the CNS lesions of patients with MS,7 and increased Th17 cells were found in the peripheral blood of patients with MS during acute relapse.2 During the process of activation of Th1 and Th17 cells, DCs play a crucial role.8 In peripheral lymphoid organs, DCs combine with T cells by their surface molecules and provide co‐stimulatory signals to promote the polarization of Th1 cells. Then T cells are activated by DCs and other antigen‐presenting cells, again after crossing the blood–brain barrier and participate in mediating demyelination in the CNS.9
On the basis of the immunosuppressive function of DCs, adoptive transfer of tolerogenic DCs could be applied in the therapy of various types of autoimmune diseases. It has been reported that the level of vitamin D in patients with MS is lower than in healthy control individuals and deficiency of vitamin D is an environmental risk factor for MS.1 Other studies have demonstrated that vitamin D3‐induced DCs (VD3‐DCs) showed a similar characterization to tolerogenic DCs and have the ability to ameliorate EAE in mice. These studies reported that VD3‐DCs inhibited the severity of EAE through reducing the proportion of CD11c+ DCs, and increasing the proportion of Treg cells and the secretion of interleukin‐10 (IL‐10).10, 11, 12 The effect of VD3‐DCs on pathogenic T cells and humoral immunity in MS and EAE is still unknown.
We cultured DCs with 1,25‐dihydroxyvitamin D3 (1,25(OH)2D3) and transferred VD3‐DCs in EAE to explore their therapeutic effect and therapeutic mechanism. Our study demonstrated that VD3‐DCs had the ability to alleviate EAE, although the inflammatory response in secondary immune organs and the blood became more severe after the transfer of VD3‐DCs. According to the results, we infer that VD3‐DCs alleviated EAE by enhancing the proportions of Treg cells, CD4+ IL‐10+ T cells and regulatory B (Breg) cells, and by inhibiting the infiltration of Th1 and Th17 cells from peripheral tissues into the spinal cord.
Materials and methods
Induction of EAE and assessment of clinical signs
Female C57BL/6 mice, 6–8 weeks of age and weighing 18–20 g (Vital River Laboratory Animal Technology Co. Ltd., Beijing, China), were used for the induction of EAE in the study. EAE was induced by subcutaneous injection of myelin oligodendrocyte glycoprotein 35–55 (MOG35–55) peptide (GenScript, Piscataway, NJ) emulsified with complete Freund's adjuvant (Sigma Aldrich, St Louis, MO) containing 8 mg/ml of heat‐inactivated Mycobacterium tuberculosis (Difco, Detroit, MI). Then, mice were injected with 300 ng of pertussis toxin (Merck Millipore, Billerica, MA) intraperitoneally at 0 and 48 hr post‐immunization (p.i.). Clinical scores of EAE were graded according to the following criteria: 0, asymptomatic; 1, tail paralysis or titubation; 2, severe paralysis of one hindlimb or mild paralysis of two hindlimbs; 3, severe paralysis of two hindlimbs; 4, severe paralysis of two hindlimbs with forelimb involvement; 5, moribund or dead; 0·5 for intermediate clinical sign.
Generation and transfer of DCs and VD3‐DCs
On days 2, 5 and 8 p.i., C57BL/6 mice were killed and femurs and tibiae were separated from muscle tissues. The bones were cut and bone marrow cells were extracted from them in RPMI‐1640 complete medium (Gibco, Waltham, MA). After lysis of red blood cells, bone marrow cells were cultured in RPMI‐1640 complete medium (Gibco) supplemented with fetal bovine serum (10%; Biological Industries, Kibbutz Beit‐Haemek, Israel), penicillin and streptomycin (1%; Hyclone, Logan, UT), granulocyte–macrophage colony‐stimulating factor (10 ng/ml; eBioscience, San Diego, CA) and IL‐4 (10 ng/ml; PeproTech, Rocky Hill, NJ). The medium for preparation of tolerogenic DCs was added with 1,25(OH)2D3 (1 × 10⁻⁸ m; Sigma Aldrich). Half of the previous medium was replaced by fresh medium at days 3, 5 and 7 post‐culture, and concentration of 1,25(OH)2D3 was increased to 2 × 10⁻⁸ m. DCs and VD3‐DCs were harvested at day 8 post‐culture and incubated with MOG35–55 peptide for 4 hr at 37°. After being washed with PBS twice, the concentration of cells was regulated to 8 × 10⁶/ml and transferred to EAE mice (8 × 10⁵/ml for each mouse) via the caudal vein.
Mice were divided into three groups randomly (using a table of random numbers): (i) control group: transfer of PBS; (ii) DCs group: transfer of DCs (untreated with 1,25(OH)2D3) pulsed with MOG peptide; (iii) VD3‐DCs group: transfer of DCs treated with 1,25(OH)2D3 pulsed with MOG peptide.
Flow cytometry
DCs and tolerogenic DCs, induced by 1,25(OH)2D3, were harvested on day 8 post‐culture and stained for 30 min at 4° in 1% fetal bovine serum–PBS buffer with the following antibodies: CD11c‐phycoerythrin‐cyanin 7 (PE‐Cy7), major histocompatibility complex class II (MHC‐II)‐fluorescein isothiocyanate (FITC), CD86‐PE, CD80‐allophycocyanin (APC) and CD83‐PE (BD Biosciences, San Jose, CA). Flow cytometric analysis was performed using the flowjo 7.6.1 (Treestar, Ashland, OR).
On day 20 p.i. (the peak of disease), EAE mice were killed and cells were isolated from spleens and lymph nodes. After being stimulated with leucocyte cocktail activation for 8 hr, cells were stained using the following antibodies: CD3‐FITC, CD4‐Peridinin chlorophyll protein‐Cy5.5, IL‐17A‐Bv421, interferon‐γ (IFN‐γ) ‐APC, IL‐10‐PE, CD25‐PE‐CF594 and Foxp3‐PE (BD Biosciences). For extracellular molecules like CD3, CD4 and CD25, cells were incubated with antibodies for 30 min at 4°. For intracellular molecules like IL‐17A, IFN‐γ and IL‐10, cells were fixed with 2% paraformaldehyde (Solarbio, Beijing, China) for 20 min at room temperature. After being permeabilized with 0·5% saponin (Sigma Aldrich), cells were incubated with antibodies for 30 min at 4°. For endonuclear molecules like FoxP3, cells were stained according to the instructions provided by the manufacturer (BD Biosciences). Flow cytometric analysis was performed by using flowjo 7.6.1 (Treestar).
Regulatory B cells were isolated from spleen and lymph nodes of EAE mice on day 20 p.i. and then stained with the following antibodies (CD3‐FITC, CD19‐PE‐Cy7, CD1d‐BV510 and CD5‐APC; BD Biosciences) for 30 min at 4°. Data analysis for flow cytometry was performed using flowjo 7.6.1 (Treestar).
Histological evaluation
On day 20 p.i., spinal cords of mice were taken out after being perfused by intracardiac infusion with 4% paraformaldehyde. The spinal cords were fixed in 4% buffered formalin, embedded in paraffin wax, cut into sections (6 μm) and stained with haematoxylin & eosin for pathological examination.
Immunofluorescence staining
On day 20 p.i., the mice were anaesthetized and perfused by intracardiac infusion with 4% paraformaldehyde. The spinal cords were sampled and fixed in 4% paraformaldehyde for 24 hr at 4°, and then dehydrated using sucrose solution, embedded in optimal cutting temperature compound (Sakura, Tokyo, Japan) and sliced into samples. Spinal cord samples were incubated with proteinase K (Merck, Darmstadt, Germany) for 10 min at 37° and subsequently incubated with reagent comprising 89·4% PBS, 10% goat serum (Bioss, Beijing, China) and 0·6% Trition (Sigma Aldrich) for 1 hr at 4°. The samples were stained with primary antibodies to CD4 (1 : 150), T‐bet (1 : 200) and ROR‐γt (1 : 200) (Abcam, Cambridge, UK) for 12 hr at 4°, followed by secondary antibodies to goat anti‐rat (AF‐647), goat anti‐mouse (AF‐488) and goat anti‐rabbit (AF‐488) (Abcam) separately for 1 hr at room temperature. After being stained with 4′,6‐diamidino‐2‐phenylindole (Boster, Hubei, China), immunofluorescence analysis was performed on a fluorescence microscope (Olympus BX51, Japan).
Cytokine cytometric bead array
On day 20 p.i., EAE mice were killed and peripheral blood was collected. Serum was obtained after centrifugation at 2092 g for 10 min. The levels of IL‐2, IL‐4, IL‐6, IL‐10, IL‐17A, tumour necrosis factor (TNF) and IFN‐γ in serum were measured by cytometric bead array (CBA) kits (BD Bioscience) according to the manufacturer's instructions. Determinations were performed twice and results are expressed as pg/ml.
Detection of IgG by ELISA
The level of IgG in serum was detected with ELISA kits (GenWay, San Diego, CA). The serum was prepared in a dilution of 1/200 000 and the assay was performed according to the manufacturer's instructions. Determinations were performed in triplicate and plates were read on a microplate reader (Bio‐Rad, Hercules, CA).
Statistical analysis
All experiments were replicated three times. Data were expressed as the mean ± standard deviation (SD) values. The flow cytometry data were analysed using flowjo 7.6.1 (Treestar) and graphed using graphpad prism version 5.0 (GraphPad Software Inc., San Diego, CA). Other statistical analyses were performed using graphpad prism version 5.0 (GraphPad Software Inc.) and spss 21.0 (IBM Deutschland, Ehningen, Germany). One‐way analysis of variance followed by Bonferroni's post‐test was used to compare values among three groups and Student's t‐test was used to compare values between two groups. All tests were two‐tailed, with the level of significance set to P < 0·05.
Results
1,25(OH)2D3 induces tolerogenic DCs efficiently
Bone‐marrow‐derived DCs from EAE mice were incubated with 1,25(OH)2D3 for 8 days and the phenotype was identified. The results showed that 1,25(OH)2D3 down‐regulated the expression of MHC‐II and CD86 on DCs (P < 0·001). However, no significant difference in the expression of CD83 and CD80 between VD3‐DCs and DCs was observed (P > 0·05) (Fig. 1a).
Figure 1.
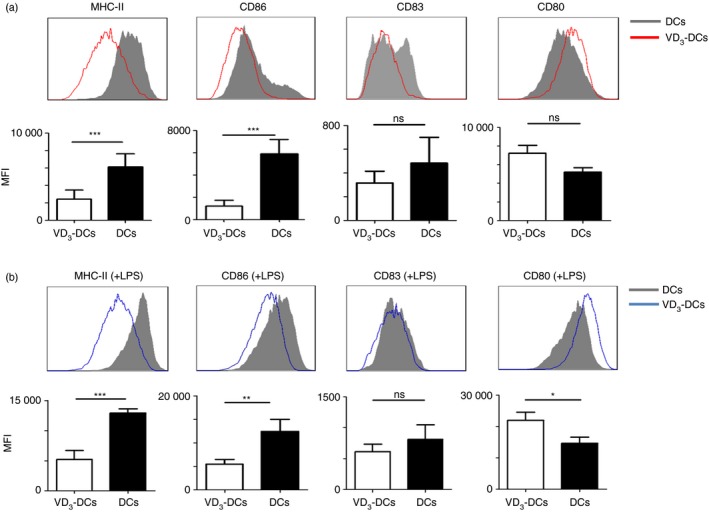
The expression of MHC‐II, CD86, CD83 and CD80 molecules on dendritic cells (DCs) and DCs treated with 1,25‐dihydroxyvitamin D3 (VD 3‐DCs). VD 3‐DCs and DCs were harvested on day 8 post‐culture and flow cytometry was applied to detect the expression of MHC‐II, CD86, CD83 and CD80 on VD 3‐DCs and DCs as described in the Materials and methods. (a) VD 3‐DCs express lower levels of MHC‐II, CD86 and CD83 molecules than DCs. (b) After stimulation with lipopolysaccharide (LPS), VD 3‐DCs still express lower levels of MHC‐II, CD86 and CD83 molecules than DCs. Experiments were replicated three times and data are shown as the mean ± SD. Two‐tailed Student's t‐test was used. ns, no significant difference; *P < 0·05; **P < 0·01; ***P < 0·001 (n = 10). [Colour figure can be viewed at wileyonlinelibrary.com]
VD3‐DCs retained immature phenotype after being stimulated with lipopolysaccharide (Fig. 1b). VD3‐DCs still had lower expression of MHC‐II (P < 0·001) and CD86 (P < 0·01), and higher expression of CD80 (P < 0·05) than DCs. But there was no significant difference in the expression of CD83 between the two groups (P > 0·05). Our results implied that incubation with 1,25(OH)2D3 led to generation of tolerogenic DCs.
VD3‐DCs ameliorates EAE
To determine the effect of VD3‐DCs and DCs on EAE, VD3‐DCs and DCs loaded with MOG35–55 peptide were transferred to EAE mice by the caudal vein on days 10, 13 and 16 post‐immunization. Both VD3‐DCs and DCs treated EAE mice showed reduced clinical scores (mean clinical score of each group) when compared with the controls (controls: 3 ± 1·05, DCs group: 1·6 ± 0·57, VD3‐DCs group: 0·9 ± 0·57; VD3‐DCs group versus the controls, P < 0·001; DCs group versus the controls, P < 0·05) (Fig. 2a). Injection of VD3‐DCs significantly postponed the onset of EAE compared with administration to the DCs group and the controls (controls: 12·5 ± 0·3 days, VD3‐DCs group: 14·6 ± 0·4 days; P < 0·001) (Fig. 2b), but when DCs group (12·3 ± 0·4 days) was compared with the controls, the difference was not significant (P > 0·05) (Fig. 2b).
Figure 2.
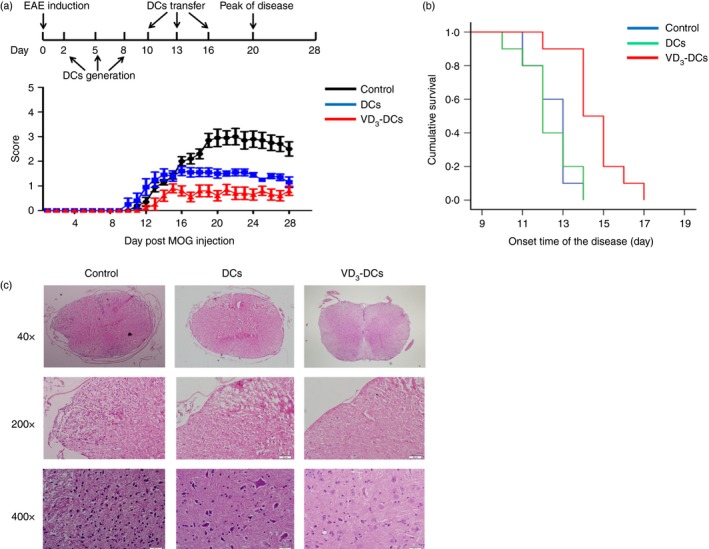
Dendritic cells treated with 1,25‐dihydroxyvitamin D3 (VD 3‐DCs) alleviate clinical symptoms and reduce spinal cord damage in experimental autoimmune encephalomyelitis (EAE) (models were induced in female C57BL/6 mice). (a) The clinical score of EAE after adoptive transfer of VD 3‐DCs and DCs. VD 3‐DCs and DCs reduce the severity of EAE. (b) Kaplan–Meier survival analysis comparing the onset time of the VD 3‐DCs group, DCs group and controls. VD 3‐DCs postpone the onset of EAE significantly. (c) Inflammatory cell infiltration and structural damage to the spinal cord are more severe in controls than in the VD 3‐DCs group and DCs group. Experiments were replicated three times (n = 10). [Colour figure can be viewed at wileyonlinelibrary.com]
Histological evaluation showed consistent results with the clinical score. The extent of inflammatory cell infiltration decreased in the VD3‐DCs group and DCs group (Fig. 2c).
VD3‐DCs inhibit the infiltration of Th1 and Th17 cells into spinal cord
To explore the mechanism behind the therapeutic effect of VD3‐DCs on EAE, we measured the numbers of infiltrations of Th1 and Th17 cells in the spinal cords of EAE. As presented in Fig. 3, the number of Th1 cells was decreased in the VD3‐DCs group (15·0 ± 4·3) compared with the DCs group (26·1 ± 6·2; P < 0·001) and the controls (52·1 ± 20·1; P < 0·001). When comparing the DCs group with the controls, the difference also reached statistical significance (P < 0·001). Similar profiles of Th17 cell infiltration in the spinal cord were found in these groups. The numbers of Th17 cells were also decreased in the VD3‐DCs group (17·3 ± 4·5) compared with the DCs group (26·3 ± 6·1; P < 0·001) and the controls (46·3 ± 15·3; P < 0·001). Our results suggested that administration of VD3‐DCs ameliorated EAE by reducing the infiltration of Th1 and Th17 cells in the spinal cords.
Figure 3.

Dendritic cells treated with 1,25‐dihydroxyvitamin D3 (VD 3‐DCs) decrease the infiltration of T helper type 1 (Th1) and Th17 cells in spinal cord. On day 20 post‐immunization (p.i.), mice with experimental autoimmune encephalomyelitis (EAE) (induced in female C57BL/6 mice) were killed and their spinal cords were sliced into samples. The cells on lumbar spinal cord sections were stained using primary antibodies [CD4 (red), T‐bet (green) and ROR‐γt (green)] and secondary antibodies (goat anti‐rat AF‐647, goat anti‐mouse AF‐488 and goat anti‐rabbit AF‐488). Arrows represent the double‐positive cells (emit both red and green fluorescence), which are Th1 (a) and Th17 (b) cells. The numbers of Th1 and Th17 cells were analysed. Experiments were replicated three times and data are shown as the mean ± SD. One‐way analysis of variance followed by Bonferroni's post‐test was used. ***P < 0·001 (n = 10). [Colour figure can be viewed at wileyonlinelibrary.com]
VD3‐DCs increase proportions of Treg, CD4+ IL‐10+T, Th1 and Th17 cells in spleen and lymph nodes
To investigate the mechanism of VD3‐DCs therapeutic effect further, we analysed the proportion of Treg, CD4+ IL‐10+T, Th1 and Th17 cells in the spleen and lymph nodes. In the spleen, the proportion of Treg (CD4+ CD25+ Foxp3+) cells in CD4+ T cells was increased in the VD3‐DCs group compared with the controls (P < 0·05) (Fig. 4a). But the proportion of Treg cells showed no significant difference between the VD3‐DCs group and the DC group nor between the DC group and the controls (P > 0·1) (Fig. 4a). In lymph nodes, the proportion of Treg cells was elevated in the VD3‐DCs group compared with the DCs group (P < 0·05) (Fig. 4b) and the controls (P < 0·01) (Fig. 4b), but there was no significant difference between the DCs group and the controls (P > 0·05) (Fig. 4b). Higher numbers of CD4+ IL‐10+ T cells in the spleen and lymph nodes were found in the VD3‐DCs group than in the controls (P < 0·05) (Fig. 4c,d). However, there was no significant difference regarding the numbers of CD4+ IL‐10+ T cells between the VD3‐DCs group versus the DCs group, and the DCs group versus the controls (P > 0·05) (Fig. 4c,d).
Figure 4.
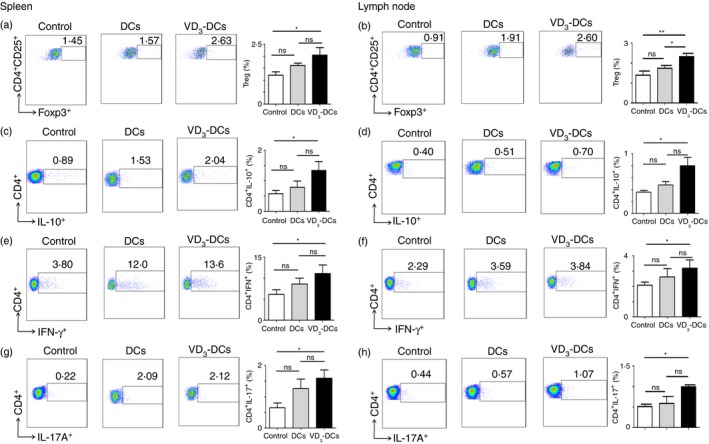
Dendritic cells treated with 1,25‐dihydroxyvitamin D3 (VD 3‐DCs) increase the proportion of Treg, CD4+ IL‐10+, Th1 and Th17 cells in the spleen and the lymph nodes. On day 20 post‐immunization (p.i.), mice with experimental autoimmune encephalomyelitis (EAE) (induced in female C57BL/6 mice) were killed, and cells were isolated from spleen and lymph nodes and analysed using flow cytometry as described in the Materials and methods. Flow cytometry pseudocolour images and bar charts of the proportions of Treg cells (CD4+ CD25+ FoxP3+) (a, b), CD4+ IL‐10+ cells (c, d), Th1 cells (CD4+ IFN‐γ +) (e, f) and Th17 cells (CD4+ IL‐17A+) (g, h) are shown. Experiments were replicated three times and data are shown as the mean ± SD. One‐way analysis of variance followed by Bonferroni's post‐test was used. ns, no significant difference; *P < 0·05; **P < 0·01 (n = 10). [Colour figure can be viewed at wileyonlinelibrary.com]
In addition, there was an unexpected result that VD3‐DCs also increased the proportion of Th1 (CD4+ IFN‐γ +) and Th17 (CD4+ IL‐17A+) cells in spleen, which can promote the development of EAE. Our results showed that proportions of Th1 and Th17 cells in the spleen were up‐regulated in the VD3‐DCs group compared with the controls (P < 0·05) (Fig. 4e,g). Similar profiles of the proportions of Th1 and Th17 cells were found in lymph nodes when comparing the VD3‐DCs group with the controls (P < 0·05) (Fig. 4f,h). The difference of the proportion of Th17 cells in lymph nodes also showed a statistical significance between the DCs group and the controls (P < 0·05) (Fig. 4h).
VD3‐DCs increase the levels of IL‐17A and TNF
To investigate the effect of VD3‐DCs on cytokines in serum, the levels of IL‐2, IL‐4, IL‐6, IL‐10, IL‐17A, TNF and IFN‐γ were measured using CBA kits. The level of TNF increased in both the VD3‐DCs and the DCs groups compared with the controls (P < 0·05) (Fig. 5a). The level of IL‐17A increased in the VD3‐DCs group compared with other two groups (P < 0·05) (Fig. 5b). The level of IFN‐γ decreased in the DCs group (P < 0·05) (Fig. 5c). Differences in the levels of IL‐6 (Fig. 5d), IL‐10 (Fig. 5e) and IL‐4 (Fig. 5f) among the three groups were not significant (P > 0·05) and the level of IL‐2 could not be detected (data not show).
Figure 5.

Dendritic cells treated with 1,25‐dihydroxyvitamin D3 (VD 3‐DCs) increase the levels of interleukin‐17A (IL‐17A) and tumour necrosis factor (TNF). On day 20 post‐immunization (p.i.), mice with experimental autoimmune encephalomyelitis (EAE) (induced in female C57BL/6 mice) were killed and serum was obtained after centrifuging at 2092 g for 10 min. CBA kits were used to detect the secretion of cytokines in serum. Results show that the secretion of TNF (a) increases in both the VD 3‐DCs group and the DCs group and IL‐17A (b) only increases significantly in the VD 3‐DCs group. The secretion of interferon‐γ (IFN‐γ) (c) decreases significantly in the DCs group. The differences of secretion of IL‐6 (d), IL‐10 (e) and IL‐4 (f) are not significant. Experiments were replicated three times and data are shown as the mean ± SD. One‐way analysis of variance followed by Bonferroni's post‐test was used. ns, no significant difference; *P < 0·05; **P < 0·01 (n = 6).
VD3‐DCs increase the proportions of Breg cells in spleen
To investigate whether VD3‐DCs can regulate the humoral immunity in EAE, we analysed the proportion of Breg cells in the spleen and lymph nodes. In the spleen, the proportion of Breg cells (CD19+ CD5+ CD1d+) increased significantly in the VD3‐DCs group compared with the DCs group (P < 0·01) (Fig. 6a) and the controls (P < 0·05) (Fig. 6a). The proportion of Breg cells in the DCs group was slightly lower than in the controls, but the difference between these two groups was not significant (P > 0·05) (Fig. 6a). In lymph nodes, the proportion of Breg cells increased slightly in the VD3‐DCs group and DC group compared with the controls, but there were no significant differences between any two groups (P > 0·05) (Fig. 6b).
Figure 6.

Dendritic cells treated with 1,25‐dihydroxyvitamin D3 (VD 3‐DCs) increase the proportion of Breg cells in spleen and the secretion of IgG in serum. On day 20 p.i., experimental autoimmune encephalomyelitis (EAE) mice (induced by female C57BL/6 mice) were killed, cells were isolated from spleen and lymph nodes of mice and serum was obtained after centrifugation of blood at 2092 g for 10 min. Cells were analysed using flow cytometry as described in the Materials and methods and the levels of IgG were evaluated using ELISA kits according to the manufacturer's instructions. In spleen (a), the proportion of Breg cells increases in the VD 3‐DCs group whereas the proportion of it decreases in the DCs group. In lymph nodes (b), the proportions of Breg cells have a slight increase in both the VD 3‐DCs group and the DCs group. The level of IgG increases in the VD 3‐DCs group significantly. But the differences between the DCs group and the controls as well as the VD 3‐DCs group and the DCs group are not significant (c). Experiments were replicated three times and data are shown as the mean ± SD. One‐way analysis of variance followed by Bonferroni's post‐test was used. ns, no significant difference; *P < 0·05; **P < 0·01 (n = 6). [Colour figure can be viewed at wileyonlinelibrary.com]
VD3‐DCs increase the level of IgG in serum
To determine whether VD3‐DCs can influence the humoral immunity, we detected the level of IgG in serum by ELISA kits. As shown in Fig. 6(c), the level of IgG increased in the VD3‐DCs group compared with the controls (P < 0·05). But there were no significant differences between the controls and the DCs group nor between the DCs group and the VD3‐DCs group (P > 0·05).
Discussion
Multiple sclerosis is a serious disease and has been researched for years, but there is still a lack of efficient specific immunotherapy.1 In this study, we found that 1,25(OH)2D3‐induced tolerogenic DCs have the ability to alleviate EAE by increasing proportions of Treg, CD4+ IL‐10+ T and Breg cells in spleen and reducing infiltration of Th1 and Th17 cells into the spinal cord.
The DCs play a crucial role in the pathogenesis of MS and EAE. They take up and process antigens loaded on the MHC, present antigens to T cells and then activate T cells through expression of co‐stimulatory molecules such as CD86 and CD83.9 Tolerogenic DCs, which can result in T‐cell unresponsiveness, express lower levels of MHC‐II and co‐stimulatory molecules than normal DCs.9, 13, 14 Our results showed that 1,25(OH)2D3 down‐regulated the expression of MHC‐II, CD86 and CD83 on DCs, and the expression of these surface molecules on VD3‐DCs was still lower than DCs after stimulation with lipopolysaccharide, which is a pro‐inflammatory mediator.15 These results indicate that VD3‐DCs are a type of steady tolerogenic DC.
In this study, both VD3‐DCs and normal DCs inhibited EAE. The normal DCs that transferred to EAE in our study were not stimulated by lipopolysaccharide, so they were still immature and their surface markers like MHC‐II and CD86 remained at a low level. The immature phenotype of normal DCs may be the reason why they can also have curative effects.
The Treg cells are a subset of CD4+ T cells and have the ability to maintain immune tolerance.12, 16 A variety of treatments in MS/EAE are reported through up‐regulating the number of Treg cells.17, 18, 19 In addition to Treg cells, CD4+ IL‐10+ T cells are also a subset of CD4+ T cells, which regulate the immune response by secretion of IL‐10 and transforming growth factor‐β. In this study, we found that transfer of VD3‐DCs increased the percentages of Treg and CD4+ IL‐10+ T cells in spleen and lymph nodes. The increased proportions of Treg and CD4+ IL‐10+ T cells are consistent with their function.
Both Th1 and Th17 cells, two subsets of CD4+ T cells, are involved in the pathogenesis of EAE. Both Th1 and Th17 cells infiltrate the CNS during EAE and the degree of infiltration can reflect the severity of inflammation and of disease.20 Th17 cells produce pro‐inflammatory cytokines, such as IL‐17, IL‐6, IL‐21, IL‐22, IL‐23 and TNF‐α that induce inflammatory reactions.21, 22, 23 Immunoglobulins, key effector molecules of the humoral adaptive immune system, are the main secretory products of plasma cells. They bind antigen by their variable regions and present to Fc receptors and C‐type lectin receptors, which can be expressed on DCs and subsequently mediate immune responses.24, 25
Our results found enhanced inflammatory responses and inflammatory cytokines in the peripheral immune organs and blood in the EAE model after adoptive transfer of VD3‐DCs and DCs. However, the increased inflammatory responses in the periphery seem to contravene the decreased Th1 and Th17 cell infiltration into the CNS and alleviate clinical symptoms in the VD3‐DCs and DCs groups. In the development of MS and EAE, pathogenic T cells go through three main processes: activation by antigen‐presenting cells in the periphery, crossing the blood–brain barrier and re‐stimulation by antigen‐presenting cells, again in the CNS.26 Hence, we supposed that VD3‐DCs alleviated EAE by inhibiting the migration of Th1 and Th17 cells from peripheral organs into the CNS rather than reducing the numbers of Th1 and Th17 cells in the peripheral immune organs.
Lymphocyte function associated antigen‐1 (LFA‐1) and its adhesive ligands, such as intercellular adhesion molecule‐1 (ICAM‐1), are crucial in lymphocyte trafficking and adaptive immune responses.27 After the stimulation of antigen presented by MHC, T‐cell receptors can cluster LFA‐1 in the membrane of T cells, induce their conformational changes and thereby increase the binding affinity of LFA‐1 through activating ‘inside‐out’ signalling.28 The nuclear factor κB (NF‐κB) binding site, located upstream of the ICAM‐1 transcription initiation site, is particularly important for the transcription of ICAM‐1.29 1,25(OH)2D3 can reduce nuclear translocation of NF‐κB and decrease the level of NF‐κB in the nucleus.30, 31 Consequently, 1,25(OH)2D3 may reduce the combination of NF‐κB with its binding site and down‐regulate the expression of ICAM‐1 on DCs.
In this study, we found that treatment with 1,25(OH)2D3 significantly down‐regulated the expression of MHC‐II on DCs, the decrease of MHC‐II may reduce the activation of ‘inside‐out’ signalling in T cells and down‐regulate the affinity of LFA‐1 with ICAM‐1.28 VD3‐DCs may reduce the combination of ICAM‐1 and LFA‐1 through the low expression of NF‐κB and MHC‐II.29, 30, 31 These may be the mechanisms by which VD3‐DCs inhibit the migration of pathogenic T cells such as Th1 and Th17 cells.
Although EAE initiates mainly by T cells, humoral immunity also plays a crucial role in disease pathogenesis.32, 33 Breg cells are a specific subset of B cells that negatively regulate immune responses and support immunological tolerance. They have the ability to suppress MS activity through inhibiting Th1 and Th17 differentiation or maintaining Treg cells.34 In our study, the percentage of Breg cells in CD19+ B cells in spleen increased after transferring VD3‐DCs. The increased Breg cells can suppress immune responses thorugh maintenance of Treg cells and prohibition of pathogenic lymphocyte expansion. 35
In conclusion, 1,25(OH)2D3 can induce DCs to tolerogenic DCs, which inhibited EAE. Treatment with VD3‐DCs enhanced the proportions of Treg, CD4+ IL‐10+ T and Breg cells and inhibited infiltration of Th1 and Th17 cells into spinal cord. But VD3‐DCs also increased proportions of Th1 and Th17 cells in spleen and lymph nodes and the levels of some pro‐inflammatory cytokines and IgG in serum. According to the results, we infer that VD3‐DCs alleviated EAE by inhibiting the migration of Th1 and Th17 cells from peripheral organs to the CNS rather than inhibiting the inflammatory response in the periphery. Our findings may provide a rationale for applying a possible immunotherapeutic method in EAE, which may be a highly promising method for treatment of autoimmune disease in humans. However, the exact mechanisms of VD3‐DC in the treatment of EAE still merit further investigation.
Ethics approval
The study received ethics approval from the ethics committee of the First Hospital of Jilin University. The treatments of mice complied with the relevant ethical regulations.
Disclosures
The authors declare no conflict of interest.
Acknowledgements
T.J. conceived and designed the experiments. Z.X., J.C., C.Z., J.W., Y.C. and C.L. performed the experiments and analysed the data. T.J., J.Z. and C.Z. wrote the manuscript text. We are grateful to Xiaofeng Liu, Li Du, Zhongkun Wang, Dan Li, Tete Li, Yaping Yan and Cunjin Zhang for their excellent technical assistance. This work was supported by grants from the General Programme of the National Natural Science Foundation of China (Nos. 81671177 and 81471216), International Science and Technology Cooperation Programme of Jilin Provincial Science and Technology Development of China (No. 20150414011GH), the Technology Innovation Programme of Jilin Provincial Health and Family Planning Commission of China (No. 2016J040), Norman Bethune Cultivation Plan of Jilin University (No. 2015320), Science and Technology Programme of Jilin Provincial Education Department of China (No. 2016‐462), as well as grants from the Swedish Research Council (K2013‐66X‐22337‐01‐3 and project number: 2015‐03005) and the First Hospital, Jilin University of China.
References
- 1. Hewer S, Lucas R, van der Mei I, Taylor BV. Vitamin D and multiple sclerosis. J Clin Neurosci 2013; 20:634–41. [DOI] [PubMed] [Google Scholar]
- 2. Grigoriadis N, van Pesch V. A basic overview of multiple sclerosis immunopathology. Eur J Neurol 2015; 22(Suppl 2):3–13. [DOI] [PubMed] [Google Scholar]
- 3. Steinman RM, Banchereau J. Taking dendritic cells into medicine. Nature 2007; 449:419–26. [DOI] [PubMed] [Google Scholar]
- 4. Ohnmacht C, Pullner A, King SB, Drexler I, Meier S, Brocker T et al Constitutive ablation of dendritic cells breaks self‐tolerance of CD4 T cells and results in spontaneous fatal autoimmunity. J Exp Med 2009; 206:549–59. [DOI] [PMC free article] [PubMed] [Google Scholar]
- 5. Yoo S, Ha SJ. Generation of tolerogenic dendritic cells and their therapeutic applications. Immune Netw 2016; 16:52–60. [DOI] [PMC free article] [PubMed] [Google Scholar]
- 6. Legroux L, Arbour N. Multiple sclerosis and T lymphocytes: an entangled story. J Neuroimmune Pharmacol 2015; 10:528–46. [DOI] [PMC free article] [PubMed] [Google Scholar]
- 7. Mastorodemos V, Ioannou M, Verginis P. Cell‐based modulation of autoimmune responses in multiple sclerosis and experimental autoimmmune encephalomyelitis: therapeutic implications. NeuroImmunoModulation 2015; 22:181–95. [DOI] [PubMed] [Google Scholar]
- 8. Benvenuti F. The dendritic cell synapse: a life dedicated to T cell activation. Front Immunol 2016; 7:70. [DOI] [PMC free article] [PubMed] [Google Scholar]
- 9. Compston A, Coles A. Multiple sclerosis. Lancet 2008; 372:1502–17. [DOI] [PubMed] [Google Scholar]
- 10. Mansilla MJ, Selles‐Moreno C, Fabregas‐Puig S, Amoedo J, Navarro‐Barriuso J, Teniente‐Serra A et al Beneficial effect of tolerogenic dendritic cells pulsed with MOG autoantigen in experimental autoimmune encephalomyelitis. CNS Neurosci Ther 2015; 21:222–30. [DOI] [PMC free article] [PubMed] [Google Scholar]
- 11. Besusso D, Saul L, Leech MD, O'Connor RA, MacDonald AS, Anderton SM et al 1,25‐Dihydroxyvitamin D3‐conditioned CD11c+ dendritic cells are effective initiators of CNS autoimmune disease. Front Immunol 2015; 6:575. [DOI] [PMC free article] [PubMed] [Google Scholar]
- 12. Farias AS, Spagnol GS, Bordeaux‐Rego P, Oliveira CO, Fontana AG, de Paula RF et al Vitamin D3 induces IDO+ tolerogenic DCs and enhances Treg, reducing the severity of EAE. CNS Neurosci Ther 2013; 19:269–77. [DOI] [PMC free article] [PubMed] [Google Scholar]
- 13. Fujimoto Y, Tedder TF. CD83: a regulatory molecule of the immune system with great potential for therapeutic application. J Med Dent Sci 2006; 53:85–91. [PubMed] [Google Scholar]
- 14. Li H, Shi B. Tolerogenic dendritic cells and their applications in transplantation. Cell Mol Immunol 2015; 12:24–30. [DOI] [PMC free article] [PubMed] [Google Scholar]
- 15. Park JH, Jeong SY, Choi AJ, Kim SJ. Lipopolysaccharide directly stimulates Th17 differentiation in vitro modulating phosphorylation of RelB and NF‐κB1. Immunol Lett 2015; 165:10–9. [DOI] [PubMed] [Google Scholar]
- 16. Buc M. Role of regulatory T cells in pathogenesis and biological therapy of multiple sclerosis. Mediators Inflamm 2013; 2013:963748. [DOI] [PMC free article] [PubMed] [Google Scholar]
- 17. Strauss L, Bergmann C, Whiteside TL. Human circulating CD4+ CD25high Foxp3+ regulatory T cells kill autologous CD8+ but not CD4+ responder cells by Fas‐mediated apoptosis. J Immunol 2009; 182:1469–80. [DOI] [PMC free article] [PubMed] [Google Scholar]
- 18. Ito T, Hanabuchi S, Wang YH, Park WR, Arima K, Bover L et al Two functional subsets of FOXP3+ regulatory T cells in human thymus and periphery. Immunity 2008; 28:870–80. [DOI] [PMC free article] [PubMed] [Google Scholar]
- 19. Munn DH, Sharma MD, Mellor AL. Ligation of B7‐1/B7‐2 by human CD4+ T cells triggers indoleamine 2,3‐dioxygenase activity in dendritic cells. J Immunol 2004; 172:4100–10. [DOI] [PubMed] [Google Scholar]
- 20. El‐behi M, Rostami A, Ciric B. Current views on the roles of Th1 and Th17 cells in experimental autoimmune encephalomyelitis. J Neuroimmune Pharmacol 2010; 5:189–97. [DOI] [PMC free article] [PubMed] [Google Scholar]
- 21. Zamani MR, Aslani S, Salmaninejad A, Javan MR, Rezaei N. PD‐1/PD‐L and autoimmunity: a growing relationship. Cell Immunol 2016; 310:27–41. [DOI] [PubMed] [Google Scholar]
- 22. Karin N, Wildbaum G. The role of chemokines in shaping the balance between CD4+ T cell subsets and its therapeutic implications in autoimmune and cancer diseases. Front Immuno 2015; 6:609. [DOI] [PMC free article] [PubMed] [Google Scholar]
- 23. Becher B, Segal BM. TH17 cytokines in autoimmune neuro‐inflammation. Curr Opin Immunol 2011; 23:707–12. [DOI] [PMC free article] [PubMed] [Google Scholar]
- 24. Zietara N, Lyszkiewicz M, Krueger A, Weiss S. B‐cell modulation of dendritic‐cell function: signals from the far side. Eur J Immunol 2014; 44:23–32. [DOI] [PubMed] [Google Scholar]
- 25. DiLillo DJ, Ravetch JV. Fc‐receptor interactions regulate both cytotoxic and immunomodulatory therapeutic antibody effector functions. Cancer Immunol Res 2015; 3:704–13. [DOI] [PubMed] [Google Scholar]
- 26. Chastain EM, Duncan DS, Rodgers JM, Miller SD. The role of antigen presenting cells in multiple sclerosis. Biochim Biophys Acta 2011; 1812:265–74. [DOI] [PMC free article] [PubMed] [Google Scholar]
- 27. Verma NK, Kelleher D. Adaptor regulation of LFA‐1 signaling in T lymphocyte migration: potential druggable targets for immunotherapies? Eur J Immunol 2014; 44:3484–99. [DOI] [PubMed] [Google Scholar]
- 28. Abram CL, Lowell CA. The ins and outs of leukocyte integrin signaling. Annu Rev Immunol 2009; 27:339–62. [DOI] [PMC free article] [PubMed] [Google Scholar]
- 29. Chen CC. Signal transduction pathways of inflammatory gene expressions and therapeutic implications. Curr Pharm Des 2006; 12:3497–508. [DOI] [PubMed] [Google Scholar]
- 30. Cohen‐Lahav M, Shany S, Tobvin D, Chaimovitz C, Douvdevani A. Vitamin D decreases NFκB activity by increasing IκBα levels. Nephrol Dial Transplant 2006; 21:889–97. [DOI] [PubMed] [Google Scholar]
- 31. Brinke TA, Hilkens CM, Cools N, Geissler EK, Hutchinson JA, Lombardi G et al Clinical use of tolerogenic dendritic cells‐harmonization approach in European collaborative effort. Mediators Inflamm 2015; 2015:471719. [DOI] [PMC free article] [PubMed] [Google Scholar]
- 32. Pikor N, Gommerman JL. B cells in MS: why, where and how? Mult Scler Relat Disord 2012; 1:123–30. [DOI] [PubMed] [Google Scholar]
- 33. Jones AP, Kermode AG, Lucas RM, Carroll WM, Nolan D, Hart PH. Circulating immune cells in multiple sclerosis. Clin Exp Immunol 2017; 187:193–203. [DOI] [PMC free article] [PubMed] [Google Scholar]
- 34. Rolf L, Muris AH, Hupperts R, Damoiseaux J. Illuminating vitamin D effects on B cells – the multiple sclerosis perspective. Immunology 2016; 147:275–84. [DOI] [PMC free article] [PubMed] [Google Scholar]
- 35. Rosser EC, Mauri C. Regulatory B cells: origin, phenotype, and function. Immunity 2015; 42:607–12. [DOI] [PubMed] [Google Scholar]