

Summary
Adoptive transfer of T cells is a promising cancer therapy and expression of chimeric antigen receptors can enhance tumour recognition and T‐cell effector functions. The programmed death protein 1 (PD1) receptor is a prospective target for a chimeric antigen receptor because PD1 ligands are expressed on many cancer types, including lymphoma. Therefore, we developed a murine chimeric PD1 receptor (chPD1) consisting of the PD1 extracellular domain fused to the cytoplasmic domain of CD3ζ. Additionally, chimeric antigen receptor therapies use various co‐stimulatory domains to enhance efficacy. Hence, the inclusion of a Dap10 or CD28 co‐stimulatory domain in the chPD1 receptor was compared to determine which domain induced optimal anti‐tumour immunity in a mouse model of lymphoma. The chPD1 T cells secreted pro‐inflammatory cytokines and lysed RMA lymphoma cells. Adoptive transfer of chPD1 T cells significantly reduced established tumours and led to tumour‐free survival in lymphoma‐bearing mice. When comparing chPD1 receptors containing a Dap10 or CD28 domain, both receptors induced secretion of pro‐inflammatory cytokines; however, chPD1‐CD28 T cells also secreted anti‐inflammatory cytokines whereas chPD1‐Dap10 T cells did not. Additionally, chPD1‐Dap10 induced a central memory T‐cell phenotype compared with chPD1‐CD28, which induced an effector memory phenotype. The chPD1‐Dap10 T cells also had enhanced in vivo persistence and anti‐tumour efficacy compared with chPD1‐CD28 T cells. Therefore, adoptive transfer of chPD1 T cells could be a novel therapy for lymphoma and inclusion of the Dap10 co‐stimulatory domain in chimeric antigen receptors may induce a preferential cytokine profile and T‐cell differentiation phenotype for anti‐tumour therapies.
Keywords: CD8 T cell, chimeric antigen receptor, Dap10, immunotherapy, lymphoma
Abbreviations
- aa
amino acid
- CAR
chimeric antigen receptor
- chPD1
chimeric PD1 receptor
- GM‐CSF
granulocyte–macrophage colony‐stimulating factor
- IFN‐γ
interferon‐γ
- IL‐2
interleukin‐2
- mTOR
mammalian target of rapamycin
- NKG2D
natural killer group 2 D
- PD1
programmed death receptor 1
- PDL
programmed death ligand
- TNF‐α
tumour necrosis factor‐α
- wtPD1
wild‐type PD1 receptor
Introduction
Engineering T cells with chimeric antigen receptors (CARs) is one approach to increase T‐cell anti‐tumour efficacy. CARs are used to redirect T‐cell specificity and allow MHC‐independent recognition of tumour‐associated antigens, so enhancing tumour targeting.1, 2 Advantages to using CAR‐modified T cells for cancer therapy include the ability to recognize a broad range of tumour types, overcome the mechanisms that tumours use to escape immune detection, and enhance T‐cell function. Although currently there are some challenges to using CAR T cells for the treatment of solid tumours, CAR T‐cell therapy has shown initial success in clinical trials for haematological malignancies.1, 3, 4
In cancer patients, negative regulation of immune responses often occurs after sustained activation of T cells.5, 6 One such inhibitory receptor that plays an important role in inhibiting anti‐tumour T‐cell responses is the programmed death receptor 1 (PD1, CD279), which is up‐regulated shortly after T‐cell activation and inhibits multiple T‐cell functions downstream of T‐cell receptor and CD28 signalling including proliferation, cytokine production and cytotoxicity.7, 8, 9, 10, 11, 12 The PD1 receptor binds to two different ligands, programmed death ligand 1 (PDL1, B7‐H1, CD274) and programmed death ligand 2 (PDL2, B7‐DC, CD273), both of which are overexpressed on many types of solid tumours and haematological malignancies, including lymphoma.9, 13, 14 PD1 blockade is currently being tested as a novel therapeutic approach in various cancers and has shown durable responses in some patients.11
Due to the overexpression of PDL1 and PDL2 on many different types of tumour cells, we created a chimeric antigen receptor that targets PD1 ligands. The murine chimeric PD1 receptor (chPD1) consists of the extracellular domain of the PD1 receptor fused to the cytoplasmic domain of CD3ζ. By removing the inhibitory domains of PD1 and replacing these with the activating domains of CD3ζ, we switched the negative PD1 signal to become an activating signal for the T cells. This should reduce the immune suppressive effects of PD1 and instead induce anti‐tumour immunity upon interaction with PD1 ligands.
Inclusion of co‐stimulatory domains in CAR T cells can enhance T‐cell functions, including cytokine secretion, differentiation, cytotoxicity, proliferation and survival.15, 16 Compared with first‐generation receptors that do not contain co‐stimulatory domains, CARs containing a CD28 co‐stimulatory domain induce increased T‐cell expansion and cytokine secretion. However, CD28‐containing CAR T cells have shown limited efficacy in clinical trials probably due to a relatively short survival in vivo and an effector cell differentiation phenotype.3, 15, 16, 17, 18, 19 An alternative co‐stimulatory receptor that has been shown to enhance T‐cell effector responses is Dap10. CD28 and Dap10 activate many similar pathways including phosphatidylinositol‐3 kinase, AKT/Protein Kinase B and mitogen‐activate protein kinases.20, 21, 22, 23 However, CD28 and Dap10 stimulation seem to have unique effects on effector T cells, including differential activation of signal transduction pathways including β‐catenin, nuclear factor‐κB and mammalian target of rapamycin (mTOR), leading to dissimilar cytokine secretion and T‐cell differentiation.24, 25, 26, 27, 28, 29 Specifically, when compared with CD28, co‐stimulation through Dap10 induces CD8 T‐cell memory differentiation and secretion of pro‐inflammatory but not anti‐inflammatory cytokines, both of which seem to be preferable characteristics for successful CAR T‐cell therapy.3, 15, 26, 27, 28, 29 Hence, inclusion of the Dap10 co‐stimulatory domain in CARs may be preferential to CD28.
This study determined the anti‐tumour efficacy of chPD1 T cells using a murine model of lymphoma. Expression of the chPD1 receptor containing a Dap10 co‐stimulatory domain in murine T cells increased tumour cell lysis and secretion of pro‐inflammatory cytokines in a PD1‐dependent manner and also decreased tumour burden and increased survival of tumour‐bearing mice. In addition, the anti‐tumour functions of chPD1‐Dap10 T cells were superior when compared with chPD1‐CD28 T cells.
Materials and methods
Generation of wtPD1 and chPD1 constructs
Murine cDNA clones of CD3ζ, PD1, CD28 and Dap10 were purchased from OriGene (Rockville, MD). The chPD1‐Dap10 and chPD1‐CD28 receptors were created by overlapping PCR using Phusion high fidelity DNA polymerase (New England BioLabs, Ipswich, MA). To create the chPD1‐Dap10 receptor, the extracellular domain of the murine PD1 receptor [amino acids (aa) 1–155] was fused in frame to the transmembrane region of CD28 (aa 141–177) and the cytoplasmic domains of Dap10 (aa 57–79) and CD3ζ (aa 52–164). To create the chPD1‐CD28 receptor, the extracellular domain of the murine PD1 receptor (aa 1–155) was fused in frame to the transmembrane (aa 141–177) and cytoplasmic (aa 178–218) domains of CD28 and CD3ζ (aa 52–164). To create the wild‐type PD1 (wtPD1) receptor, the extracellular and transmembrane domain of the PD1 receptor (aa 1–190) was used. All constructs were cloned into the pQCXIN retroviral expression vector using NotI and EcoRI digestion of the plasmid and constructs and were subsequently ligated into the vector. Ecotropic retroviral supernatants were expressed using the EcoPack 2–293 cell line according to the manufacturer's instructions (Clontech, Mountain View, CA). Xfect polymer was used to co‐transfect EcoPack 2–293 cells with the pEco envelope vector and the pQCXIN retroviral expression vector from the RetroX‐Q vector set (Clontech). RetroX Concentrator was used to concentrate the ecotropic retroviral supernatants before transduction of primary murine T cells.
Expression of wtPD1 and chPD1 receptors in T cells
Male C57BL/6 (B6) and B6.SJL‐Ptprc a (Ly5.1 congenic) mice were purchased from Taconic Biosciences (Hudson, NY). Mice were between 8 and 12 weeks of age at the start of each experiment. All animal work was performed in accordance and with approval from Longwood University's Institutional Animal Use and Care Committee. Splenocytes from B6 or Ly5.1 congenic mice were activated with concanavalin A (1 μg/ml) for 18 hr. T cells (0·5 × 106 cells/ml) were transduced by centrifugation at 1000 g for 1 hr in the presence of 8 μg/ml polybrene and 25 U/ml recombinant human interleukin‐2 (IL‐2) and were subsequently cultured for 6 hr before retroviral supernatants were removed and replaced with fresh complete RPMI‐1640 medium supplemented with 10% heat‐inactivated fetal bovine serum, 100 U/ml penicillin, 100 μg/ml streptomycin, 1 mm pyruvate, 10 mm HEPES, 0·1 mm non‐essential amino acids and 50 μm 2‐mercaptoethanol. Two days after infection, T cells were selected in complete RPMI‐1640 medium containing G418 (0·5 mg/ml) plus 25 U/ml recombinant human IL‐2 for an additional 3 days. Viable cells were isolated using Histopaque‐1083 (Sigma, St Louis, MO) and expanded for an additional 2 days without G418 before functional analysis.
RT‐PCR
Total RNA was isolated from RMA cells or T cells using the SV Total RNA isolation kit according to the manufacturer's instructions (Promega, Madison, WI). cDNA was created using RevertAid First Strand cDNA synthesis kit using random hexamer primers (Fermentas, Waltham, MA). As a template for RT‐PCR, 100 ng of cDNA was used to measure gene expression of PDL1, PDL2 and β‐actin. Maxima SYBRGreen qPCR Master Mix (Thermo Scientific, Waltham, MA) and gene specific primers were used: β‐actin F 5′‐GTGTGATGGTGGGAATGGGTCAGA‐3′, β‐actin R 5′‐TACGACCAGAGGCATACAGGGACA, PDL1 F 5′‐GCTCCAAAGGACTTGTACGTG‐3′, PDL1 R 5′‐TGATCTGAAGGGCAGCATTTC‐3′, PDL2 F 5′‐CTGCCGATACTGAACCTGAGC‐3′, PDL2 R 5′‐GCGGTCAAAATCGCACTC‐3′. Gene‐specific primers for T‐cell differentiation genes T‐bet, BLIMP1, Eomes and BCL6 were previously described.29 Primers were purchased from Integrated DNA Technologies (Coralville, IA).
Flow cytometry
The expression of PDL1 and PDL2 on RMA and T cells and of PD1 on T cells was tested using flow cytometry. Cells were stained with allophycocyanin‐labelled anti‐PDL1 (clone 10F.9G2), phycoerythrin‐labelled anti‐PDL2 (clone TY25), or phycoerythrin‐labelled anti‐PD1 (clone RMP1‐30) antibodies or isotype controls. For T‐cell differentiation studies, wtPD1 or chPD1 T cells (2 × 10⁵ cells/well) were stimulated with RMA cells (2 × 10⁵ cells/well) for 24 hr and were analysed for cell surface marker expression by flow cytometry. Cells were stained with phycoerythrin‐conjugated anti‐CD127 (clone A7R34) or anti‐KLRG1 (clone 2F1/KLRG1) and allophycocyanin‐conjugated anti‐CD62L (clone MEL‐14) or isotype controls. To analyse T‐cell surface expression, RMA cells were labelled with CFSE before incubation and CFSE+ cells were gated out. All antibodies were purchased from BioLegend (San Diego, CA). Cell fluorescence was measured using an Accuri C6 flow cytometer.
Cytokine production and cytotoxicity by chPD1 T cells
The chPD1, wtPD1 and non‐transduced T cells (105) were cultured with RMA cells (105) or medium in a round‐bottom 96‐well plate. After 24 hr, cell‐free supernatants were tested for the presence of interferon‐γ (IFN‐γ), tumour necrosis factor‐α (TNF‐α), granulocyte–macrophage colony‐stimulating factor (GM‐CSF), IL‐2 and IL‐10 by ELISA according to the manufacturer's instructions (BioLegend). Cytokine and chemokine secretion was also measured in cell‐free supernatants using mouse T helper cytokine and mouse pro‐inflammatory chemokine LEGENDPlex assays (BioLegend) according to the manufacturer's instructions.
To determine lysis of tumour cells, chPD1, wtPD1 and non‐transduced T cells (105) were cultured with RMA at various effector to target ratios (E : T 25 : 1, 5 : 1, and 1 : 1). Specific lysis was measured after 5 hr using a lactate dehydrogenase cytotoxicity assay kit (Pierce, Waltham, MA) according to the manufacturer's instructions. To block PD1 receptors, T cells were pre‐incubated at 37° for 2 hr with anti‐PD1 monoclonal antibodies (clone RMP1‐14, 20 μg/ml, Low Endotoxin, Azide‐Free LEAF purified, BioLegend) or isotype control monoclonal antibodies before addition of target cells.
Treatment of mice with genetically modified T cells
RMA and RMA‐GFP cells were kindly provided by Dr Charles Sentman at Dartmouth Medical School (Lebanon, NH), and were grown in complete RPMI‐1640. RMA‐GFP cells (2 × 10⁶) were injected intravenously into B6 mice. For tumour burden experiments, mice were administered one dose of wtPD1 or chPD1‐modified T cells (5 × 10⁶) intravenously 2 days or 5 days after tumour injection, or two doses of T cells 5 and 8 days after tumour injection. For determination of tumour burden, spleens and lymph nodes (axillary, brachial and inguinal) were collected 13 days after tumour injection. The lymphoid tissues were mechanically teased and red blood cells were lysed with ACK lysis buffer (0·15 mol/l NH4Cl, 1 mmol/l KHCO3, 0·1 mmol/l). Cells were counted and the percentage of GFP+ cells was determined via flow cytometry. The total number of tumour cells was determined by multiplying the percentage of GFP+ cells by the total number of cells. For survival studies, mice were treated with wtPD1 or chPD1 T cells (5 × 10⁶) on day 5 and 8 after tumour cell injection. The health of the mice was monitored closely and mice were killed when signs of stress (laboured breathing, dragging legs, hunched back, or ruffled fur) were observed. For analysis of T‐cell survival, RMA‐bearing mice were treated 5 days after tumour cell injection with congenic Ly5.1+ chPD1‐Dap10 or chPD1‐CD28 T cells (5 × 10⁶) intravenously and mice were killed 1, 3, 7, 10, 14 or 18 days after T‐cell injection. Spleen and lymph node cells were incubated with FcR block and mouse γ‐globulin (Jackson ImmunoResearch, West Grove, PA) to prevent non‐specific binding, and stained with phycoerythrin‐conjugated anti‐CD3 and allophycocyanin‐conjugated anti‐CD45.1 (clone A20) and analysed by flow cytometry.
Statistical analysis
Statistical analysis was conducted using an unpaired, two‐tailed Student's t‐test or analysis of variance with a post‐hoc Tukey test when comparing multiple groups. The data were determined to be normally distributed using the Shapiro–Wilk test. The program R was used for statistical analysis of the data. All experiments were run in triplicate on at least two independent sets of T cells and P values < 0·05 were considered significant. For survival studies, Kaplan–Meier survival curves were plotted and analysed using the Log rank test and prism software (graphpad Software, San Diego, CA).
Results
chPD1 T cells secrete pro‐inflammatory cytokines and lyse PDL‐expressing RMA cells in a PD1‐dependent manner
To target PD1 ligands expressed on tumour cells, a chPD1 receptor was created by fusing the extracellular region of the PD1 receptor with the intracellular regions of the Dap10 co‐stimulatory receptor and CD3ζ (Fig. 1a). A wtPD1 receptor consisting of the extracellular and transmembrane domains of the PD1 receptor was also created as a control. The chPD1 and wtPD1 receptors were successfully expressed in activated murine T cells as shown by an increased cell surface expression of the PD1 receptor compared with non‐transduced, activated T cells (Fig. 1b). Both wtPD1 and chPD1 T cells consisted of a mix of activated CD4+ (~10%) and CD8+ (~90%) T cells (data not shown).
Figure 1.
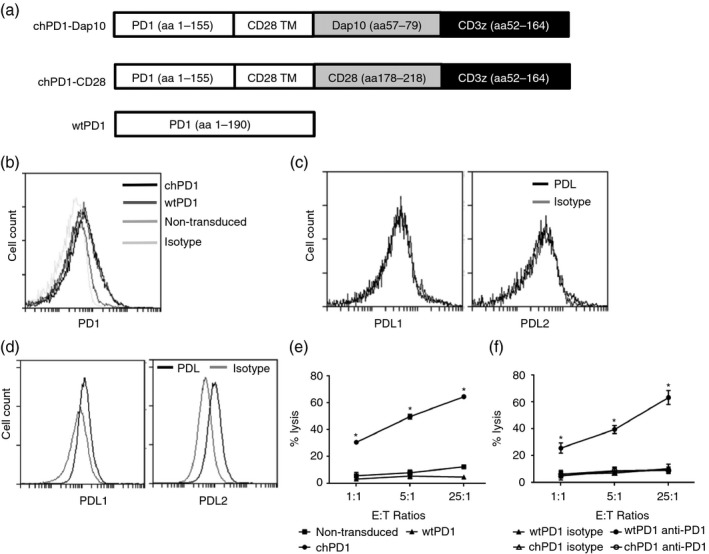
Chimeric programmed death 1 (chPD1) T cells lyse programmed death ligand (PDL) ‐expressing RMA cells in a PD1‐dependent manner. (a) Representative vector map of the chPD1‐Dap10, chPD1‐CD28, and wild‐type (wt) PD1 receptors. (b) Effector murine non‐transduced (medium grey), wtPD1 (dark grey), or chPD1 (black) T cells were stained with anti‐PD1 or isotype control (light grey) antibodies or (c) murine chPD1 T cells were stained with anti‐PDL1 or anti‐PDL2 (black) or isotype control (light grey) antibodies and were analysed using flow cytometry. (d) RMA cells were stained with anti‐PDL1 or ‐PDL2 (black) or isotype control (grey) antibodies and were analysed using flow cytometry. (e) Non‐transduced (squares), wtPD1 (triangles) or chPD1 (circles) T cells were used as effector cells with RMA cells at the indicated effector to target (E : T) ratios (1 : 1, 5 : 1, 25 : 1) and cell lysis was measured using a lactate dehydrogenase assay. chPD1 T cells had significantly higher specific lysis at all E : T ratios compared with non‐transduced or wtPD1 T cells (*P < 0·0001). (f) To show PD1 receptor dependence, wtPD1 or chPD1 T cells were incubated with anti‐PD1 antibodies (open symbols), or with control IgG antibodies (closed symbols) before incubation with tumour cells. Blocking the PD1 receptor significantly reduced the cytotoxicity of chPD1 T cells against tumour cells at all ratios compared with control (*P < 0·001). Data are presented as mean + SD and are representative of at least three experiments.
Sometimes activated T cells express PDL1, which could potentially cause chPD1 T cells to kill each other.9 Therefore, the expression of PDL1 and PDL2 was assessed on chPD1 T cells. The number of chPD1 T cells obtained was similar to the number of wtPD1 T cells for all T‐cell batches tested. In addition, significant PDL1 or PDL2 expression on chPD1 and wtPD1 T cells was not observed (Fig. 1c and data not shown). Finally, a significant level of cell death was not observed when wtPD1 or chPD1 T cells were cultured in media only (data not shown). These data suggest that chPD1 T cells do not express significant levels of PDL.
To determine if the murine lymphoma cell line RMA was a potential target of chPD1 T cells, the expression of PDL1 and PDL2 was measured. RMA cells expressed cell surface PDL1 and PDL2, as determined by flow cytometry (Fig. 1d). RT‐PCR for PD1 ligands was also performed, and RMA cells expressed mRNA for PDL1 and PDL2 (data not shown). The chPD1 T cells lysed RMA cells significantly more than T cells expressing a wtPD1 receptor or non‐transduced, effector T cells (Fig. 1e). This lysis was dependent on the PD1 receptor because incubating the T cells with blocking anti‐PD1 antibodies before the assay abolished the killing of tumour cells by chPD1 T cells (Fig. 1f).
In addition to tumour cell lysis, T cells secrete pro‐inflammatory cytokines to enhance antitumour immunity.15, 30 Compared with non‐transduced or wtPD1 T cells, chPD1 T cells secreted significant amounts of pro‐inflammatory cytokines IFN‐γ, TNF‐α, GM‐CSF and IL‐2 but did not secrete anti‐inflammatory cytokine IL‐10 when cultured with RMA cells. (Fig. 2). Together, these data show that RMA cells expressed PD1 ligands and that expression of the chPD1 receptor induced pro‐inflammatory cytokine secretion and lysis of the RMA murine lymphoma cell line.
Figure 2.
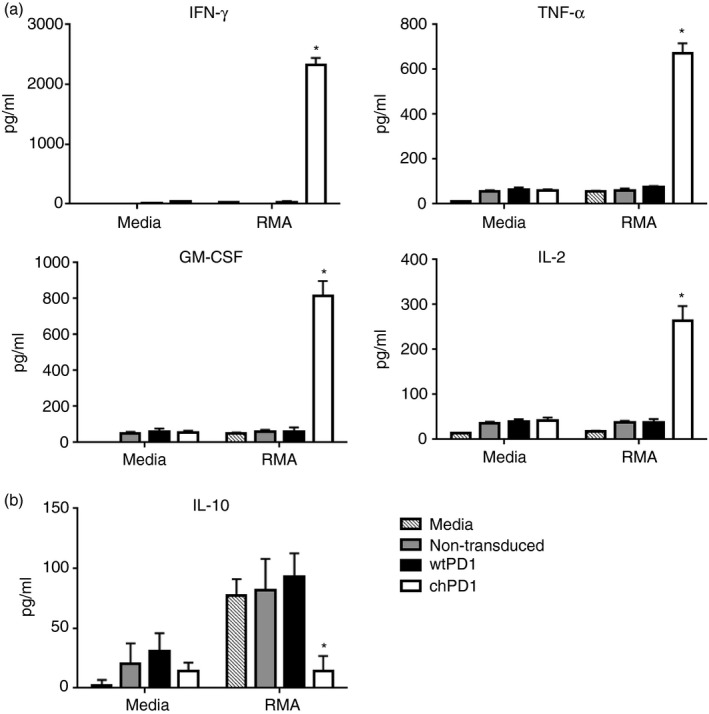
Culture of RMA cells with chimeric programmed death 1 (chPD1) T cells results in secretion of pro‐inflammatory cytokines. Non‐transduced (grey), wild‐type (wt) PD1‐expressing (black), or chPD1‐expressing (open) T cells were cultured with RMA cells or media. After 24 hr, secretion of (a) pro‐inflammatory cytokines interferon‐γ (IFN‐γ), tumour necrosis factor‐α (TNF‐α), granulocyte–macrophage colony‐stimulating factor (GM‐CSF) and interleukin‐2 (IL‐2) and (b) anti‐inflammatory cytokine IL‐10 was measured in cell‐free supernatants by ELISA. The chPD1 T cells produced higher levels of pro‐inflammatory cytokines and decreased levels of anti‐inflammatory cytokines compared with wtPD1 T cells when cultured with RMA cells (*P < 0·001). Data are presented as mean + SD and are representative of at least three experiments.
Treatment with chPD1 T cells leads to a reduction in tumour burden and an increase in survival of RMA‐GFP‐bearing mice
When injected intravenously into mice, RMA tumour cells traffic to the spleen and lymph nodes; hence, this model recapitulates features of human lymphoma in syngeneic, immunocompetent mice.31 Therefore, the potential of using chPD1 T cells in vivo as a therapy for lymphoma was investigated. Because ligands for PD1 may also be expressed on healthy tissues, the safety of chPD1 T cells was first tested. The chPD1 T cells did not lyse or secrete IFN‐γ when cultured with splenocytes, liver cells or lung cells isolated from a naive mouse. In addition, after injection of chPD1 T cells, naive mice did not show any adverse symptoms or increased levels of serum IFN‐γ, suggesting that chPD1 T cells did not target healthy tissues (data not shown). Next, to test the anti‐tumour efficacy of chPD1 T cells, lymphoma‐bearing mice were treated with a single dose of chPD1 T cells 2 days after tumour cell injection and tumour burden was measured in the spleen and lymph nodes (Fig. 3a). Compared with mice treated with PBS or wtPD1 T cells, RMA tumour burden was significantly decreased in mice treated with chPD1 T cells. The tumour burden in mice treated with PBS or wtPD1 T cells was not significantly different, indicating that wtPD1 T cells did not decrease tumour burden.
Figure 3.
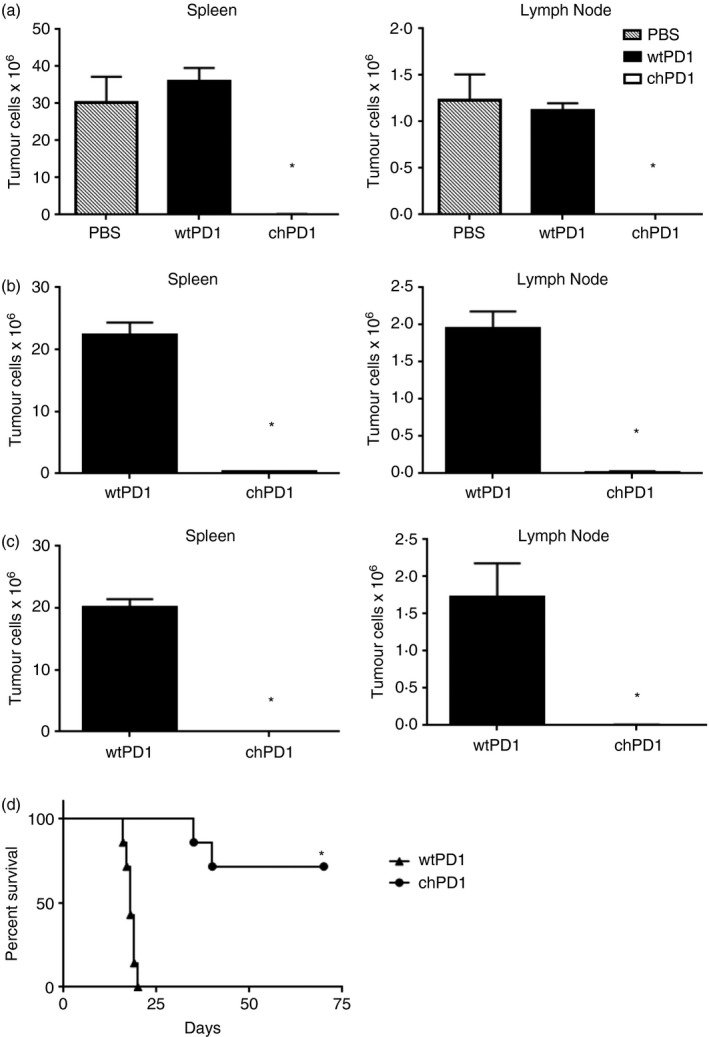
Treatment with chimeric programmed death 1 (chPD1) T cells leads to a reduction in tumour burden and an increase in survival of RMA‐GFP‐bearing mice. RMA‐GFP cells (2 × 10⁶) were injected intravenously (i.v.) into B6 mice on day 0. Mice were treated i.v. with a single treatment of PBS (grey) or wild‐type (wt) PD1 (black) or chPD1 (open) T cells (5 × 10⁶) after (a) 2 days, (b) 5 days or (c) two doses of wtPD1 or chPD1 T cells after 5 and 8 days. Mice were killed 13 days after RMA‐GFP cell injection and tumour burden was determined by calculating the number of RMA‐GFP cells in the spleen and lymph node (n = 6). (d) Mice were treated i.v. with two doses of wtPD1‐ or chPD1 T cells after 5 and 12 days and survival of the mice was determined (n = 7). The chPD1 T cells significantly reduced RMA tumour burden and increased survival compared with wtPD1 T cells or PBS (*P < 0·01). Data are presented as mean + SD and are representative of two independent experiments.
To test the in vivo therapeutic efficacy of chPD1 T cells against a more established tumour burden, mice were treated with wtPD1 or chPD1 T cells 5 days after tumour cell injection. Treatment with chPD1 T cells significantly reduced these established tumours, although there was a low yet detectable level of tumour cells in the spleens and lymph nodes of the chPD1 T‐cell‐treated mice (Fig. 3b). As previous studies have shown that multiple treatments with CAR T cells enhance anti‐tumour efficacy, tumour‐bearing mice were injected with two treatments of wtPD1 or chPD1 T cells 5 and 8 days after tumour cell injection.3, 30, 31, 32 Mice treated with two doses of chPD1 T cells had undetectable tumour levels of tumour cells (Fig. 3c). In addition, compared with mice treated with wtPD1 T cells that succumbed to tumours by day 20 after tumour cell injection, mice treated with two doses of chPD1 T cells had a significant increase in survival and there was long‐term, tumour‐free survival in 70% of lymphoma‐bearing mice (Fig. 3d). These data show that chPD1 T‐cell treatment of established lymphoma increased survival, and multiple doses of chPD1 T cells led to long‐term survival in tumour‐bearing mice.
chPD1‐Dap10 T cells secrete increased levels of pro‐inflammatory cytokines and decreased levels of anti‐inflammatory cytokines compared with chPD1‐CD28 T cells
The inclusion of co‐stimulatory domains in CARs enhances T‐cell anti‐tumour effector functions and each co‐stimulatory receptor has a unique effect on T cells.15, 16 Therefore to compare the inclusion of the Dap10 domain with another commonly studied co‐stimulatory receptor, a chPD1 receptor was made that contained the cytoplasmic domain of CD28 instead of the Dap10 cytoplasmic domain (Fig. 1a). One effector function that often differs between co‐stimulatory receptors is their ability to induce cytokine secretion.26, 27, 28 Therefore, the secretion of pro‐ and anti‐inflammatory cytokines by chPD1‐Dap10 and chPD1‐CD28 T cells was compared. Although secretion of IFN‐γ was similar, chPD1‐Dap10 T cells secreted higher amounts of pro‐inflammatory cytokines TNF‐α, GM‐CSF, IL‐17 and IL‐21. Comparatively, chPD1‐CD28 T cells secreted more IL‐2 and T helper type 2/anti‐inflammatory cytokines IL‐5 and IL‐10 (Fig. 4a). The chPD1‐Dap10 and chPD1‐CD28 T cells also secreted similar amounts of inflammatory chemokines regulated on activation, normal T cell expressed and secreted (RANTES) macrophage inflammatory proteins 1α and 1β. Although the cytokine secretion profile of the two CARs was different, there was no significant difference in T‐cell proliferation, survival or tumour cell lysis by chPD1‐Dap10 and chPD1‐CD28 T cells (Fig. 4c and data not shown). Hence, there were some significant differences in the effector functions induced by these receptors, particularly with the induction of differential cytokine secretion.
Figure 4.
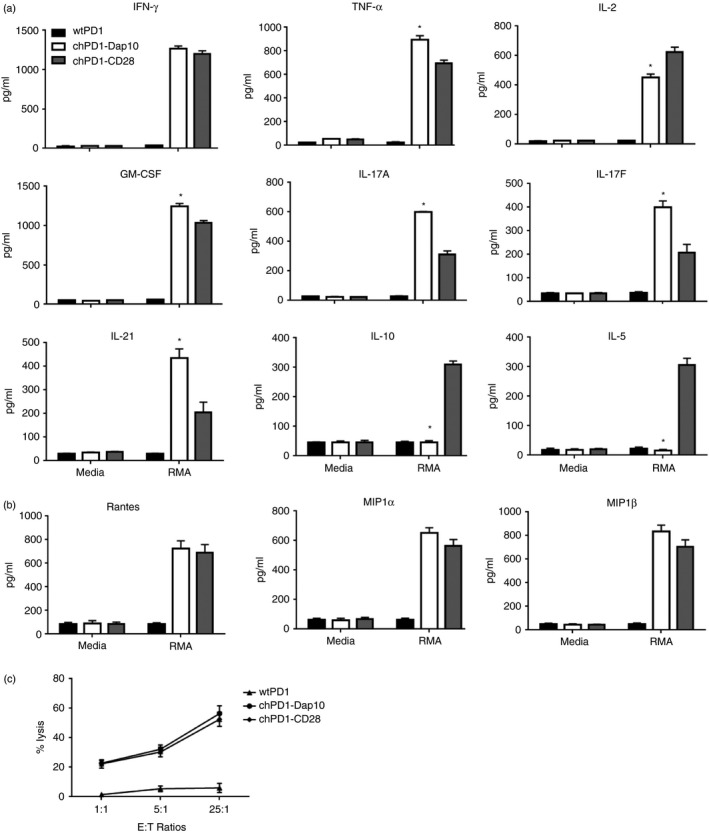
Chimeric programmed death 1 (chPD1) ‐Dap10 T cells secrete increased levels of pro‐inflammatory cytokines and decreased levels of anti‐inflammatory cytokines compared with chPD1‐CD28 T cells. T cells expressing wild‐type (wt) PD1‐ (black), chPD1‐Dap10 (open), or chPD1‐CD28 (grey) were cultured with RMA cells or media. After 24 hr, secretion of (a) cytokines and (b) chemokines was measured in cell‐free supernatants by ELISA or LEGENDplex analysis. The chPD1‐Dap10 T cells produced higher levels of pro‐inflammatory cytokines and decreased levels of anti‐inflammatory cytokines compared with wtPD1‐ or chPD1‐CD28 T cells when cultured with RMA cells (*P < 0·01). (c) wtPD1 (triangles), chPD1‐Dap10 (circles), or chPD1‐CD28 (diamonds) T cells were used as effector cells with RMA cells at the indicated effetor tp target (E : T) ratios (1 : 1, 5 : 1, 25 : 1) and cell lysis was measured using a lactate dehydrogenase assay. Data are presented as mean + SD and are representative of at least three experiments.
Inclusion of Dap10 co‐stimulatory domain induces a central memory phenotype in chPD1 T cells
Another characteristic that is important for CAR T‐cell efficacy is the differentiation phenotype of the T cells. CD28‐containing CARs often induce an effector memory or effector cell phenotype and do not live as long in vivo whereas CARs that induce a central memory phenotype usually persist longer in vivo and often have stronger anti‐tumour efficacy.3 Stimulation of natural killer group 2D (NKG2D)/Dap10 has recently been shown to induce a central memory phenotype in murine effector CD8 cells, so the differentiation phenotype of chPD1‐Dap10 and chPD1‐CD28 T cells was compared.29 When cultured with RMA cells, chPD1‐CD28 T cells increased the gene expression of transcription factors involved in effector cell differentiation, T‐bet and BLIMP‐1, whereas chPD1‐Dap10 T cells increased the expression of transcription factors that support central memory differentiation, Eomes and BCL‐6 (Fig. 5a). Additionally, chPD1‐Dap10 T cells expressed cell surface markers associated with a central memory phenotype (CD127hi, CD62Lhi, KLRG1lo) and chPD1‐CD28 T cells expressed effector memory phenotype markers (CD127lo, CD62Llo, KLRG1hi) (Fig. 5b). These data indicate that the chPD1‐Dap10 and chPD1‐CD28 receptors induce different T‐cell phenotypes, which could potentially contribute to altered in vivo anti‐tumour efficacy.
Figure 5.
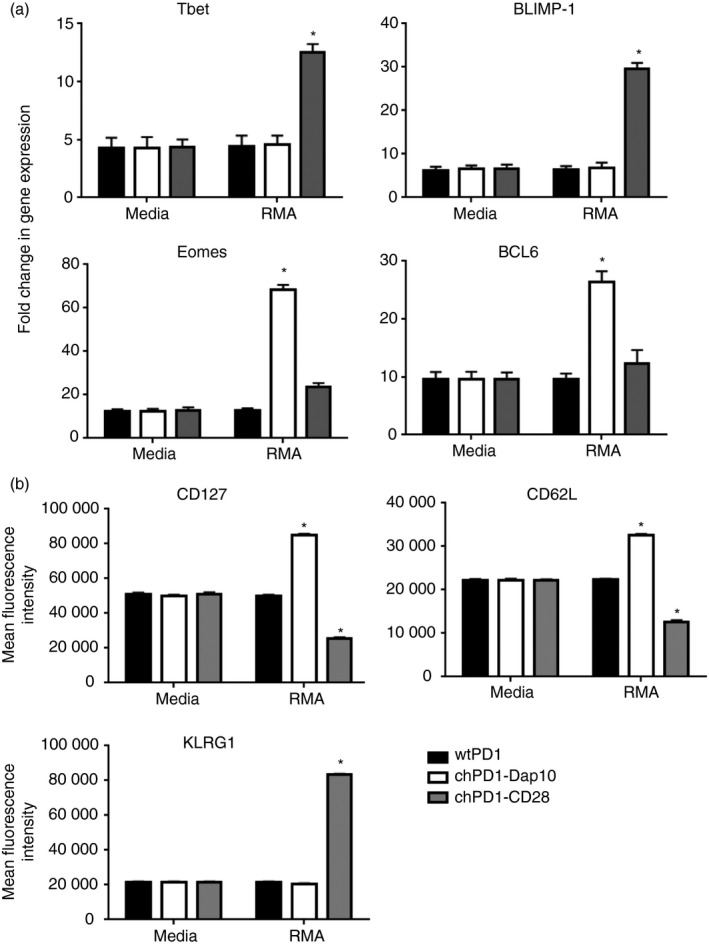
Inclusion of Dap10 co‐stimulatory domain induces a central memory phenotype in chimeric programmed death 1 (chPD1) T cells. T cells expressing wild‐type (wt) PD1‐ (black), chPD1‐Dap10 (open), or chPD1‐CD28 (grey) were cultured with RMA cells or media. After 24 hr, (a) expression of genes that control effector and central memory differentiation was measured by RT‐PCR or (b) cell surface marker expression was measured by flow cytometry. Stimulation with RMA cells altered gene or cell surface marker expression compared with culturing in media (*P < 0·01). Data are presented as mean + SD and are representative of at least two experiments.
Treatment with chPD1‐Dap10 T cells leads to a greater reduction in tumour burden and increased survival of RMA‐GFP‐bearing mice compared with treatment with chPD1‐CD28 T cells
To compare the in vivo therapeutic efficacy of chPD1‐Dap10 and chPD1‐CD28 T cells, lymphoma‐bearing mice were treated with two doses of wtPD1, chPD1‐Dap10 or chPD1‐CD28 T cells. Treatment with chPD1‐Dap10 or chPD1‐CD28 T cells significantly reduced tumour burden, but chPD1‐Dap10 T cells reduced tumour burden significantly more than chPD1‐CD28 T cells (Fig. 6a). In addition, treatment with two doses of chPD1‐Dap10 T cells led to long‐term, tumour‐free survival in a higher percentage of mice (66% of mice) compared with mice treated with chPD1‐CD28 T cells (14% of mice) (Fig. 6b). One potential factor that contributed to the enhanced anti‐tumour efficacy of chPD1‐Dap10 T cells was their increased in vivo persistence in the spleens and lymph nodes of lymphoma‐bearing mice (Fig. 6c). Ly5.1+ chPD1‐Dap10 T cells were still detectable by flow cytometry in the spleen and lymph nodes 14 days after T‐cell injection, whereas the chPD1‐CD28 T cells were not detected after day 10. Taken together, these data indicate that chPD1 T cells can reduce tumour burden and increase survival in this mouse model of lymphoma and that inclusion of a Dap10 co‐stimulatory domain has enhanced in vivo therapeutic efficacy compared with a CD28‐containing chPD1 receptor.
Figure 6.
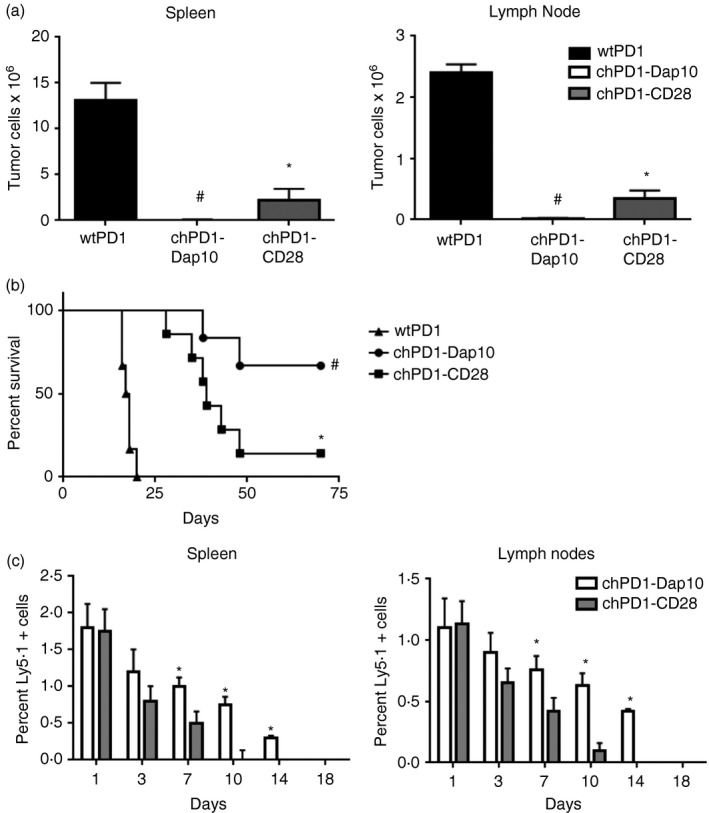
Treatment with chimeric programmed death 1 (chPD1) ‐Dap10 T cells leads to a greater reduction in tumour burden and increased survival of RMA‐GFP‐bearing mice compared with treatment with chPD1‐CD28 T cells. RMA‐GFP cells (2 × 10⁶) were injected intravenously (i.v.) into B6 mice on day 0. Mice were treated i.v. with two doses of wild‐type (wt) PD1 (black), chPD1‐Dap10 (open), or chPD1‐CD28 (grey) T cells (5 × 10⁶) after 5 and 8 days. (a) Mice were killed 13 days after RMA‐GFP cell injection and tumour burden was determined by calculating the number of RMA‐GFP cells in the spleen and lymph node (n = 6). (b) Survival of the mice was determined (n = 6). The chPD1‐CD28 T cells significantly reduced RMA tumour burden and increased survival compared with wtPD1 T cells(*P < 0·01). chPD1‐Dap10 T cells significantly reduced RMA tumour burden and increased survival better than chPD1‐CD28 T cells (# P < 0·01). (c) RMA‐bearing mice were treated with 5 × 10⁶ Ly5.1+ chPD1‐Dap10 (open) or chPD1‐CD28 (grey) T cells i.v. 5 days after tumour cell injection. Spleen and lymph node cells were isolated at various time‐points after T‐cell injection and the percentage of Ly5.1+ CD3+ cells was calculated (n = 4). chPD1‐Dap10 T cells had increased persistence in vivo compared with chPD1‐CD28 T cells (*P < 0·01). Data are presented as mean + SD and are representative of two independent experiments.
Discussion
The introduction of CARs has dramatically increased the potential efficacy of T‐cell therapy for cancer.1, 3, 33 However, the up‐regulation of inhibitory receptor expression on T cells, including expression of the PD1 receptor, and expression of inhibitory ligands in the tumour microenvironment limit CAR T‐cell responses and efficacy.9, 34, 35, 36 This study demonstrates that expression of the novel chPD1 receptor enhances T‐cell anti‐tumour efficacy in a mouse model of lymphoma. Our results suggest that chPD1 receptor‐transduced T cells target PDL expression on tumours and that interaction with PDL induces activation instead of inhibition of the T cells. The chPD1‐expressing T cells secreted pro‐inflammatory cytokines and lysed PDL‐expressing tumour cells and also reduced tumour burden and increased tumour‐free survival in lymphoma‐bearing mice. In addition, the chPD1 receptor containing a Dap10 co‐stimulatory domain appeared to be functionally superior compared with the chPD1 receptor containing a CD28 co‐stimulatory domain.
Many new mechanisms to shield T cells from PD1 inhibition are being developed. In addition to PD1 blockade, expression of a PD1‐CD28 switch receptor, which replaces the cytoplasmic domain of PD1 with the cytoplasmic domain of CD28, has been shown to prevent T‐cell inhibition.37, 38, 39, 40 When co‐expressed with a tumour‐specific T‐cell receptor or CAR, the PD1‐CD28 switch receptor induces T‐cell activation as shown by extracellular signal regulated kinase phosphorylation, cytokine secretion, proliferation, granzyme B expression and enhanced anti‐tumour function.37, 38, 39, 40 A primary goal of our study was to test the efficacy of T cells expressing a CAR that directly connects the PD1‐extracellular domain to the intracellular domains of Dap10 or CD28 and CD3ζ, so providing both the activation and co‐stimulatory signal all within the same receptor and eliminating the need for co‐expressing two receptors in the T cells. Furthermore, many of the previous PD1 switch receptor studies tested the anti‐tumour efficacy of human T cells in immunodeficient mouse models.37, 38 However, CAR T cells often require the induction of host immune responses for full anti‐tumour efficacy.15, 30, 31, 32 In addition, testing human CAR T‐cell efficacy in immunodeficient mice does not investigate the role of other immune cells, including myeloid‐derived suppressor cells and regulatory T cells, in the anti‐tumour immune response. Therefore, the creation of a murine chPD1 receptor allows the study of chPD1 T‐cell efficacy in an immunocompetent host and represents the tumour microenvironment the T cells would be likely to encounter in patients.
The inclusion of a co‐stimulatory domain in CARs increases antitumour efficacy and the majority of CAR T‐cell clinical trials are using second‐generation CARs consisting of CD3ζ and CD28 or 4‐1BB co‐stimulatory domains.1, 3, 4, 15, 16, 33, 41 One difference that is observed between CAR T cells with CD28 or 4‐1BB signalling domains is that inclusion of 4‐1BB induces a central memory phenotype, and these T cells persist longer in vivo, and have stronger anti‐tumour efficacy whereas T cells with a CD28‐CAR induce an effector memory or effector cell phenotype and do not live as long in vivo.3, 42 The induction of a central memory phenotype in T cells expressing a 4‐1BB‐containing CAR was partially caused by a distinct metabolic signature that included enhanced respiratory capacity, increased fatty acid oxidation and enhanced mitochondrial biogenesis, whereas CAR T cells with CD28 domains induced effector memory cells and had an enhanced glycolysis signature.42 In this current study, the inclusion of the Dap10 co‐stimulatory domain induced superior anti‐tumour immunity in vivo. This could potentially be caused by the induction of a central memory phenotype and enhanced in vivo survival of the chPD1‐Dap10 T cells. Stimulation of NKG2D/Dap10 has recently been shown to induce a central memory phenotype in murine effector CD8 cells in part due to differential activation of mTOR.29 Interestingly, mTOR activates specific metabolic pathways in T cells such as aerobic glycolysis and compared with CD28 co‐stimulation, activation through NKG2D/Dap10 shows weaker activation of mTOR.29, 43 Hence, the induction of mTOR activation, metabolism and cell differentiation are likely key characteristics in CAR T‐cell success. In future studies, it would be interesting to further study the mechanisms that control the differentiation of chPD1‐Dap10 and chPD1‐CD28 T cells to determine if chPD1‐Dap10 T cells are more efficacious due to the induction of a central memory phenotype, enhanced in vivo survival, and altered metabolic state. In addition, chPD1‐Dap10 T cells and chPD1 receptors including other co‐stimulatory domains such as 4‐1BB should be compared in the future to further determine which co‐stimulatory receptor is ideal for anti‐tumour responses.
In the clinic, one of the adverse effects following infusion of CAR T cells is the onset of immune activation, known as cytokine release syndrome.44, 45 This may include elevation of cytokines including IFN‐γ, GM‐CSF, IL‐10 and IL‐6 following CAR T‐cell infusion and the dramatic increase in cytokines generally correlates with expansion and activation of adoptively transferred cells.45 In this study, one difference observed between chPD1‐Dap10 and chPD1‐CD28 T cells was the differential expression of cytokines, with chPD1‐Dap10 T cells secreting higher amounts of pro‐inflammatory cytokines TNF‐α, GM‐CSF, IL‐17 and IL‐21 and chPD1‐CD28 T cells secreting more IL‐2 and T helper type 2/anti‐inflammatory cytokines IL‐5 and IL‐10 (Fig. 4). Although the secretion of pro‐inflammatory cytokines is beneficial for anti‐tumour immunity and the concurrent secretion of anti‐inflammatory cytokines can inhibit the immune response, the challenge may lie in selecting the appropriate CAR design to mitigate or prevent uncontrolled inflammation without hindering the antitumour efficacy of T cells. Tumour‐bearing mice receiving chPD1 T cells did not show any adverse effects following treatment and survived long‐term; however, the degree of cytokine release syndrome severity is probably dictated by disease burden at the time of infusion.44, 45, 46, 47 Although the high secretion of inflammatory cytokines from chPD1‐Dap10 T cells probably contributes to their stronger anti‐tumour efficacy, in future studies, it will be essential to monitor cytokine release syndrome symptoms in mice with even higher tumour burdens to determine if the secretion of pro‐inflammatory cytokines may induce damaging amounts of inflammation. In addition, combination of chPD1‐Dap10 T cells with agents that prevent cytokine release syndrome, such as IL‐6R blockade, should be tested.
In this study, inclusion of the Dap10 co‐stimulatory domain in the chPD1 receptor did not induce secretion of IL‐10 whereas inclusion of the CD28 domain did. CD28‐induced secretion of IL‐10 has been shown to alter T‐cell anti‐tumour responses through down‐regulation of MHC molecules, CD28 ligands and intercellular adhesion molecule‐1 on antigen‐presenting cells.48 As a consequence, host T‐cell responses are inhibited and the secretion of pro‐inflammatory cytokines is repressed. In addition, secretion of anti‐inflammatory cytokines has been shown to not only inhibit CAR T‐cell efficacy but also to induce chronic toxicity in some studies.49 Therefore, it will be interesting to determine if the decrease in IL‐10 secretion from chPD1‐Dap10 T cells contributes to their enhanced in vivo anti‐tumour efficacy in future studies.
In summary, we developed a new chPD1 receptor that induces strong antitumour T‐cell responses and induction of long‐term, tumour‐free survival in an immunocompetent mouse model of lymphoma. The strong induction of pro‐inflammatory cytokines induced by inclusion of a Dap10 co‐stimulatory receptor may be beneficial for anti‐tumour therapy and it will be interesting to investigate the efficacy of these T cells against solid tumours in future studies.
Disclosure
The authors declare no conflict of interest.
Acknowledgements
Adam Lynch, William Hawk, Emily Nylen, Sean Ober, Pierre Autin and Amorette Barber performed the experiments and designed the study, and Amorette Barber wrote the paper. This work was supported in part by Longwood University's Faculty Research Grants, PRISM programme and Department of Biological and Environmental Sciences and Virginia Academy of Science's Mary Louise Olds Andrews Cancer Grant.
References
- 1. Johnson LA, June CH. Driving gene‐engineered T cell immunotherapy of cancer. Cell Res 2017; 27:38–58. [DOI] [PMC free article] [PubMed] [Google Scholar]
- 2. Chmielewski M, Hombach AA, Abken H. Antigen‐specific T‐cell activation independently of the MHC: chimeric antigen receptor‐redirected T cells. Front Immunol 2013; 4:371. [DOI] [PMC free article] [PubMed] [Google Scholar]
- 3. Holzinger A, Barden M, Abken H. The growing world of CAR T cell trials: a systematic review. Cancer Immunol Immunother 2016; 65:1433–50. [DOI] [PMC free article] [PubMed] [Google Scholar]
- 4. Yong CS, Dardalhon V, Devaud C, Taylor N, Darcy PK, Kershaw MH. CAR T‐cell therapy of solid tumors. Immunol Cell Biol 2017; 95:356–63. [DOI] [PubMed] [Google Scholar]
- 5. Wherry EJ. T cell exhaustion. Nat Immunol 2011; 12:492–9. [DOI] [PubMed] [Google Scholar]
- 6. Speiser DE, Ho PC, Verdeil G. Regulatory circuits of T cell function in cancer. Nat Rev Immunol 2016; 16:599–611. [DOI] [PubMed] [Google Scholar]
- 7. Chemnitz JM, Parry RV, Nichols KE, June CH, Riley JL. SHP‐1 and SHP‐2 associate with immunoreceptor tyrosine‐based switch motif of programmed death 1 upon primary human T cell stimulation, but only receptor ligation prevents T cell activation. J Immunol 2004; 173:945–54. [DOI] [PubMed] [Google Scholar]
- 8. Ahmadzadeh M, Johnson LA, Heemskerk B, Wunderlich JR, Dudley ME, White DE, Rosenberg SA. Tumor antigen‐specific CD8 T cells infiltrating the tumor express high levels of PD‐1 and are functionally impaired. Blood 2009; 114:1537–44. [DOI] [PMC free article] [PubMed] [Google Scholar]
- 9. Pardoll DM. The blockade of immune checkpoints in cancer immunotherapy. Nat Rev Cancer 2012; 12:252–64. [DOI] [PMC free article] [PubMed] [Google Scholar]
- 10. Kamphorst AO, Ahmed R. Manipulating the PD‐1 pathway to improve immunity. Curr Opin Immunol 2013; 25:381–8. [DOI] [PMC free article] [PubMed] [Google Scholar]
- 11. Postow MA, Callahan MK, Wolchok JD. Immune checkpoint blockade in cancer therapy. J Clin Oncol 2015; 33:1974–82. [DOI] [PMC free article] [PubMed] [Google Scholar]
- 12. Bardhan K, Anagnostou T, Boussiotis VA. The PD1:PD‐L1/2 pathway from discovery to clinical implementation. Front Immunol 2016; 7:550. [DOI] [PMC free article] [PubMed] [Google Scholar]
- 13. Xia Y, Jeffrey Medeiros L, Young KH. Signaling pathway and dysregulation of PD1 and its ligands in lymphoid malignancies. Biochim Biophys Acta 2016; 1865:58–71. [DOI] [PMC free article] [PubMed] [Google Scholar]
- 14. Ansell SM. Where do programmed death‐1 inhibitors fit in the management of malignant lymphoma? J Oncol Pract 2016; 12:101–6. [DOI] [PubMed] [Google Scholar]
- 15. Redeker A, Arens R. Improving adoptive T cell therapy: the particular role of T cell costimulation, cytokines, and post‐transfer vaccination. Front Immunol 2016; 7:345. [DOI] [PMC free article] [PubMed] [Google Scholar]
- 16. Hornbach AA, Holzinger A, Abken H. The weal and woe of costimulation in the adoptive therapy of cancer with chimeric antigen receptor (CAR)‐redirected T cells. Curr Mol Med 2013; 13:1079–88. [DOI] [PubMed] [Google Scholar]
- 17. Savoldo B, Ramos CA, Liu E, Mims MP, Keating MJ, Carrum G et al CD28 costimulation improves expansion and persistence of chimeric antigen receptor‐modified T cells in lymphoma patients. J Clin Invest 2011; 121:1822–6. [DOI] [PMC free article] [PubMed] [Google Scholar]
- 18. Kowolik CM, Topp MS, Gonzalez S, Pfeiffer T, Olivares S, Gonzalez N et al CD28 costimulation provided through a CD19 specific chimeric antigen receptor enhances in vivo persistence and antitumor efficacy of adoptively transferred T cells. Cancer Res 2006; 66:10995–1004. [DOI] [PubMed] [Google Scholar]
- 19. Sadelain M, Brentjens R, Riviere I. The basic principles of chimeric antigen receptor design. Cancer Discov 2013; 3:388–98. [DOI] [PMC free article] [PubMed] [Google Scholar]
- 20. Benitez AC, Dai Z, Mann HH, Reeves RS, Margineantu DH, Gooley TA et al Expression, signaling proficiency, and stimulatory function of the NKG2D lymphocyte receptor in human cancer cells. Proc Natl Acad Sci USA 2011; 108:4081–6. [DOI] [PMC free article] [PubMed] [Google Scholar]
- 21. Kim EH, Sullivan JA, Plisch EH, Tejera MM, Jatzek A, Choi KY et al Signal integration by Akt regulates CD8 T cell effector and memory differentiation. J Immunol 2012; 188:4305–14. [DOI] [PMC free article] [PubMed] [Google Scholar]
- 22. Colombetti S, Basso V, Mueller DL, Mondino A. Prolonged TCR/CD28 engagement drives IL‐2‐ independent T cell clonal expansion through signaling mediated by the mammalian target of rapamycin. J Immunol 2006; 176:2730–8. [DOI] [PubMed] [Google Scholar]
- 23. Upshaw JL, Leibson PJ. NKG2D‐mediated activation of cytotoxic lymphocytes: unique signaling pathways and distinct functional outcomes. Semin Immunol 2006; 18:167–75. [DOI] [PubMed] [Google Scholar]
- 24. Maasho K, Opoku‐Anane J, Marusina AI, Coligan JE, Borrego F. NKG2D is a costimulatory receptor for human naive CD8+ T cells. J Immunol 2005; 174:4480–4. [DOI] [PubMed] [Google Scholar]
- 25. Markiewicz MA, Carayannopoulos LN, Naidenko OV, Matsui K, Burack WR, Wise EL et al Costimulation through NKG2D enhances murine CD8+ CTL function: similarities and differences between NKG2D and CD28 costimulation. J Immunol 2005; 175:2825–33. [DOI] [PubMed] [Google Scholar]
- 26. Rajasekaran K, Xiong V, Fong L, Gorski J, Malarkannan S. Functional dichotomy between NKG2D and CD28‐mediated co‐stimulation in human CD8+ T cells. PLoS ONE 2010; 5:e12635. [DOI] [PMC free article] [PubMed] [Google Scholar]
- 27. Barber A, Sentman CL. NKG2D receptor regulates human effector T‐cell cytokine production. Blood 2011; 117:6571–81. [DOI] [PMC free article] [PubMed] [Google Scholar]
- 28. Whitman E, Barber A. NKG2D receptor activation of NF‐κB enhances inflammatory cytokine production in murine effector CD8+ T cells. Mol Immunol 2015; 63:268–78. [DOI] [PubMed] [Google Scholar]
- 29. McQueen B, Trace K, Whitman E, Bedsworth T, Barber A. NKG2D and CD28 receptors differentially activate mTOR to alter murine effector CD8+ T cell differentiation. Immunology 2016; 147:305–20. [DOI] [PMC free article] [PubMed] [Google Scholar]
- 30. Barber A, Zhang T, Sentman CL. Immunotherapy with chimeric NKG2D receptors leads to long‐term tumor‐free survival and development of host antitumor immunity in murine ovarian cancer. J Immunol 2008; 180:72–8. [DOI] [PubMed] [Google Scholar]
- 31. Zhang T, Barber A, Sentman CL. Chimeric NKG2D modified T cells inhibit systemic T‐cell lymphoma growth in a manner involving multiple cytokines and cytotoxic pathways. Cancer Res 2007; 67:11029–36. [DOI] [PubMed] [Google Scholar]
- 32. Barber A, Sentman CL. Chimeric NKG2D T cells require both T cell‐ and host‐derived cytokine secretion and perforin expression to increase tumor antigen presentation and systemic immunity. J Immunol 2009; 183:2365–72. [DOI] [PMC free article] [PubMed] [Google Scholar]
- 33. Lim WA, June CH. The principles of engineering immune cells to treat cancer. Cell 2017; 168:724–40. [DOI] [PMC free article] [PubMed] [Google Scholar]
- 34. Ito T, Ueno T, Clarkson MR, Yuan X, Jurewicz MM, Yagita H et al Analysis of the role of negative T cell costimulatory pathways in CD4 and CD8 T cell‐mediated alloimmune responses in vivo . J Immunol 2005; 174:6648–56. [DOI] [PubMed] [Google Scholar]
- 35. Blank C, Mackensen A. Contribution of the PD‐L1/PD‐1 pathway to T‐cell exhaustion: an update on implications for chronic infections and tumor evasion. Cancer Immunol Immunother 2007; 56:739–45. [DOI] [PMC free article] [PubMed] [Google Scholar]
- 36. Morales‐Kastresana A, Labiano S, Quetglas JI, Melero I. Better performance of CARs deprived of the PD‐1 brake. Clin Cancer Res 2013; 19:5546–8. [DOI] [PubMed] [Google Scholar]
- 37. Prosser ME, Brown CE, Shami AF, Forman SJ, Jensen MC. Tumor PD‐L1 co‐stimulates primary human CD8+ cytotoxic T cells modified to express a PD1:CD28 chimeric receptor. Mol Immunol 2012; 51:263–72. [DOI] [PubMed] [Google Scholar]
- 38. Ankri C, Shamalov K, Horovitz‐Fried M, Mauer S, Cohen CJ. Human T cells engineered to express a programmed death 1/28 costimulatory retargeting molecule display enhanced antitumor activity. J Immunol 2013; 191:4121–9. [DOI] [PubMed] [Google Scholar]
- 39. Liu X, Ranganathan R, Jiang S, Fang C, Sun J, Kim S et al A chimeric switch‐receptor targeting PD1 augments the efficacy of second‐generation CAR T cells in advanced solid tumors. Cancer Res 2016; 76:1578–90. [DOI] [PMC free article] [PubMed] [Google Scholar]
- 40. Kobold S, Grassmann S, Chaloupka M, Lampert C, Wenk S, Kraus F et al Impact of a new fusion receptor on PD‐1‐mediated immunosuppression in adoptive T cell therapy. J Natl Cancer Inst 2015; 107:djv146. [DOI] [PMC free article] [PubMed] [Google Scholar]
- 41. Hombach AA, Abken H. Of chimeric antigen receptors and antibodies: OX40 and 41BB costimulation sharpen up T cell‐based immunotherapy of cancer. Immunotherapy 2013; 5:677–81. [DOI] [PubMed] [Google Scholar]
- 42. Kawalekar OU, O'Connor RS, Fraietta JA, Guo L, McGettigan SE, Posey AD et al Distinct signaling of coreceptors regulates specific metabolism pathways and impacts memory development in CAR T cells. Immunity 2016; 44:380–90. [DOI] [PubMed] [Google Scholar]
- 43. Yang K, Chi H. mTOR and metabolic pathways in T cell quiescence and functional activation. Semin Immunol 2012; 24:421–8. [DOI] [PMC free article] [PubMed] [Google Scholar]
- 44. Lee DW, Gardner R, Porter DL, Louis CU, Ahmed N, Jensen M et al Current concepts in the diagnosis and management of cytokine release syndrome. Blood 2014; 124:188–95. [DOI] [PMC free article] [PubMed] [Google Scholar]
- 45. Bonifant CL, Jackson HJ, Brentjens R, Curran KJ. Toxicity and management in CAR T‐cell therapy. Mol Ther Oncolytics 2016; 3:16011. [DOI] [PMC free article] [PubMed] [Google Scholar]
- 46. Davila ML, Riviere I, Wang X, Bartido S, Park J, Curran K et al Efficacy and toxicity management of 19‐28z CAR T cell therapy in B cell acute lymphoblastic leukemia. Sci Transl Med 2014; 6:224ra25. [DOI] [PMC free article] [PubMed] [Google Scholar]
- 47. Lee DW, Kochenderfer JN, Stetler‐Stevenson M, Cui YK, Delbrook C, Feldman SA et al T cells expressing CD19 chimeric antigen receptors for acute lymphoblastic leukaemia in children and young adults: a phase 1 dose‐escalation trial. Lancet 2015; 385:517–28. [DOI] [PMC free article] [PubMed] [Google Scholar]
- 48. Hombach AA, Heiders J, Foppe M, Chmielewski M, Abkem H. Ox40 costimulation by a chimeric antigen receptor abrogates CD28 and IL‐2 induced IL‐10 secretion by redirected CD4 T cells. Oncoimmunology 2012; 1:458–66. [DOI] [PMC free article] [PubMed] [Google Scholar]
- 49. Cheadle EJ, Sheard V, Rothwell DG, Bridgeman JS, Ashton G, Hanson V et al Differential role of Th1 and Th2 cytokines in autotoxicity driven by CD19‐specific second‐generation chimeric antigen receptor T cells in a mouse model. J Immunol 2014; 192:3654–65. [DOI] [PubMed] [Google Scholar]