Summary
Nerve growth factor (NGF) functions to modulate osteoarthritis (OA)‐associated pain. Although recent studies suggest that tumour necrosis factor (TNF)‐α and interleukin (IL)‐1β mediate NGF activity in human synovial fibroblasts, the regulation of NGF expression in human synovial macrophages remains unclear. Here, we examined the role of macrophages in the production and regulation of synovial (SYN) NGF in osteoarthritic knee joints by examining the mRNA expression of TNF‐α and IL‐1β in freshly isolated CD14‐positive (macrophage‐rich fraction) and CD14‐negative cells (fibroblast‐rich fraction) in synovial tissue from OA patients by quantitative polymerase chain reaction. We also examined the effects of IL‐1β and TNF‐α on NGF mRNA expression in cultured CD14‐positive (macrophage‐rich fraction) and CD14‐negative cells (fibroblast‐rich fraction). In addition, to examine the contribution of macrophages to NGF, TNF‐α and IL‐1β expression, we injected clodronate liposomes systemically into STR/Ort mice, an osteoarthritis animal model, to deplete macrophages. TNF‐α and IL‐1β mRNA levels in CD14‐positive cells from the SYN of OA patients was significantly higher than that in CD14‐negative cells, while NGF expression did not differ markedly between the two cell fractions. In addition, treatment of human cultured CD14‐positive and ‐negative cells with IL‐1β and TNF‐α enhanced NGF mRNA and protein levels. Expression of NGF, IL‐1β and TNF‐α was also reduced significantly in STR/Ort mice upon macrophage depletion. These findings suggest that IL‐1β and TNF‐α regulate NGF expression and production in synovial macrophages and fibroblasts in osteoarthritic joints.
Keywords: nerve growth factor, macrophage, osteoarthritis, synovium
Introduction
The disease process of osteoarthritis (OA), which involves the breakdown of cartilage, synovial fibrosis and formation of osteophytes, leads to chronic joint pain. Although non‐steroidal anti‐inflammatory drugs and corticosteroids are prescribed frequently for the treatment of joint pain 1, 2, these analgesic drugs have variable efficacy and adverse effects 3, 4. In addition, only a limited number of drugs have been shown to modify the disease process of OA 5, 6. Therefore, it is important to establish the mechanisms underlying OA pain to aid in drug development and OA treatment.
Nerve growth factor (NGF) functions to mediate and modulate pain 7. In particular, NGF modulates OA pain: treatment with the monoclonal antibody tanezumab neutralizes NGF and reduces OA pain 8, 9, 10. Evidence suggests that NGF activity is mediated by tumour necrosis factor (TNF)‐α and interleukin (IL)‐1β, which induce NGF production by cultured synovial human OA fibroblasts 11. TNF‐α also regulates NGF expression in macrophages present in the synovial lining layer of OA mice 12. However, it is unclear whether this holds true for humans.
OA progression and joint pain are associated with the expression of several proinflammatory cytokines, including IL‐6, IL‐1β and TNF‐α 13, 14, 15, 16, 17. We have reported previously that TNF‐α and IL‐1β mRNA levels are elevated in the synovial tissue (SYN) of OA model mice, particularly within synovial macrophages 16, 17. These observations suggest that inflammatory cytokines secreted by macrophages contribute to the production and regulation of NGF in SYN.
Here, we investigated whether TNF‐α and IL‐1β stimulate NGF production in human synovial macrophages from OA patients. In addition, we examined whether macrophages contribute to the regulation of NGF expression in SYN of an OA mouse model.
Materials and methods
Patients
Twenty‐five participants (four men, 21 women) aged 60–85 years [mean ± standard deviation (s.d.), 71·9 ± 7·2 years] with radiographic knee OA (Kellgren/Lawrence grades 2–4) and a mean ± s.d. visual analogue scale (VAS) pain score of 6·0 ± 2·3 cm underwent total knee arthroplasty (TKA) at Kitasato University Hospital. The 25 patients were divided randomly into three groups: group A (n = 5; age: mean ± s.d., 70·6 ± 8·9 years; Kellgren/Lawrence grade: KL3 = 1/5, KL4 = 4/5; VAS: 5·8 ± 3·6 cm), group B (n = 10; age: mean ± s.d., 73·6 ± 5·8 years; Kellgren/Lawrence grade: KL3 = 4/10, KL4 = 6/10, VAS: 6·5 ± 2·2 cm) and group C (n = 10; age: mean ± s.d., 70·9 ± 8·0 years; Kellgren/Lawrence grade: KL2 = 1/10, KL3 = 6/10 KL4 = 3/10; VAS: 5·8 ± 1·8 cm). SYN samples were harvested from each operated knee during TKA. We obtained informed consent from each participant on the day before surgery. The study protocol was approved by the Ethics Review Board of Kitasato University (reference number: KMEO B13–113).
Isolation of CD14‐positive cells from SYN
Mononuclear cells were extracted by digesting the surgically collected SYN samples with 20 ml of 0·1% Clostridium histoluticum‐derived type I collagenase (Wako Pure Chemicals, Osaka, Japan) for 2 h at 37°C. The cells were incubated in 0·5 ml cold flow cytometry staining buffer (eBioscience, San Jose, CA, USA) containing R‐phycoerythrin (PE)‐conjugated or biotin‐conjugated anti‐CD14 mouse monoclonal antibody (Biolegend) for 30 min at 4°C, washed twice in phosphate‐buffered saline (PBS), reacted with anti‐PE magnetic beads (BD Biosciences, Tokyo, Japan) or streptavidin‐conjugated magnetic beads (BD Biosciences) and placed on a cell separation system (IMag; BD Biosciences) for 30 min on ice. After removing the tube from the magnetic support, 5 ml of warmed (37°C) α‐minimum essential culture medium (MEM) was added and the tube was centrifuged at 300 g for 5 minutes to extract CD14‐positive and ‐negative cells. One proportion of CD14‐negative and ‐positive cells from each of the five patients in group A was analysed directly by flow cytometry. The remaining cells from group A were cultured in α‐MEM containing 10% fetal bovine serum (FBS) in six‐well cell culture dishes (PrimariaTM; Corning, New York, NY, USA) for 7 days and analysed by flow cytometry. CD14‐negative and ‐positive cells from each of the 10 patients in group B were analysed separately by quantitative polymerase chain reaction (qPCR), while those from the 10 patients in group C were cultured separately in α‐MEM supplemented with 10% FBS in six‐well cell culture dishes for 7 days and used to determine NGF mRNA and protein levels following TNF‐α and IL‐1β stimulation.
Flow cytometric analysis
To determine the cell population of CD14‐negative and ‐positive cells under non‐culture and culture conditions, flow cytometric analysis was performed. While non‐cultured fractions were directly used, cultured fractions were detached from the culture dish by treatment with 0·25% trypsin/ethylenediamine tetraacetic acid (EDTA) solution before flow cytometric analysis. Non‐cultured and cultured fractions from each patient sample were reacted with fluorescein isothiocyanate (FITC)‐conjugated anti human CD45 (Biolegend), PE‐cyanin 7 (Cy7)‐conjugated anti‐human CD19 (Biolegend), allophycocyanin (APC)‐conjugated anti‐human CD90 (Biolegend), APC/Cy7‐conjugated anti‐human CD31 (Biolegend) and Pacific Blue‐conjugated anti‐human CD3 (Biolegend) antibody. Each fraction was analysed by flow cytometry (FACSVerseTM; BD Biosciences, San Jose, CA, USA). Isotype controls were used to represent the positive gate.
qPCR
TRIzol reagent (Invitrogen, Carlsbad, CA, USA) was used for the extraction of total RNA from SYN‐derived CD14‐positive and ‐negative cells. qPCR was conducted using a PCR detection system (CFX‐96; Bio‐Rad, Hercules, CA, USA) with the following cycling parameters: initial denaturation at 95°C for 60 s, followed by 40 cycles of 95°C for 5 s and 60°C for 30 s. Primer sequences are listed in Table 1. Target mRNA expression levels were normalized to that of glyceraldehyde‐3‐phosphate dehydrogenase (GAPDH).
Table 1.
Sequences of the primers used in this study
| Primer | Sequence (5′–3′) | Product size (bp) |
|---|---|---|
| Human | ||
| CD14‐F | TCCCTCAATCTGTCGTTCGC | 150 |
| CD14‐R | ATTCCCGTCCAGTGTCAGGT | |
| CD90‐F | GACCCGTGAGACAAAGAAGC | 138 |
| CD90‐R | CCCTCGTCCTTGCTAGTGAA | |
| TNF‐α‐F | CTTCTGCCTGCTGCACTTTG | 118 |
| TNF‐α‐R | GTCACTCGGGGTTCGAGAAG | |
| IL‐1β‐F | GTACCTGTCCTGCGTGTTGA | 153 |
| IL‐1β‐R | GGGAACTGGGCAGACTCAAA | |
| NGF‐F | CCCATCCCATCTTCCACAGG | 74 |
| NGF‐R | GGTGGTCTTATCCCCAACCC | |
| GAPDH‐F | TGTTGCCATCAATGACCCCTT | 202 |
| GAPDH‐R | CTCCACGACGTACTCAGCG | |
| Mouse | ||
| TNF‐α‐F | CTGAACTTCGGGGTGATCGG | 122 |
| TNF‐α‐R | GGCTTGTCACTCGAATTTTGAGA | |
| IL‐1β‐F | GCAACTGTTCCTGAACTCAACT | 89 |
| IL‐1β‐R | ATCTTTTGGGGTCCGTCAACT | |
| NGF‐F | ATGGTGGAGTTTTGGCCTGT | 192 |
| NGF‐R | GTACGCCGATCAAAAACGCA | |
| GAPDH‐F | AACTTTGGCATTGTGGAAGG | 223 |
| GAPDH‐R | ACACATTGGGGGTAGGAACA | |
TNF = tumour necrosis factor; IL = interleukin; NGF = nerve growth factor; GAPDH = glyceraldehyde‐3‐phosphate dehydrogenase; bp = base pairs.
Synovial cell culture
To determine the factors regulating NGF expression, CD14‐positive and ‐negative synovial cells harvested from the synovium of 10 OA patients (group C) were cultured in α‐MEM containing 10% FBS for 7 days. CD14‐positive and –negative fractions were stimulated with serum free α‐MEM with human recombinant TNF‐α (10 ng/ml; Biolegend) or IL‐1β (50 ng/ml; Biolegend) for 24 h before performing total RNA extraction (described above). The concentrations of human recombinant TNF‐α and IL‐1β used were determined based on in‐vitro studies using human cells 18, 19. Our preliminary study showed that TNF‐α stimulated NGF mRNA expression. Therefore, in pilot experiments conducted prior to the present study, we confirmed that TNF‐α is responsible for the up‐regulation of NGF by showing that a TNF‐α neutralizing antibody indeed neutralizes TNF‐α‐induced NGF up‐regulation in cultured CD14‐negative and ‐positive fractions from eight patients (Supporting information, Fig. S1). NGF mRNA expression was evaluated by qPCR using the specific primers and cycling conditions described in the qPCR section. To confirm the cell population in cultured CD14‐positive and ‐negative fractions, CD14 and CD90 expression was also determined using qPCR. The concentration of NGF protein in the cell supernatant was analysed using a solid‐phase sandwich enzyme‐linked immunoadsorbent assay with a human NGF protein detection kit (R&D Systems, Inc., Minneapolis, MN, USA). After collection of supernatant, the cells were trypsinized with a 0·25% trypsin/EDTA solution and the number of cells in each well was determined using an automatic cell counter (Countess Cell Counter; Invitrogen). NGF proteins were normalized to the number of cells per well.
Macrophage depletion in osteoarthritic mice by administration of clodronate liposomes
STR/Ort mice are a well‐established spontaneous OA animal model. STR/Ort mice exhibit human OA characteristics, including osteophyte formation, subchondral sclerosis and cartilage fibrillation 20, 21. To investigate potential regulation of NGF by synovial macrophages in vivo, we examined whether macrophage depletion reduced NGF expression in STR/Ort mice. All experimental protocols involving animals were approved by the Animal Care Committee of Kitasato University School of Medicine. Specific pathogen‐free 9‐month‐old STR/Ort mice were housed in a semi‐barrier system under controlled conditions of 23 ± 2°C, 55 ± 10% humidity and a 12‐h light/dark cycle at our institute throughout the study. A total of 30 9‐month‐old male STR/Ort mice were divided into either the PBS injection group or clodronate liposome injection group (n = 15 each). OA development in 9‐month‐old male STR/Ort mice was confirmed using an X‐ray system (Softex‐CMB4; Softex Corporation, Kanagawa, Japan) with a 10‐s exposure time at 25 kV and 10 mA using X‐ray IX industrial film (Fuji Photo Film Co. Tokyo, Japan; Supporting information, Fig. S2). We have reported previously that systemic clodronate liposome injections reduce the number of synovial and splenic macrophages after 24 h 17. As local injection into the knee induces undesired effects, even with PBS injections (Supporting information, Fig. S3), STR/Ort mice were injected intraperitoneally with clodronate liposomes and euthanized 24 h later by an intramuscular injection of midazolam, butorphanol tartrate and medetomidine. Spleens were harvested and splenocytes were isolated for immunostaining with Brilliant Violet 421‐conjugated anti‐F4/80 antibody (Biolegend) and PE/Cy5‐conjugated anti‐CD11b antibody (Biolegend) to assess macrophage depletion by flow cytometric analysis. Isotype controls were used to determine a CD11b+ F4/80+ gate. TNF‐α, NGF, and IL‐1β mRNA levels were analysed by qPCR, as described above (n = 10, each). NGF protein levels were analysed by Western blotting, as described below (n = 5, each).
Western blotting
To investigate the effect of clodronate liposome injections on synovial NGF protein expression, SYN samples harvested from STR/Ort mice that did or did not receive clodronate liposome injections were homogenized in RIPA buffer (Thermo Scientific, Schaumburg, IL, USA) supplemented with a protease inhibitor cocktail (Sigma‐Aldrich, St Louis, MO, USA). The protein concentration within each sample was determined using a bicinchoninic acid (BCA) assay (Thermo Scientific). Protein extracts (10 μg/lane) were separated by sodium dodecyl sulphate‐polyacrylamide gel electrophoresis and transferred electrophoretically onto polyvinyl difluoride membranes, which were then blocked with polyvinylidene difluoride (PVDF) blocking reagent (Toyobo, Osaka, Japan) for 1 h. The blocked membranes were incubated overnight at 4°C with rabbit monoclonal primary antibodies against NGF (Abcam, Cambridge, UK) or rabbit monoclonal primary antibodies against beta‐actin (Sigma‐Aldrich). The membranes were washed with Tris‐buffered saline‐Tween 20 (TBST) and incubated with horseradish peroxidase (HRP)‐conjugated secondary antibodies (GE Healthcare, Rahway, NJ, USA). Immunoreactive proteins were visualized by chemiluminescence (Bio‐Rad, Tokyo, Japan) on X‐ray film.
Statistical analysis
The t‐test was used to determine differences between CD14‐positive and ‐negative cell fractions, and between clodronate liposome‐ and PBS‐administered STR/Ort mice. Bonferroni multiple comparisons test with one‐way analysis of variance (anova) was used to determine differences among the control and IL‐1β or TNF‐α treatment groups. All statistical analyses were performed using spss version 19.0 (IBM Corp., Chicago, IL, USA). P < 0·05 was considered statistically significant.
Results
NGF, IL‐1β and TNF‐α expression in CD14‐positive and ‐negative synovial cells from OA patients
The cell types in CD14‐positive and ‐negative fractions were identified using flow cytometric analysis. Flow cytometric analysis showed that the CD14‐positive fraction comprised mainly CD14+ cells [mean ± standard error (s.e.), 85·1 ± 1·1%] (Fig. 1a). In contrast, the CD14‐negative fraction contained mainly fibroblasts (CD45–CD90+, mean ± s.e., 55·5 ± 7·3%) as well as other cells, including endothelial cells (CD31+CD45–, 3·7 ± 1·1%), B cells (CD19+CD45+, 9·9 ± 4·5%), T cells (CD3+CD45+, 9·1 ± 2·4%) and some macrophages (CD14+CD45+, 3·2 ± 1·3%) (Fig. 1b–f). qPCR analysis also showed that CD14 mRNA levels in CD14‐positive cells from the synovium of OA patients were increased significantly compared to CD14‐negative cells (Fig. 2a). CD90 mRNA levels in CD14‐negative cells were significantly higher than that in CD14‐positive fractions (Fig. 2b). TNF‐α and IL‐1β mRNA levels in CD14‐positive cells from the synovium of OA patients were increased significantly compared to CD14‐negative cells (Fig. 2c,d). In contrast, there were no differences in NGF gene expression between the cell fractions (Fig. 2e).
Figure 1.
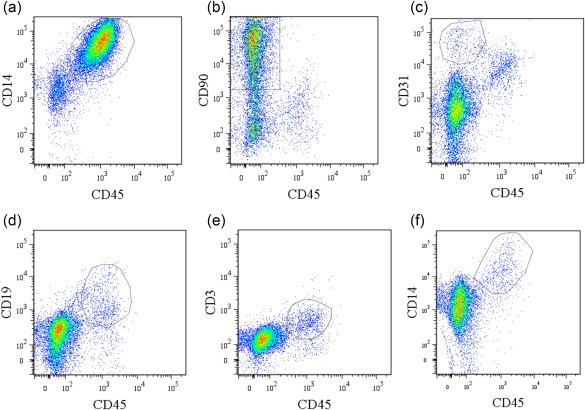
Flow cytometric analysis of CD14‐negative and ‐positive synovial cells obtained from osteoarthritis patients. (a) Dot‐plot analysis of CD45+CD14+ cells in CD14‐positive fractions. x‐axis, CD45; y‐axis, CD14. (b–f) Dot‐plot analysis of CD14‐negative fractions. x‐axis, CD45; y‐axis, CD90 (b), CD31 (c), CD19 (d), CD3 (e), CD14 (f). Data represent mean ± standard error (s.e.) (n = 5). [Colour figure can be viewed at wileyonlinelibrary.com]
Figure 2.
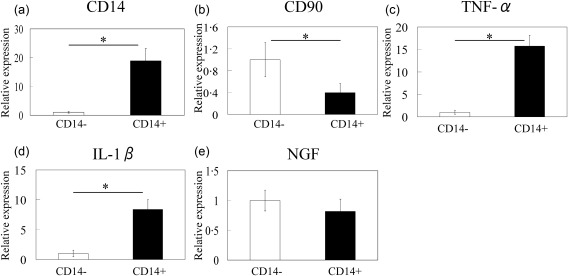
Quantitative polymerase chain reaction (PCR) analysis of CD14, CD90, tumour necrosis factor (TNF)‐α, interleukin (IL)‐1β and nerve growth factor (NGF) mRNA levels in CD14‐negative and ‐positive synovial cells obtained from osteoarthritis patients. (a) CD14, (b) CD90, (c) TNF‐α, (d) IL‐1β and (e) NGF. Data represent mean ± standard error (s.e.) (n = 10). *Statistical difference between CD14‐negative‐ and ‐positive cells.
Effect of IL‐1β and TNF‐α on NGF expression in cultured CD14‐positive and ‐negative synovial cells from OA patients
The cell types in cultured CD14‐positive and ‐negative fractions were determined by flow cytometric analysis. Flow cytometric analysis showed that the CD14‐positive fraction contained mainly CD14+CD45+ cells (mean ± s.e., 80·5 ± 2·1%) (Fig. 3a), as well as CD45–CD90+ cells (10·0 ± 1·1%) (Fig. 3b). In contrast, almost all cells in the cultured CD14‐negative fractions were CD45– (<99%) and comprised mainly CD45–CD90+ cells (92·9 ± 1·0%) (Fig. 3c,d). After cell culture, T, B and endothelial cells each comprised less than 0·5% of either fraction (data not shown). Consistent with flow cytometric analysis, qPCR analysis also showed that CD14 and CD90 mRNA levels in cultured CD14‐positive cells from the SYN of OA patients were increased significantly compared to cultured CD14‐negative cells (Fig. 4a,b). Therefore, cultured CD14‐negative and ‐positive fractions contained mainly fibroblasts and macrophages, respectively. Compared to untreated control cells, cultured synovial CD14‐positive and ‐negative cells stimulated with either IL‐1β or TNF‐α exhibited significant increases in NGF mRNA and protein levels (Figs 4c and 5). NGF mRNA expression in CD14‐negative cells was also significantly higher than that in CD14‐positive cells with or without TNF‐α and IL‐1β treatment (Fig. 4c). Further, the NGF protein concentration in cell culture supernatants of CD14‐negative cells treated with TNF‐α and IL‐1β was significantly higher than that of TNF‐α‐ and IL‐1β‐treated CD14‐positive cells (Fig. 5).
Figure 3.
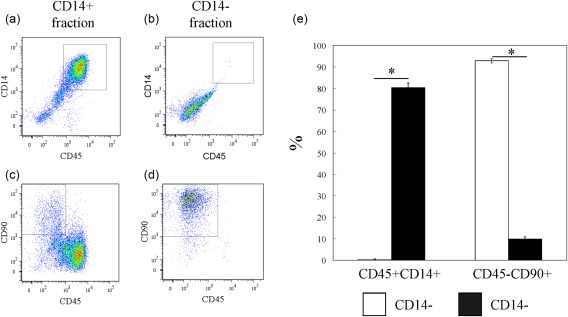
Flow cytometric analysis of CD14‐negative and ‐positive fractions in culture. (a and b) Dot‐plot analysis of CD45+CD14+ cells in the cultured CD14‐positive fraction (a) and CD14‐negative fraction (b). x‐axis, CD45; y‐axis, CD14. (c,d) CD45–CD90+ cells in the cultured CD14‐positive fraction (c) and CD14‐negative fraction (d). x‐axis, CD45; y‐axis, CD90. (e) Percentage of CD45+CD14+ and CD45–CD90+ cells in cultured CD14‐negative and ‐positive fractions. Data represent mean ± standard error (s.e.) (n = 5). [Colour figure can be viewed at wileyonlinelibrary.com]
Figure 4.
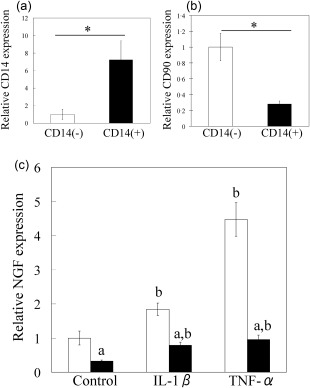
Effect of tumour necrosis factor (TNF)‐α and interleukin (IL)‐1β on nerve growth factor (NGF) mRNA expression in synovial CD14‐negative and ‐positive fractions in culture. (a,b) Quantitative polymerase chain reaction (qPCR) analysis of CD14 (a) and CD90 (b) mRNA expression in cultured CD14‐negative and ‐positive fractions. (c) qPCR analysis of NGF mRNA expression in cultured synovial cells obtained from the knees of osteoarthritis (OA) patients following the treatment of CD14‐negative (white bars) and ‐positive cells (black bars) with α‐minimum essential culture medium (α‐MEM), 50 ng/ml human recombinant IL‐1β or 10 ng/ml human recombinant TNF‐α. Data represent mean ± standard error (s.e.) (n = 10). aStatistical difference between CD14‐negative and ‐positive cells under the same conditions; bstatistical difference between cytokine‐stimulated and non‐stimulated cells in each fraction.
Figure 5.
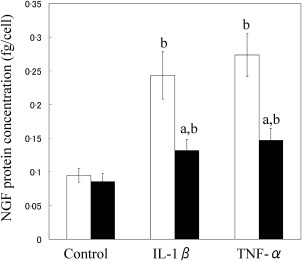
Nerve growth factor (NGF) protein levels in the culture supernatant of synovial CD14‐negative and ‐positive fractions. NGF concentrations in the culture supernatants of CD14‐negative (white bars) and ‐positive cells (black bars) treated with or without human recombinant tumour necrosis factor (TNF)‐α and interleukin (IL)‐1β were examined by enzyme‐linked immunosorbent assay (ELISA). NGF concentration was normalized to the number of cells in each well. Data represent mean ± standard error (s.e.) (n = 10). aStatistical difference between CD14‐negative (white bars) and ‐positive cells (black bars) under the same conditions; bstatistical difference between cytokine‐stimulated and non‐stimulated cells in each fraction.
Effect of clodronate liposomes on NGF, IL‐1β and TNF‐α mRNA expression in OA mice
Injections of clodronate liposomes were used to deplete macrophages in STR/Ort. The spleens of STR/Ort mice injected with liposomes contained significantly fewer CD11b‐ and F4/80‐positive cells compared to mice injected with PBS (Fig. 6). In addition, macrophage depletion reduced NGF, IL‐1β and TNF‐α mRNA expression significantly in the SYN of STR/Ort mice (Fig. 7a–c). NGF protein levels were reduced in the SYN of STR/Ort mice following clodronate liposome injection (Fig. 7d).
Figure 6.
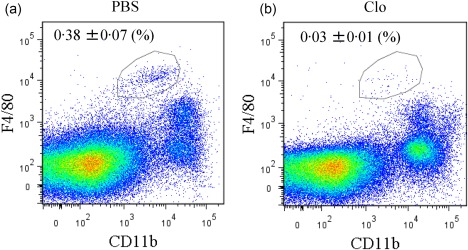
Flow cytometric analysis of spleen‐derived CD11b+ F4/80+ macrophages following clodronate liposome treatment. Dot‐plot analysis of F4/80+ (x‐axis) and CD11b+ (y‐axis) cells from the spleens of STR/Ort mice injected with either phosphate‐buffered saline (PBS) (a) or clodronate liposomes (b). [Colour figure can be viewed at wileyonlinelibrary.com]
Figure 7.
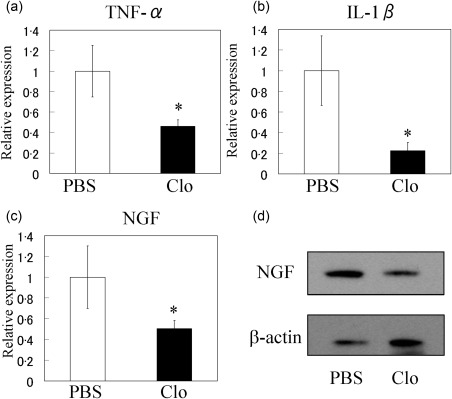
Effect of macrophage depletion on synovial tumour necrosis factor (TNF)‐α, interleukin (IL)‐1β and nerve growth factor (NGF) expression in STR/Ort mice. Quantitative polymerase chain reaction (qPCR) analysis of TNF‐α (a), IL‐1β (b) and NGF (c) in the synovium of STR/Ort mice injected with phosphate‐buffered saline (PBS) or clodronate‐laden liposomes (Clo). *Significant difference between PBS and Clo groups. Data represent mean ± standard error (s.e.) (n = 10). (d) Western blot analysis of NGF in the synovium of STR/Ort mice injected with PBS or Clo.
Discussion
We showed that CD14‐negative and ‐positive cells from the SYN of OA patients' knees expressed NGF. CD14‐positive synovial cells also expressed high levels of IL‐1β and TNF‐α. In addition, treatment of CD14‐positive and ‐negative synovial cells with TNF‐α and IL‐1β stimulated the expression of NGF and increased the corresponding protein levels. We also demonstrated that the macrophage depletion by treatment with clodronate liposomes in an OA mouse model reduced the gene expression of NGF, IL‐1β and TNF‐α in SYN. These results suggest that macrophage‐derived TNF‐α and IL‐1β regulate NGF expression in synovial macrophages, which may underlie the development of OA pain.
NGF levels are elevated frequently in inflamed knee joints and have been linked to OA disease progression 15, 22, 23. This is evidenced further by findings that NGF production is increased in synovial fibroblasts in the knees of OA patients 11. Immunohistochemical analysis of human SYN showed that NGF was expressed by a specific population of macrophages 22. Further, we have reported previously that synovial macrophages isolated from STR/Ort mice expressed NGF and that this expression was regulated by IL‐1β and TNF‐α 12. Our present findings, showing that NGF is expressed in synovial macrophages isolated from the knees of OA patients, and that treatment of these cells with TNF‐α and IL‐1β stimulates NGF mRNA expression and protein production, are consistent with previous findings. Our results suggest that synovial macrophages may constitute one of the main sources of NGF in the SYN of OA patients.
NGF protein concentrations in CD14– fractions increased after treatment with TNF‐α and IL‐1β, and were higher than in the CD14+ population after TNF‐α and IL‐1β treatment. A previous immunohistochemical study showed that NGF expression in SYN was localized predominantly to fibroblasts, while macrophages in the lining and sublining also expressed NGF 22. NGF producing ability may be limited in vitro, as systemic depletion of macrophages in vivo seems to reduce NGF expression in joints.
Synovial macrophages produce inflammatory cytokines in response to synovial hyperplasia and under OA conditions 12, 16, 17, 23. Previous studies have also demonstrated an increased number of activated macrophages and IL‐1β concentrations in the SYN of a synovial dysplasia mouse model 23. In addition, STR/Ort mice have higher IL‐1β, TNF‐α and NGF gene expression in their synovium than C57BL/6J mice 12. Further, the expression of TNF‐α and IL‐1β is significantly higher in synovial macrophages compared to fibroblasts 16, 17. Consistent with these findings, we also observed higher expression of TNF‐α and IL‐1β in macrophages isolated from SYN of knee OA patients. Further, administration of clodronate liposomes to deplete macrophages in STR/Ort mice reduced TNF‐α and IL‐1β expression in SYN, and reduced synovial NGF expression significantly compared to PBS‐treated control mice, suggesting that synovial macrophages may regulate NGF expression in SYN through the actions of TNF‐α and IL‐1β.
Several studies have demonstrated that NGF plays a role in both acute and chronic pain, and also functions in peripheral sensory transduction pathways 24, 25, 26, 27, 28. For example, an intra‐articular injection of NGF reduced hindpaw mechanical withdrawal thresholds in a rat OA model 28, and treatment of human OA knees with the anti‐NGF monoclonal antibody tanezumab was an effective analgesic remedy compared to placebo 8. Previous and present findings suggest that NGF regulation by synovial macrophages may be a critical component of OA pain development and pathology. Therefore, a clearer understanding of the underlying mechanisms may aid in the development of effective strategies for managing OA pathology in the future.
This study has several limitations. First, although the present data provide evidence that TNF‐α and IL‐1β regulate synovial NGF levels, we could not demonstrate a direct causative link between synovial NGF levels and OA pain due to our sample size and lack of a non‐OA control. Secondly, the mechanisms underlying the different NGF production levels in macrophages and fibroblasts remain to be determined. Thirdly, it remains to be determined whether reduction of NGF, IL‐1β and TNF‐α mRNA levels in ST was caused by the depletion of synovial macrophages rather than just the effect of systemic depletion of macrophages. Finally, we lack data in non‐OA model mice, and it therefore remains to be determined whether our findings reflect OA pathology specific to murine models.
In conclusion, the present results support the hypothesis that TNF‐α and IL‐1β regulate NGF production in synovial macrophages and fibroblasts in the knees of OA patients. As macrophage depletion leads to reduced NGF in OA joints, macrophages may represent potential future targets for therapies that modulate OA pathology.
Disclosure
The authors declare that there are no disclosures regarding the publication of this paper.
Author contributions
All authors read the manuscript and provided intellectual content. S. T. and K. U. designed the experiments; S. T., K. U., G. I., D. I. and K. I. collected data; S. T., K. U., A. J., M. M. (Miyagi), M. M. (Mukai), W. S., K. I, T. M., M. S. and M. T. performed data analysis and interpretation; and S. T. and K. U. wrote the paper.
Supporting information
Additional Supporting information may be found in the online version of this article at the publisher's web‐site:
Fig. S1. Effect of tumour necrosis factor (TNF)‐α neutralization on TNF‐α‐induced nerve growth factor (NGF) expression. CD14‐positive and ‐negative synovial cells harvested from the synovium of eight osteoarthritis (OA) patients were cultured and analysed for NGF by real‐time polymerase chain reaction. CD14‐positive and ‐negative synovial cells were stimulated with control [α‐minimum essential culture medium (α‐MEM)], 10 ng/ml TNF‐α or 10 ng/ml TNF‐α and 1 μg/ml TNF‐α neutralizing antibody (TNF‐α + Neu; Biolegend, San Diego, CA, USA) for 24 h prior to the extraction and analysis of total RNA. Differences among the control and TNF‐α or TNF‐α + Neu groups were determined using the Bonferroni multiple comparisons test with one‐way analysis of variance (anova). P < 0·05 was considered statistically significant. All data are presented as the mean ± standard error (SE) (n = 8). aStatistical difference between CD14‐negative (white bars) and ‐positive cells (black bars) under the same conditions; bstatistical difference between the control and TNF‐α group in each fraction; cstatistical difference between the TNF‐α and TNF‐α + Neu group in each fraction. Neutralizing antibody significantly reduced NGF mRNA expression in CD14‐positive and ‐negative synovial cells compared to TNF‐α‐stimulated cells.
Fig. S2. X‐ray images of STR/Ort mice. Knees of 3‐, 6‐ and 9‐month‐old male STR/Ort mice were analysed using an X‐ray system with a 10‐s exposure time at 25 kV and 10 mA using X‐ray IX industrial film. Osteoarthritis (OA) features, including joint space narrowing, subchondral bone sclerosis and osteophyte formation, were observed in 9‐month‐old mice (arrows).
Fig. S3. Effect of intra‐articular injection of phosophate‐buffered saline in STR/Ort. A total of 10 9‐month‐old male STR/Ort mice were divided into either the 10 μl intraperitoneal PBS injection group (IP) or 10 μl intra‐articular PBS injection group (IA) (n = 5 each). After 24 h, tumour necrosis factor (TNF)‐α, nerve growth factor (NGF) and interleukin (IL)‐1β mRNA levels in synovial tissues were analysed by quantitative polymerase chain reaction (qPCR). Differences between the IP and IA groups were determined using the t‐test, with P < 0·05 considered statistically significant. TNF‐α, NGF and IL‐1β mRNA levels in the IA group were significantly higher than those in the IP group. *Significant difference between IP and IA groups. Data represent mean ± standard error (s.e.) (n = 5).
Acknowledgements
This study was supported in part by research grants from the Parents' Association of Kitasato University School of Medicine and a Kitasato University Research Grant for Young Researchers.
References
- 1. Dillon CF, Rasch EK, Gu Q, Hirsch R. Prevalence of knee osteoarthritis in the United States: arthritis data from the Third National Health and Nutrition Examination Survey 1991–94. J Rheumatol 2006; 33:2271–9. [PubMed] [Google Scholar]
- 2. Zhang W, Moskowitz RW, Nuki G et al OARSI recommendations for the management of hip and knee osteoarthritis, Part II: OARSI evidence‐based, expert consensus guidelines. Osteoarthritis Cartilage 2008; 16:137–62. [DOI] [PubMed] [Google Scholar]
- 3. Johnsen SP, Larsson H, Tarone RE et al Risk of hospitalization for myocardial infarction among users of rofecoxib, celecoxib, and other NSAIDs: a population‐based case–control study. Arch Intern Med 2005; 165:978–84. [DOI] [PubMed] [Google Scholar]
- 4. Whelton A. Renal and related cardiovascular effects of conventional and COX‐2‐specific NSAIDs and non‐NSAID analgesics. Am J Ther 2000; 7:63–74. [DOI] [PubMed] [Google Scholar]
- 5. Bjordal JM, Ljunggren AE, Klovning A, Slordal L. Non‐steroidal anti‐inflammatory drugs, including cyclo‐oxygenase‐2 inhibitors, in osteoarthritic knee pain: meta‐analysis of randomised placebo controlled trials. BMJ 2004; 329:1317. [DOI] [PMC free article] [PubMed] [Google Scholar]
- 6. Bjordal JM, Klovning A, Ljunggren AE, Slordal L. Short‐term efficacy of pharmacotherapeutic interventions in osteoarthritic knee pain: a meta‐analysis of randomised placebo‐controlled trials. Eur J Pain 2007; 11:125–38. [DOI] [PubMed] [Google Scholar]
- 7. Pezet S, McMahon SB. Neurotrophins: mediators and modulators of pain. Annu Rev Neurosci 2006; 29:507–38. [DOI] [PubMed] [Google Scholar]
- 8. Brown MT, Murphy FT, Radin DM, Davignon I, Smith MD, West CR. Tanezumab reduces osteoarthritic knee pain: results of a randomized, double‐blind, placebo‐controlled phase III trial. J Pain 2012; 13:790–8. [DOI] [PubMed] [Google Scholar]
- 9. Lane NE, Schnitzer TJ, Birbara CA et al Tanezumab for the treatment of pain from osteoarthritis of the knee. N Engl J Med 2010; 363:1521–31. [DOI] [PMC free article] [PubMed] [Google Scholar]
- 10. Sanga P, Katz N, Polverejan E et al Efficacy, safety, and tolerability of fulranumab, an anti‐nerve growth factor antibody, in the treatment of patients with moderate to severe osteoarthritis pain. Pain 2013; 154:1910–9. [DOI] [PubMed] [Google Scholar]
- 11. Manni L, Lundeberg T, Fiorito S, Bonini S, Vigneti E, Aloe L. Nerve growth factor release by human synovial fibroblasts prior to and following exposure to tumor necrosis factor‐alpha, interleukin‐1 beta and cholecystokinin‐8: the possible role of NGF in the inflammatory response. Clin Exp Rheumatol 2003; 21:617–24. [PubMed] [Google Scholar]
- 12. Takano S, Uchida K, Miyagi M et al Nerve growth factor regulation by TNF‐alpha and IL‐1beta in synovial macrophages and fibroblasts in osteoarthritic mice. J Immunol Res 2016; 2016:5706359. [DOI] [PMC free article] [PubMed] [Google Scholar]
- 13. Ohtori S, Orita S, Yamauchi K et al Efficacy of direct injection of Etanercept into knee joints for pain in moderate and severe knee osteoarthritis. Yonsei Med J 2015; 56:1379–83. [DOI] [PMC free article] [PubMed] [Google Scholar]
- 14. Schaible HG, von Banchet GS, Boettger MK et al The role of proinflammatory cytokines in the generation and maintenance of joint pain. Ann NY Acad Sci 2010; 1193:60–9. [DOI] [PubMed] [Google Scholar]
- 15. Shimura Y, Kurosawa H, Sugawara Y et al The factors associated with pain severity in patients with knee osteoarthritis vary according to the radiographic disease severity: a cross‐sectional study. Osteoarthritis Cartilage 2013; 21:1179–84. [DOI] [PubMed] [Google Scholar]
- 16. Takano S, Uchida K, Miyagi M et al Synovial macrophage‐derived IL‐1beta regulates the calcitonin receptor in osteoarthritic mice. Clin Exp Immunol 2016; 183:143–9. [DOI] [PMC free article] [PubMed] [Google Scholar]
- 17. Uchida K, Satoh M, Inoue G et al CD11c(+) macrophages and levels of TNF‐α and MMP‐3 are increased in synovial and adipose tissues of osteoarthritic mice with hyperlipidaemia. Clin Exp Immunol 2015; 180:551–9. [DOI] [PMC free article] [PubMed] [Google Scholar]
- 18. Bottomley MJ, Webb NJ, Watson CJ, Holt PJ, Freemont AJ, Brenchley PE. Peripheral blood mononuclear cells from patients with rheumatoid arthritis spontaneously secrete vascular endothelial growth factor (VEGF): specific up‐regulation by tumour necrosis factor‐alpha (TNF‐alpha) in synovial fluid. Clin Exp Immunol 1999; 117:171–6. [DOI] [PMC free article] [PubMed] [Google Scholar]
- 19. Kehlen A, Lauterbach R, Santos AN et al IL‐1 beta‐ and IL‐4‐induced down‐regulation of autotaxin mRNA and PC‐1 in fibroblast‐like synoviocytes of patients with rheumatoid arthritis (RA). Clin Exp Immunol 2001; 123:147–54. [DOI] [PMC free article] [PubMed] [Google Scholar]
- 20. Mason RM, Chambers MG, Flannelly J, Gaffen JD, Dudhia J, Bayliss MT. The STR/ort mouse and its use as a model of osteoarthritis. Osteoarthritis Cartilage 2001; 9:85–91. [DOI] [PubMed] [Google Scholar]
- 21. Watanabe K, Oue Y, Ikegawa S. Animal models for bone and joint disease. Mouse models develop spontaneous osteoarthritis. Clin Calcium 2011; 21:286–93. [PubMed] [Google Scholar]
- 22. Stoppiello LA, Mapp PI, Wilson D, Hill R, Scammell BE, Walsh DA. Structural associations of symptomatic knee osteoarthritis. Arthritis Rheumatol 2014; 66:3018–27. [DOI] [PMC free article] [PubMed] [Google Scholar]
- 23. Takano S, Uchida K, Miayagi M et al Adrenomedullin regulates IL‐1β gene expression in F4/80+ macrophages during synovial inflammation. J Immunol Res 2017; 2017:9832430. [DOI] [PMC free article] [PubMed] [Google Scholar]
- 24. Mills CD, Nguyen T, Tanga FY et al Characterization of nerve growth factor‐induced mechanical and thermal hypersensitivity in rats. Eur J Pain 2013; 17:469–79. [DOI] [PubMed] [Google Scholar]
- 25. Park KA, Fehrenbacher JC, Thompson EL, Duarte DB, Hingtgen CM, Vasko MR. Signaling pathways that mediate nerve growth factor‐induced increase in expression and release of calcitonin gene‐related peptide from sensory neurons. Neuroscience 2010; 171:910–23. [DOI] [PMC free article] [PubMed] [Google Scholar]
- 26. Zhu W, Galoyan SM, Petruska JC, Oxford GS, Mendell LM. A developmental switch in acute sensitization of small dorsal root ganglion (DRG) neurons to capsaicin or noxious heating by NGF. J Neurophysiol 2004; 92:3148–52. [DOI] [PubMed] [Google Scholar]
- 27. Zhu W, Oxford GS. Phosphoinositide‐3‐kinase and mitogen activated protein kinase signaling pathways mediate acute NGF sensitization of TRPV1. Mol Cell Neurosci 2007; 34:689–700. [DOI] [PMC free article] [PubMed] [Google Scholar]
- 28. Ashraf S, Mapp PI, Burston J, Bennett AJ, Chapman V, Walsh DA. Augmented pain behavioural responses to intra‐articular injection of nerve growth factor in two animal models of osteoarthritis. Ann Rheum Dis 2014; 73:1710–8. [DOI] [PMC free article] [PubMed] [Google Scholar]
Associated Data
This section collects any data citations, data availability statements, or supplementary materials included in this article.
Supplementary Materials
Additional Supporting information may be found in the online version of this article at the publisher's web‐site:
Fig. S1. Effect of tumour necrosis factor (TNF)‐α neutralization on TNF‐α‐induced nerve growth factor (NGF) expression. CD14‐positive and ‐negative synovial cells harvested from the synovium of eight osteoarthritis (OA) patients were cultured and analysed for NGF by real‐time polymerase chain reaction. CD14‐positive and ‐negative synovial cells were stimulated with control [α‐minimum essential culture medium (α‐MEM)], 10 ng/ml TNF‐α or 10 ng/ml TNF‐α and 1 μg/ml TNF‐α neutralizing antibody (TNF‐α + Neu; Biolegend, San Diego, CA, USA) for 24 h prior to the extraction and analysis of total RNA. Differences among the control and TNF‐α or TNF‐α + Neu groups were determined using the Bonferroni multiple comparisons test with one‐way analysis of variance (anova). P < 0·05 was considered statistically significant. All data are presented as the mean ± standard error (SE) (n = 8). aStatistical difference between CD14‐negative (white bars) and ‐positive cells (black bars) under the same conditions; bstatistical difference between the control and TNF‐α group in each fraction; cstatistical difference between the TNF‐α and TNF‐α + Neu group in each fraction. Neutralizing antibody significantly reduced NGF mRNA expression in CD14‐positive and ‐negative synovial cells compared to TNF‐α‐stimulated cells.
Fig. S2. X‐ray images of STR/Ort mice. Knees of 3‐, 6‐ and 9‐month‐old male STR/Ort mice were analysed using an X‐ray system with a 10‐s exposure time at 25 kV and 10 mA using X‐ray IX industrial film. Osteoarthritis (OA) features, including joint space narrowing, subchondral bone sclerosis and osteophyte formation, were observed in 9‐month‐old mice (arrows).
Fig. S3. Effect of intra‐articular injection of phosophate‐buffered saline in STR/Ort. A total of 10 9‐month‐old male STR/Ort mice were divided into either the 10 μl intraperitoneal PBS injection group (IP) or 10 μl intra‐articular PBS injection group (IA) (n = 5 each). After 24 h, tumour necrosis factor (TNF)‐α, nerve growth factor (NGF) and interleukin (IL)‐1β mRNA levels in synovial tissues were analysed by quantitative polymerase chain reaction (qPCR). Differences between the IP and IA groups were determined using the t‐test, with P < 0·05 considered statistically significant. TNF‐α, NGF and IL‐1β mRNA levels in the IA group were significantly higher than those in the IP group. *Significant difference between IP and IA groups. Data represent mean ± standard error (s.e.) (n = 5).


