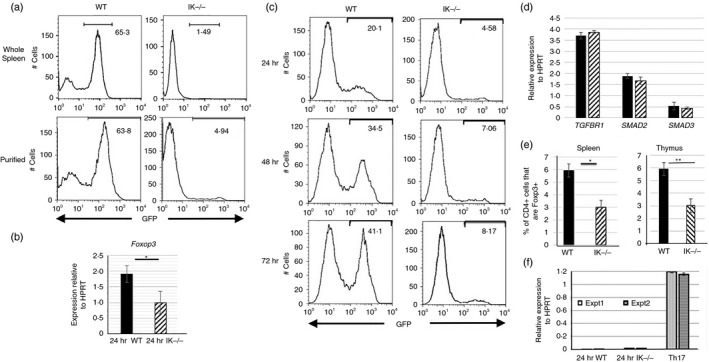
Figure 8.

Decreased induced regulatory T (iTreg) cell differentiation in the absence of Ikaros. (a) GFP expression levels in iTreg cell differentiation cultures of wild‐type and Ikaros null (IK −/−) splenocytes (top panel) as well as purified (bottom panel) splenic CD4 T‐cell populations from Foxp3/GFP reporter mice. Cells were grown in culture for 72 hr in the presence of 2 ng/ml transforming growth factor‐β (TGF‐β) and 50 U/ml interleukin‐2 (IL‐2), and were removed from anti‐CD3 and anti‐CD28 stimulation at 24 hr. Data are representative of five independent experiments each. (b) Quantitative RT‐PCR results for Foxp3 expression using cDNA from purified splenic CD4 T cells grown in culture under iTreg cell differentiation conditions for 24 hr (*P = 0·034). Data are compilation of results from three independent experiments. (c) GFP expression levels in iTreg cell differentiation cultures performed with CD4 T cells from wild‐type and Ikaros null (IK −/−) Foxp3/GFP reporter mice. Data shown are from 24, 48 and 72 hr post‐culture. (d) Quantitative RT‐PCR results for TGFBR1,SMAD2 and SMAD3 expression were obtained using cDNA from freshly isolated wild‐type (black bars) and Ikaros null (IK −/−) (patterned bars) CD4 T cells. Data are average of two independent experiments. (e) Percentages of Foxp3+ cells within the CD4+ T‐cell compartment in the spleen (average of five independent experiments) and the CD4 single‐positive compartment in the thymus (average of seven independent experiments) (*P = 0·0126, **P = 0·0046). (f) Quantitative RT‐PCR analyses of Il21 expression using cDNA from wild‐type and Ikaros null purified CD4 T cells cultured under iTreg cell polarization conditions as well as wild‐type cells cultured under T helper type 17 polarization conditions, which served as a positive control. Data are normalized to HPRT and data from two independent experiments are shown. Error bars are representative of ± SEM.
