Abstract
Background
Testicular germ cell tumors (TGCT) are rare tumors in the general population but are the most commonly occurring malignancy among men between ages 15 and 44 years in the United States (US). While non-Hispanic whites (NHW) have the highest incidence in the US, rates among Hispanics have shown the greatest increase in recent years. To forecast what these incidence rates may be in the future, an analysis of TGCT incidence in the Surveillance, Epidemiology, and End Results Program, and National Program of Cancer Registries was conducted.
Methods
TGCT incidence data among 15–59 year olds for the years 1999–2012 were obtained from 39 US cancer registries. Incidence rates through 2026 were forecast using age-period-cohort models, stratifying by race/ethnicity, histology (seminoma, nonseminoma), and age.
Results
Between 1999 and 2012, TGCT incidence rates, overall and by histology, were highest among NHWs, followed by Hispanics, Asian/Pacific Islanders, and non-Hispanic blacks. Between 2013 and 2026, rates among Hispanics were forecast to increase by 3.96% (95% Confidence Interval: 3.88–4.03) annually, the highest rate of increase of any racial/ethnic group. By 2026, the highest TGCT rates in the US will be among Hispanics, due to increases in both seminoma and nonseminoma. Rates among NHWs will increase slightly, while rates among other groups will decrease slightly.
Conclusion
By 2026, Hispanics will have the highest rate of TGCT of any racial/ethnic group in the US due to the rising incidence among recent birth cohorts. Reasons for the increase in younger Hispanics merit further exploration.
Keywords: testicular cancer, TGCT, trends, NAACCR, incidence, ethnic groups
INTRODUCTION
Testicular germ cell tumors (TGCT) are rare tumors in the general population, but are the most common malignancy among men between ages 15 and 44 years in the United States (US).1 TGCTs are histologically classified into three groups: seminomas, nonseminomas, and spermatocytic tumors. Seminomas and nonseminomas comprise 98–99% of all TGCTs and have peak incidence at approximately 35 and 25 years of age, respectively. Spermatocytic tumors (prior to 2016 known as spermatocytic seminomas)2 are very rare at all ages, accounting for only 1–2% of TGCTs, and have peak incidence at age 55 years.
The incidence of TGCT has been rising in the US and many other countries since at least the mid-20th century.1,3 While non-Hispanic white (NHW) men have the highest incidence of TGCT, the rate of increase over time has slowed, while the incidence among Hispanics has increased.1,4,5 A prior study by our group that examined data from the Surveillance, Epidemiology, and End Results (SEER) and National Program of Cancer Registries (NPCR) found that between 1998 and 2011, the largest increase in TGCT incidence was experienced by Hispanics, followed by only a slight increase in rates among NHWs.5 Incidence rates also increased among Asian/Pacific Islander (A/PI) men, however not significantly so. Rates remained relatively stable among both non-Hispanic black (NHB) and American Indian/Alaska Native (AI/AN) men. Reasons for the increases in rates are not clear as there are few well identified risk factors.6 Previous studies have shown, however, that there is a significant birth-cohort effect on TGCT rates in many countries, such that rates are higher at all ages in each successive birth cohort.7–13 These effects are present for both seminomas and nonseminomas.
In the 2010 US Census, Hispanics (16.3%) surpassed blacks (12.6%) as the largest minority group in the US.14 This shift in the US population, along with the significant increase in TGCT among Hispanic men, suggests that the future profile of TGCT might differ from the current profile. Thus, the current study sought to forecast trends in TGCT incidence, taking into account heterogeneous birth-cohort effects, to determine whether incidence rates among Hispanics and men of other racial/ethnic backgrounds could approach the rates among NHWs in the US.
MATERIALS AND METHODS
Incident TGCT Data
Data for the current study were drawn from the Cancer Incidence in North America (CiNA) analytic file provided by the North American Association of Central Cancer Registries (NAACCR). Population-based cancer incidence data were obtained from NAACCR member registries that are funded by NCI’s SEER program and/or the Centers for Disease Control and Prevention’s National Program of Cancer Registries (NPCR).15 Participating registries met NAACCR’s data quality criteria for the December 2014 submission cycle. Data for the years 1999 through 2012 from thirty-nine registries were included. These registries cover approximately 84% of the US population. The CiNA analytic file dates back to 1995, but due to missing data from many of the registries, we included data from 1999 through the most recent available year, 2012. Two data files were provided: (1) the CiNA analytic file for expanded races and (2) the CiNA analytic file for NAACCR Hispanic Identification Algorithm (version 2) Origin.6 The first data file was used to obtain data on A/PI populations. The second data file was used to obtain data on NHW, Hispanic (all races), and NHB populations. The NAACCR Hispanic/Latino Identification Algorithm, version 2.2.1 (NHIA v2.2.1) uses a combination of NAACCR variables to directly or indirectly classify persons as Hispanic/Latino for analytic purposes. The algorithm uses the following NAACCR standard variables: Spanish/Hispanic origin (item 190), name-last (item 2230), name-maiden (item 2390), birthplace (item 250), race 1 (item 160), sex (item 220), and Indian Health Service link (item 192).16
TGCT was defined using the International Classification of Diseases for Oncology (3rd ed.) topography (C62) and morphology codes (seminoma: 9060/3–9062/3, 9064/3; nonseminoma: 9065/3–9102/3; spermatocytic tumors: 9063/3).17 Data on race, Hispanic ethnicity, histology, year of diagnosis, and age at diagnosis were available for TGCT cases. Incidence rates per 100,000 man-years, age-adjusted to the US 2000 standard population, and their 95% confidence intervals were calculated. Age-adjusted TGCT incidence rates were calculated for NHW, Hispanic (all races), NHB, and A/PI men. Small numbers of TGCTs among AI/AN men prevented their inclusion in the analysis. Similarly, spermatocytic tumors could not be analyzed due to small case counts.
Birth Cohort Analysis
For examination of TGCT incidence by birth cohort, we used data from the SEER 9 registries for the years 1975–2012. The SEER program of the National Cancer Institute collects and publishes statistics from population-based cancer registries in the US.18 The SEER 9 registries cover approximately 9.5% of the US population and include cancer registries in Atlanta, Connecticut, Detroit, Hawaii, Iowa, New Mexico, San Francisco-Oakland, Seattle-Puget Sound, and Utah.
Population Data
National population projections were used to estimate future TGCT case counts and calculate the future TGCT burden (percent change in numbers of cases). In December 2012, the US Census Bureau released the 2012 national population projections which provide projected population estimates from July 1, 2012 until July 1, 2060 stratified by age (single years), sex, race, and Hispanic ethnicity. The population projections are based on the July 1, 2011 population estimates and include assumptions about future births, deaths, and net migration.19
Statistical Analysis
We evaluated temporal trends in TGCT incidence using age-period-cohort (APC) models. A detailed description of our forecasting model has been described previously.20–22 In brief, the expected rate is a product of the age incidence, in a reference cohort, times the cohort relative risk, where the relative risk of future cohorts is obtained by extrapolating the last segment of the joinpoint analysis of the observed cohort relative risk.20,23 Specifically, given data for men aged 15–59 in calendar years 1999–2012, the observed cohorts are the cohorts born between 1940 and 1997 and the future cohorts, whose experience must be projected in forecasts, are the cohorts born between 1998 and 2011. Age-period-cohort models are complicated by the nonidentifiability issue. Age, period, and cohort metrics are interconnected such that two of the three factors coexist on the same time scale. The statistical strategy of restricted age-period-cohort models does not overcome the nonidentifiability issue, but rather offers the ability to formally test for differences in two sets of incidence rates and derive estimable functions when age, period, and cohort are orthogonally derived into their linear and nonlinear components.
For each APC model, goodness-of-fit was evaluated based on the magnitude of the over-dispersion statistic, normality of residuals, and similarity between observed and fitted rates. Incidence rates were age-standardized per 100,000 man-years using the 2000 US standard population. To compute the burden, or projected absolute number of new TGCT cases, we multiplied the projected incidence rates by age from the APC model by the projected population size from the US Census Bureau.20 We also calculated estimated annual percentage changes (EAPC) for the observed 1999–2012 rates and forecast 2013–2026 rates and percent change in burden between 2013 and 2026. All analyses were conducted using MATLAB (v14).
RESULTS
In the present study, data were observed for 1999 to 2012 and forecast for 2013 to 2026. In the observed period, TGCT incidence rates were highest among NHW men, followed in order by Hispanic, A/PI, and NHB men (Table 1). Rates for both seminomas and nonseminomas followed the same ranking. Among all men, temporal analysis showed that the incidence of TGCT modestly increased during the observed period (EAPC1999–2012: 0.38%) and the increase is forecast to continue during the next decade (EAPC2013–2026: 1.17%). The overall increase is being determined largely by nonseminoma, as rates of nonseminoma increased between 1999 and 2012 (EAPC1999–2012: 1.25%) and are forecast to continue to increase throughout the next decade (EAPC2013–2026: 1.69%). In contrast, rates of seminoma between 1999 and 2012 changed little (EAPC1999–2012: −0.20%) and are forecast to remain fairly stable (EAPC2013–2026: 0.18%). Similar to previous studies utilizing age-period-cohort models, we observed a birth cohort effect in TGCT incidence trends. Figure 1 shows incidence rates of TGCT by birth cohort. Incidence rates increased at all ages among each birth cohort between that of 1925–1934 and that of 1985–1994 (Figure 1).
Table 1.
Age-standardized testicular germ cell tumor incidence rates per 100,000 man-years and burden through 2026 by histologic subtype and race/ethnicity
| 1999* | 2012* | 2013 | 2020 | 2026 | Burden (% Change)† | Estimated Annual Percent Change | |||||
|---|---|---|---|---|---|---|---|---|---|---|---|
|
| |||||||||||
| Rate | Rate | Count | Rate | Count | Rate | Count | Rate | 2013–2026 | 1999–2012 | 2013–2026 | |
| All TGCT | |||||||||||
| All Men | 7.97 | 8.37 | 8,053 | 8.60 | 8,936 | 9.21 | 9,976 | 9.98 | 23.88 | 0.38 | 1.17 |
| Non-Hispanic White | 9.84 | 10.51 | 6,037 | 10.66 | 6,018 | 10.83 | 5,950 | 10.86 | −1.44 | 0.45 | 0.15 |
| Hispanic (All Races) | 5.30 | 6.76 | 1,337 | 7.47 | 1,992 | 9.68 | 2,862 | 12.41 | 114.06 | 2.10 | 3.96 |
| Non-Hispanic Black | 1.97 | 2.25 | 269 | 2.14 | 271 | 2.00 | 267 | 1.83 | −0.74 | 0.20 | −1.12 |
| Asian/Pacific Islander | 2.98 | 3.04 | 212 | 3.25 | 231 | 3.10 | 242 | 3.00 | 14.15 | 0.48 | −0.46 |
| Seminoma | |||||||||||
| All Men | 4.87 | 4.75 | 4,385 | 4.80 | 4,553 | 4.81 | 4,816 | 4.90 | 9.83 | −0.20 | 0.18 |
| Non-Hispanic White | 5.96 | 5.97 | 3,387 | 6.03 | 3,152 | 5.76 | 2,862 | 5.28 | −15.50 | −0.01 | −1.00 |
| Hispanic (All Races) | 3.16 | 3.68 | 637 | 3.78 | 876 | 4.46 | 1,167 | 5.27 | 83.20 | 1.15 | 2.58 |
| Non-Hispanic Black | 1.35 | 1.49 | 176 | 1.44 | 161 | 1.25 | 143 | 1.03 | −18.75 | 0.12 | −2.39 |
| Asian/Pacific Islander | 1.82 | 1.98 | 123 | 1.92 | 136 | 1.88 | 148 | 1.85 | 20.33 | −0.21 | −0.27 |
| Nonseminoma | |||||||||||
| All Men | 3.08 | 3.60 | 3,621 | 3.75 | 4,160 | 4.18 | 4,728 | 4.66 | 30.57 | 1.25 | 1.69 |
| Non-Hispanic White | 3.85 | 4.53 | 2,617 | 4.57 | 2,645 | 4.69 | 2,594 | 4.70 | −0.88 | 1.17 | 0.22 |
| Hispanic (All Races) | 2.35 | 3.25 | 709 | 3.77 | 1,068 | 5.02 | 1,532 | 6.47 | 116.08 | 2.98 | 4.21 |
| Non-Hispanic Black | 0.69 | 0.96 | 120 | 0.90 | 126 | 0.88 | 129 | 0.84 | 7.50 | 0.47 | −0.45 |
| Asian/Pacific Islander | 1.69 | 1.37 | 110 | 1.66 | 130 | 1.74 | 159 | 1.94 | 44.55 | 0.31 | 1.49 |
Number of testicular germ cell tumor cases for 1999 and 2012 are not provided as they are based on SEER/NPCR data and not extrapolated to the entire US population
Burden is the percent change in number of cases between 2013 and 2026 and is calculated using the formula: [((2026 count – 2013 count)/(2013 count)) * 100]
Figure 1.
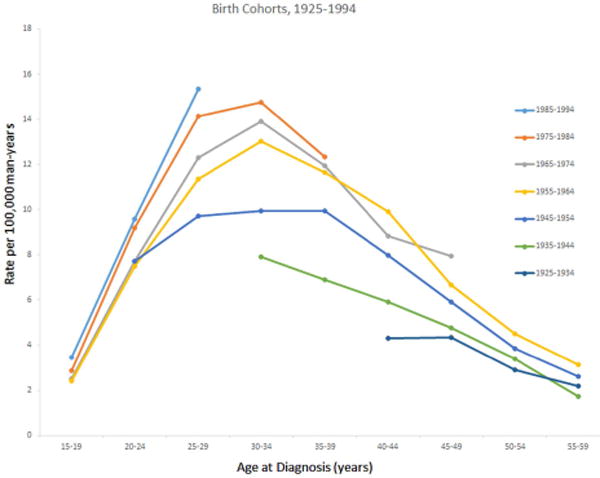
Age-standardized testicular germ cell tumor incidence rates by decade of birth cohort and age at diagnosis, SEER 9 Registries, 1975–2013.
Also shown in Table 1 are the observed and projected age-standardized incidence rates (per 100,000 man-years) by race/ethnicity. Although TGCT rates were highest among NHW men, the greatest increase in rates between 1999 and 2012 was experienced by Hispanic men (EAPC1999–2012: 2.10%) (Table 1 and Figure 2A). Rates increased slightly among A/PI (EAPC1999–2012: 0.48%) and NHW (EAPC1999–2012: 0.45%) men and remained relatively stable among NHB (EAPC1999–2012: 0.20%) men. Throughout the next decade, the largest increase in rates are forecast among Hispanic men (EAPC2013–2026: 3.96%), whose rates will surpass those among NHW men by 2026 (ASRHispanic, 2026: 12.41 versus ASRnon-Hispanic white, 2026: 10.86). TGCT rates are forecast to remain relatively stable among NHW men (EAPC2013–2026: 0.15%), and decrease modestly among NHB (EAPC2013–2026: −1.12%) and A/PI (EAPC2013–2026: −0.46%) men.
Figure 2.
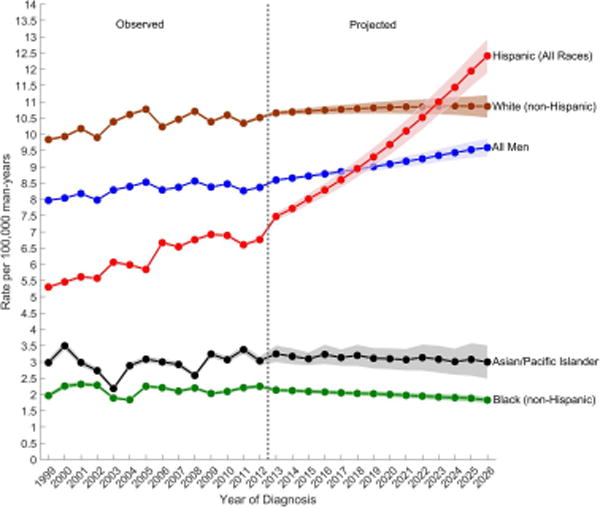
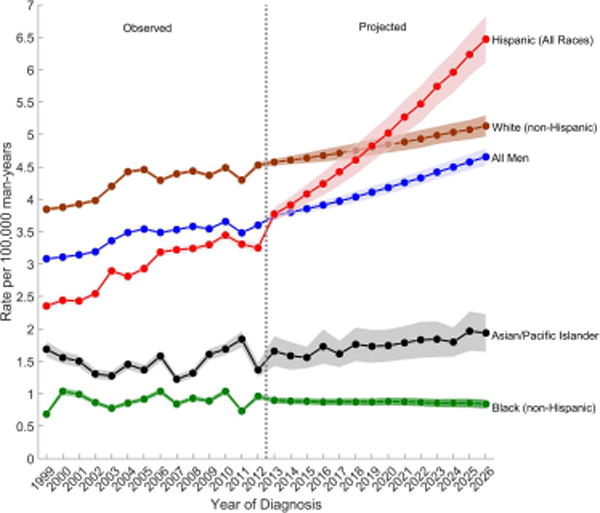
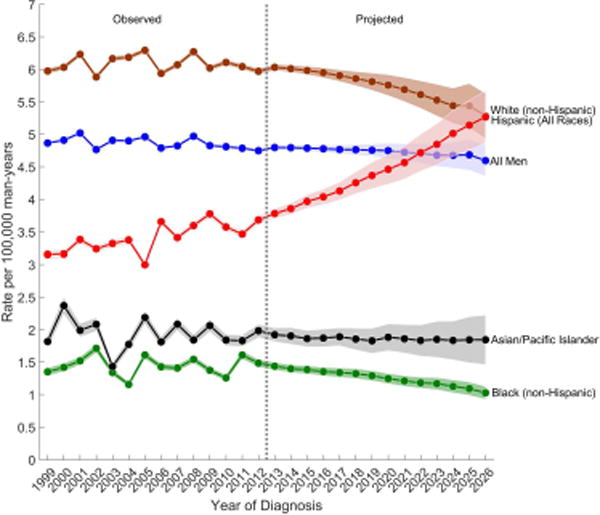
Observed (1999–2012) and projected (2013–2026) age-standardized incidence rates of (a) testicular germ cell tumors, (b) seminomas, and (c) nonseminomas among non-Hispanic white, Hispanic (All Races), non-Hispanic black, Asian/Pacific Islander, and all men, SEER/NPCR Registries. Shaded bands show the 95% confidence interval.
(A) Testicular germ cell tumors
(B) Nonseminomas
(C) Seminomas
Among nonseminomas, the greatest increase in incidence is forecast among Hispanic men (EAPC2013–2026: 4.21%), whose rates will surpass the rates among NHW men by 2026 (ASR Hispanic, 2026: 6.47 versus ASRnon-Hispanic white, 2026: 4.70) (Table 1 and Figure 2B). Nonseminoma rates are forecast to also increase among A/PI men (EAPC2013–2026: 1.49%), remain relatively stable among NHW men (EAPC2013–2026: 0.22%) and decrease among NHB men (EAPC2013–2026: −0.45%). Over the next decade, seminoma rates are forecast to increase only among Hispanic men (EAPC2013–2026: 2.58%) whose rates will equal those of NHW men by 2026 (ASRHispanic, 2026: 5.27 versus ASRnon-Hispanic white, 2026: 5.28) (Table 1 and Figure 2C). Seminoma rates are forecast to decrease among NHB (EAPC2013–2026: −2.39%), NHW (EAPC2013–2026: −1.00%), and A/PI (EAPC2013–2026: −0.27%) men. The APC-based cohort rate ratios (Supplementary Figure 1) show an increasing cohort effect on both seminoma and nonseminoma rates among young Hispanic men born since 1975, reinforcing the increase in TGCT incidence rates among Hispanic men in our forecast models.
Although NHWs are forecast to have only the second highest rate of TGCT in the US by 2026, they will remain the largest racial/ethnic group in the country and thus, will continue to have the greatest number of TGCTs. The largest percent increase in the number of TGCT cases from 2013 to 2026, however, will be among Hispanics (114.06%) (Table 1).
Figure 3 shows the observed and projected age-standardized incidence rates by age group for each TGCT histologic subtype. Overall, men aged 25–34 years have the highest incidence of TGCT and are forecast to have the greatest increase in rates throughout the next decade (Figure 3A). Rates are second highest among men aged 35–44 years, but are forecast to gradually decline over the next decade while the rates among men aged 15–24 years (third highest) are forecast to increase and reach the rates among 35–44 year olds around 2026. The lowest rates are among men aged 45–59 years and these rates are forecast to remain unchanged.
Figure 3.
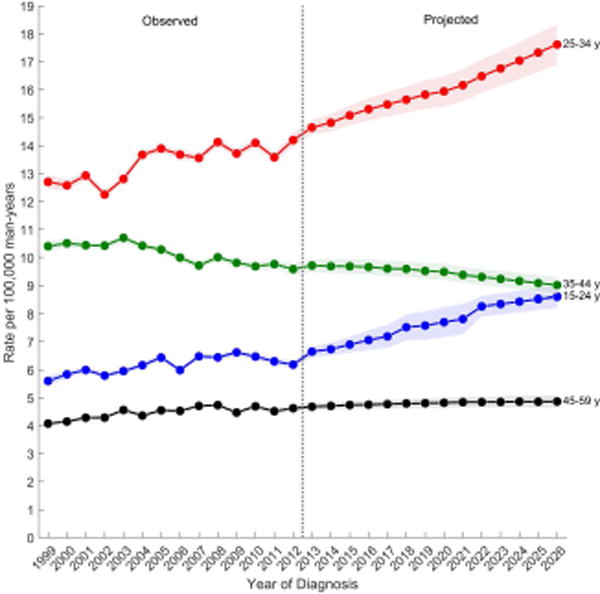
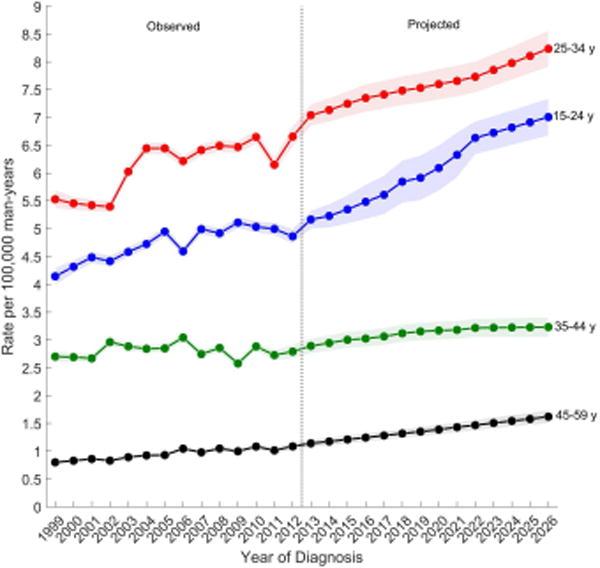
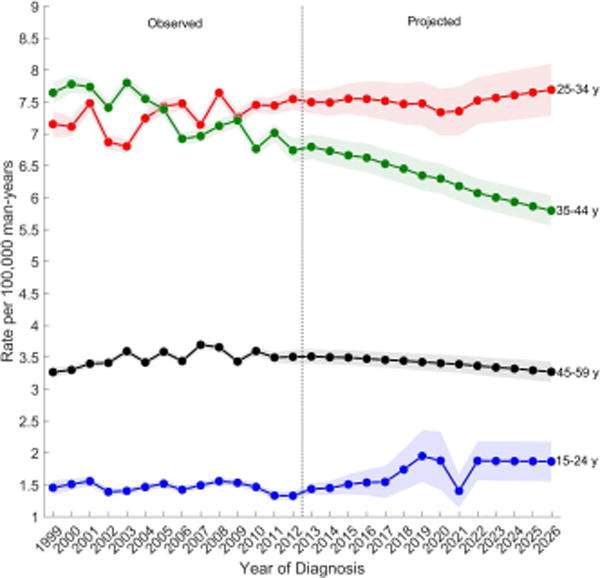
Observed (1999–2012) and projected (2013–2026) age-standardized incidence rates of (a) testicular germ cell tumors, (b) seminomas, (c) nonseminomas by age group, SEER/NPCR Registries. Shaded bands show the 95% confidence interval.
(A) Testicular germ cell tumors
(B) Nonseminomas
(C) Seminomas
Among nonseminomas (Figure 3B), incidence rates were highest among men aged 25–34 years followed by men aged 15–24 years. Incidence rates for both age groups are forecast to increase over the next decade. Rates were lower among men aged 35–44 and 45–59 years, and are forecast to increase modestly over the next decade. Among seminomas (Figure 3C), incidence rates are highest for men aged 25–34 years, followed by men aged 35–44, 45–69, and lowest among men aged 15–24. During the observed time period, rates remained relatively unchanged among all men except for men aged 35–44 years, whose rates decreased. Similarly, in the projected period, rates are forecast to decrease among men aged 35–44 years and are forecast to remain unchanged among all other men.
DISCUSSION
The present study found that while NHW men had the highest incidence of TGCT between 1999 and 2012, the greatest increase in incidence was experienced by Hispanic men, who were the only racial/ethnic group to experience increases in both histologic subtypes. Over the next decade, incidence rates among Hispanics are forecast to continue to increase and surpass the rates among NHW men by 2026.
Overall, the increase in TGCT incidence was largely due to the increase in nonseminoma rates. Why there are differences in the rate patterns of nonseminomas and seminomas is unclear as large differences in risk factors have not been identified.6 The only risk factor which has been consistently associated with one histologic subtype (nonseminoma) is marijuana use.24–27 The prevalence of marijuana use in the US has increased in the general population and among Hispanics.28 While it is possible that the positive association between marijuana use and nonseminoma could explain some of the increase in TGCT rates, this interpretation should be made with caution as the existing studies on marijuana use and TGCT are limited in study design (all are case-control studies) and rely on self-reported data.25–27
It is unclear why there are differences in the risk of TGCT among different racial/ethnic groups in the US. Environmental risk factors for TGCT have not been well-identified; the only well-described risk factors for TGCT include personal and family history of TGCT, cryptorchidism, hypospadias, and impaired spermatogenesis.6 The collection of these male reproductive disorders, termed the Testicular Dysgenesis Syndrome (TDS), has been hypothesized to have a common in-utero etiology.29 Whether the prevalence of all TDS conditions varies by racial/ethnic group remains unknown. A prior study using data from the Collaborative Perinatal Project (CPP) found that white boys had higher rates of cryptorchidism than black boys.30 The difference in cryptorchidism prevalence in the CPP, however, was far lower than the difference in TGCT incidence in white and black men in the US.30
The notable disparity in TGCT risk by racial/ethnic group and the increased risk among first degree relatives16,31–33 have supported the existence of a genetic component to TGCT susceptibility. Linkage studies have failed to identify a major gene effect,34,35 however, genome wide association studies (GWAS) have thus far identified 16 loci associated with TGCT susceptibility.36–41 An examination of the allele distribution of the TGCT risk loci finds that the distribution among Hispanic men is more similar to the distribution among European men than among men of low risk, such as Africans.42 In particular, the allele distribution of the major TGCT GWAS locus at KITLG, is very similar among Hispanics (A: 17%, G: 83%) and Europeans (A: 20%, G: 80%), in contrast to the distribution among Africans (A: 75%, G: 25%).42
Genetic susceptibility to TGCT may explain some of the difference in rates observed by race/ethnicity, however, it cannot solely explain the steady increases seen in rates since the mid-twentieth century. These rapid increases in incidence suggest that environmental factors play an important role in etiology.43 One such factor that has been widely hypothesized to be related to risk is maternal exposure to endocrine-disrupting chemicals.6 While evidence suggests that EDCs such as p,p′-dichlorodiphenyldichloroethylene (DDE) and chlordane-related compounds cis- and trans-nonachlor may be associated with TGCT risk, there is currently less evidence of their association with other TDS disorders.44
Similar to findings from previous studies,1,5 the current study found that the most pronounced increase in TGCT incidence is among Hispanic men. The 2010 US census reported that the majority of Hispanics in the US are of Mexican ancestry (63.0%), followed by Puerto Rican (9.2%), Cuban (3.5%), Salvadoran (3.3%), Dominican (2.8%), and Guatemalan ancestries (2.1%).45 Estimated TGCT incidence rates in Mexico (2.8 per 100,000 man-years), Puerto Rico (3.1), Cuba (1.4), El Salvador (0.4), Dominican Republic (0.4), and Guatemala (0.6)46 are variable, but all are lower than the rate among US Hispanics (3.9). A possible explanation for the higher rates seen in US Hispanics is that rates among Hispanics rise with migration to the US. Previous studies of migrants from lower to higher rate countries have reported that changes in TGCT incidence do not occur among the first generation of migrants, but rather, among subsequent generations.47,48 Thus, it is possible that the increase in TGCT rates among the US Hispanic populations could be related to exposures that are present in the US but not in the home countries of persons who immigrate, however, information on migration status was not available from the SEER/NPCR registries.
As reported in previous studies7–13, a significant birth cohort effect on TGCT incidence trends was evident in the current study. Originally identified by Moller13 when examining TGCT rates in Danish men, TGCT incidence was more strongly dependent on birth cohort than on calendar period. While birth cohort effects in TGCT incidence trends have been widely documented, calendar period effects have also been reported.11,12,49–54 A previous age-period-cohort analysis of SEER data restricted to whites during 1973–2008 found that calendar period deviations were highly statistically significant for TGCT overall and for seminoma.12 What is determining either birth cohort or calendar period effects, however, is, as yet, unclear.
Strengths of the current study were the use of population-based cancer registry data from 39 registries, which captured a large sample of the US population, and the use of novel age-period-cohort models for forecasting incidence rates. Limitations include the inability to examine rates of spermatocytic tumors and to include AI/AN populations due to small case counts. In addition, the current study lacked information on place of birth and country-specific ancestry, which may be useful in examining hypotheses concerning environmental and genetic risk factors of TGCT. An additional limitation was the use of the NHIA algorithm for the identification of Hispanic ethnicity, as this could result in potential misclassification, however males are arguably less likely to be incorrectly classified.
The current study indicates that TGCT incidence is increasing most rapidly among US Hispanic men and is forecast to increase over the next decade. Reasons for the increase in rates and trends are unclear, but could be related to as yet unidentified varying exposures, place of birth, country of ancestry and/or length of residence in the US. The increasing rates among Hispanic men suggest an area where future public health efforts should be targeted.
Supplementary Material
Precis.
Between 2013 and 2026, TGCT incidence rates among Hispanic men were forecast to increase by 3.96% annually, the highest rate of increase among any racial/ethnic group in the US. By 2026, the highest TGCT rates in the US will be among Hispanics, due to the rising incidence among recent birth cohorts.
Acknowledgments
FUNDING SUPPORT
This work was supported by the Intramural Research Program of the National Cancer Institute.
Footnotes
CONFLICT OF INTEREST DISCLOSURES
The authors declare no competing interests and have no financial disclosures.
References
- 1.Ghazarian AA, Trabert B, Devesa SS, et al. Recent trends in the incidence of testicular germ cell tumors in the United States. Andrology. 2015;3:13–8. doi: 10.1111/andr.288. [DOI] [PMC free article] [PubMed] [Google Scholar]
- 2.Ulbright TM, Amin MB, Blazer B. Germ Cell Tumours. In: Moch H, Humphrey PA, Ulbright TM, Reuter VE, editors. WHO Classification of Tumours of the Urinary System and Male Genital Organs. 4th. Vol. 8. Lyon, France: IARCPress; 2016. pp. 189–226. [Google Scholar]
- 3.Trabert B, Chen J, Devesa SS, et al. International patterns and trends in testicular cancer incidence, overall and by histologic subtype, 1973–2007. Andrology. 2015;3:4–12. doi: 10.1111/andr.293. [DOI] [PMC free article] [PubMed] [Google Scholar]
- 4.Chien FL, Schwartz SM, Johnson RH. Increase in testicular germ cell tumor incidence among Hispanic adolescents and young adults in the United States. Cancer. 2014;120:2728–34. doi: 10.1002/cncr.28684. [DOI] [PMC free article] [PubMed] [Google Scholar]
- 5.Ghazarian AA, Trabert B, Graubard BI, et al. Incidence of testicular germ cell tumors among US men by census region. Cancer. 2015;121:4181–9. doi: 10.1002/cncr.29643. [DOI] [PMC free article] [PubMed] [Google Scholar]
- 6.McGlynn KA, Cook MB. Etiologic factors in testicular germ-cell tumors. Future Oncol. 2009;5:1389–402. doi: 10.2217/fon.09.116. [DOI] [PMC free article] [PubMed] [Google Scholar]
- 7.Bergstrom R, Adami HO, Mohner M, et al. Increase in testicular cancer incidence in six European countries: a birth cohort phenomenon. J Natl Cancer Inst. 1996;88:727–33. doi: 10.1093/jnci/88.11.727. [DOI] [PubMed] [Google Scholar]
- 8.Ekbom A, Akre O. Increasing incidence of testicular cancer–birth cohort effects. Apmis. 1998;106:225–9. doi: 10.1111/j.1699-0463.1998.tb01340.x. discussion 229–31. [DOI] [PubMed] [Google Scholar]
- 9.Pearce N, Sheppard RA, Howard JK, et al. Time trends and occupational differences in cancer of the testis in New Zealand. Cancer. 1987;59:1677–82. doi: 10.1002/1097-0142(19870501)59:9<1677::aid-cncr2820590926>3.0.co;2-q. [DOI] [PubMed] [Google Scholar]
- 10.Stone JM, Cruickshank DG, Sandeman TF, et al. Trebling of the incidence of testicular cancer in victoria, Australia (1950–1985) Cancer. 1991;68:211–9. doi: 10.1002/1097-0142(19910701)68:1<211::aid-cncr2820680139>3.0.co;2-q. [DOI] [PubMed] [Google Scholar]
- 11.Zheng T, Holford TR, Ma Z, et al. Continuing increase in incidence of germ-cell testis cancer in young adults: experience from Connecticut, USA, 1935–1992. Int J Cancer. 1996;65:723–9. doi: 10.1002/(SICI)1097-0215(19960315)65:6<723::AID-IJC2>3.0.CO;2-0. [DOI] [PubMed] [Google Scholar]
- 12.Speaks C, McGlynn KA, Cook MB. Significant calendar period deviations in testicular germ cell tumors indicate that postnatal exposures are etiologically relevant. Cancer Causes Control. 2012;23:1593–8. doi: 10.1007/s10552-012-0036-5. [DOI] [PMC free article] [PubMed] [Google Scholar]
- 13.Moller H. Decreased testicular cancer risk in men born in wartime. J Natl Cancer Inst. 1989;81:1668–9. doi: 10.1093/jnci/81.21.1668-a. [DOI] [PubMed] [Google Scholar]
- 14.Humes KR, Jones NA, Ramirez RR. Overview of Race and Hispanic Origin: 2010. 2010 Census Briefs. 2011 [Google Scholar]
- 15.Kohler BA, Sherman RL, Howlader N, et al. Annual Report to the Nation on the Status of Cancer, 1975–2011, Featuring Incidence of Breast Cancer Subtypes by Race/Ethnicity, Poverty, and State. J Natl Cancer Inst. 2015;107:djv048. doi: 10.1093/jnci/djv048. [DOI] [PMC free article] [PubMed] [Google Scholar]
- 16.Hemminki K, Li X. Familial risk in testicular cancer as a clue to a heritable and environmental aetiology. Br J Cancer. 2004;90:1765–70. doi: 10.1038/sj.bjc.6601714. [DOI] [PMC free article] [PubMed] [Google Scholar]
- 17.Fritz A, Percy C, Jack A, et al. International Classification of Diseases for Oncology (ICD-O) 3rd. World Health Organization; Geneva: 2000. [Google Scholar]
- 18.Howlader N, Noone AM, Krapcho M, Garshell J, Miller D, Altekruse SF, Kosary CL, Yu M, Ruhl J, Tatalovich Z, Mariotto A, Lewis DR, Chen HS, Feuer EJ, Cronin KA, editors. SEER Cancer Statistics Review, 1975–2012. National Cancer Institute; Bethesda, MD: http://seer.cancer.gov/csr/1975_2012/, based on November 2014 SEER data submission, posted to the SEER web site, April 2015. [Google Scholar]
- 19.U.S. Census Bureau. 2012 National Population Projections. 2012 [Google Scholar]
- 20.Rosenberg PS, Barker KA, Anderson WF. Estrogen Receptor Status and the Future Burden of Invasive and In Situ Breast Cancers in the United States. J Natl Cancer Inst. 2015;107 doi: 10.1093/jnci/djv159. [DOI] [PMC free article] [PubMed] [Google Scholar]
- 21.Rosenberg PS, Check DP, Anderson WF. A web tool for age-period-cohort analysis of cancer incidence and mortality rates. Cancer Epidemiol Biomarkers Prev. 2014;23:2296–302. doi: 10.1158/1055-9965.EPI-14-0300. [DOI] [PMC free article] [PubMed] [Google Scholar]
- 22.Rosenberg PS, Anderson WF. Age-period-cohort models in cancer surveillance research: ready for prime time? Cancer Epidemiol Biomarkers Prev. 2011;20:1263–8. doi: 10.1158/1055-9965.EPI-11-0421. [DOI] [PMC free article] [PubMed] [Google Scholar]
- 23.Kim HJ, Fay MP, Feuer EJ, et al. Permutation tests for joinpoint regression with applications to cancer rates. Stat Med. 2000;19:335–51. doi: 10.1002/(sici)1097-0258(20000215)19:3<335::aid-sim336>3.0.co;2-z. [DOI] [PubMed] [Google Scholar]
- 24.Gurney J, Shaw C, Stanley J, et al. Cannabis exposure and risk of testicular cancer: a systematic review and meta-analysis. BMC Cancer. 2015;15:897. doi: 10.1186/s12885-015-1905-6. [DOI] [PMC free article] [PubMed] [Google Scholar]
- 25.Trabert B, Sigurdson AJ, Sweeney AM, et al. Marijuana use and testicular germ cell tumors. Cancer. 2011;117:848–53. doi: 10.1002/cncr.25499. [DOI] [PMC free article] [PubMed] [Google Scholar]
- 26.Daling JR, Doody DR, Sun X, et al. Association of marijuana use and the incidence of testicular germ cell tumors. Cancer. 2009;115:1215–23. doi: 10.1002/cncr.24159. [DOI] [PMC free article] [PubMed] [Google Scholar]
- 27.Lacson JC, Carroll JD, Tuazon E, et al. Population-based case-control study of recreational drug use and testis cancer risk confirms an association between marijuana use and nonseminoma risk. Cancer. 2012;118:5374–83. doi: 10.1002/cncr.27554. [DOI] [PMC free article] [PubMed] [Google Scholar]
- 28.Hasin DS, Saha TD, Kerridge BT, et al. Prevalence of Marijuana Use Disorders in the United States Between 2001-2002 and 2012-2013. JAMA Psychiatry. 2015;72:1235–42. doi: 10.1001/jamapsychiatry.2015.1858. [DOI] [PMC free article] [PubMed] [Google Scholar]
- 29.Skakkebaek NE. Testicular dysgenesis syndrome. Horm Res. 2003;60(Suppl 3):49. doi: 10.1159/000074499. [DOI] [PubMed] [Google Scholar]
- 30.McGlynn KA, Graubard BI, Klebanoff MA, et al. Risk factors for cryptorchism among populations at differing risks of testicular cancer. Int J Epidemiol. 2006;35:787–95. doi: 10.1093/ije/dyl024. [DOI] [PMC free article] [PubMed] [Google Scholar]
- 31.Gundy S, Babosa M, Baki M, et al. Increased predisposition to cancer in brothers and offspring of testicular tumor patients. Pathol Oncol Res. 2004;10:197–203. doi: 10.1007/BF03033760. [DOI] [PubMed] [Google Scholar]
- 32.Hemminki K, Chen B. Familial risks in testicular cancer as aetiological clues. Int J Androl. 2006;29:205–10. doi: 10.1111/j.1365-2605.2005.00599.x. [DOI] [PubMed] [Google Scholar]
- 33.Heimdal K, Olsson H, Tretli S, et al. Familial testicular cancer in Norway and southern Sweden. Br J Cancer. 1996;73:964–9. doi: 10.1038/bjc.1996.173. [DOI] [PMC free article] [PubMed] [Google Scholar]
- 34.Crockford GP, Linger R, Hockley S, et al. Genome-wide linkage screen for testicular germ cell tumour susceptibility loci. Hum Mol Genet. 2006;15:443–51. doi: 10.1093/hmg/ddi459. [DOI] [PubMed] [Google Scholar]
- 35.Kratz CP, Mai PL, Greene MH. Familial testicular germ cell tumours. Best Pract Res Clin Endocrinol Metab. 2010;24:503–13. doi: 10.1016/j.beem.2010.01.005. [DOI] [PMC free article] [PubMed] [Google Scholar]
- 36.Ruark E, Seal S, McDonald H, et al. Identification of nine new susceptibility loci for testicular cancer, including variants near DAZL and PRDM14. Nat Genet. 2013;45:686–9. doi: 10.1038/ng.2635. [DOI] [PMC free article] [PubMed] [Google Scholar]
- 37.Rapley EA, Turnbull C, Al Olama AA, et al. A genome-wide association study of testicular germ cell tumor. Nat Genet. 2009;41:807–10. doi: 10.1038/ng.394. [DOI] [PMC free article] [PubMed] [Google Scholar]
- 38.Kanetsky PA, Mitra N, Vardhanabhuti S, et al. Common variation in KITLG and at 5q31.3 predisposes to testicular germ cell cancer. Nat Genet. 2009;41:811–5. doi: 10.1038/ng.393. [DOI] [PMC free article] [PubMed] [Google Scholar]
- 39.Chung CC, Kanetsky PA, Wang Z, et al. Meta-analysis identifies four new loci associated with testicular germ cell tumor. Nat Genet. 2013;45:680–5. doi: 10.1038/ng.2634. [DOI] [PMC free article] [PubMed] [Google Scholar]
- 40.Turnbull C, Rapley EA, Seal S, et al. Variants near DMRT1, TERT and ATF7IP are associated with testicular germ cell cancer. Nat Genet. 2010;42:604–7. doi: 10.1038/ng.607. [DOI] [PMC free article] [PubMed] [Google Scholar]
- 41.Schumacher FR, Wang Z, Skotheim RI, et al. Testicular germ cell tumor susceptibility associated with the UCK2 locus on chromosome 1q23. Hum Mol Genet. 2013;22:2748–53. doi: 10.1093/hmg/ddt109. [DOI] [PMC free article] [PubMed] [Google Scholar]
- 42.Abecasis GR, Auton A, Brooks LD, et al. An integrated map of genetic variation from 1,092 human genomes. Nature. 2012;491:56–65. doi: 10.1038/nature11632. [DOI] [PMC free article] [PubMed] [Google Scholar]
- 43.Adami HO, Bergstrom R, Mohner M, et al. Testicular cancer in nine northern European countries. Int J Cancer. 1994;59:33–8. doi: 10.1002/ijc.2910590108. [DOI] [PubMed] [Google Scholar]
- 44.Cook MB, Trabert B, McGlynn KA. Organochlorine compounds and testicular dysgenesis syndrome: human data. Int J Androl. 2011;34:e68–84. doi: 10.1111/j.1365-2605.2011.01171.x. discussion e84–5. [DOI] [PMC free article] [PubMed] [Google Scholar]
- 45.Ennis SR, Rios-Vargas M, Albert NG. The Hispanic Population: 2010. 2010 Census Briefs [Google Scholar]
- 46.Ferlay J, Soerjomataram I, Ervik M, et al. GLOBOCAN 2012 v1.0, Cancer Incidence and Mortality Worldwide: IARC CancerBase No. 11 [Internet] Lyon, France: International Agency for Research on Cancer; 2013. Available from: http://globocan.iarc.fr, [accessed 20 June 2014]. 2013. [Google Scholar]
- 47.Parkin DM, Iscovich J. Risk of cancer in migrants and their descendants in Israel: II. Carcinomas and germ-cell tumours. Int J Cancer. 1997;70:654–60. doi: 10.1002/(sici)1097-0215(19970317)70:6<654::aid-ijc5>3.0.co;2-u. [DOI] [PubMed] [Google Scholar]
- 48.Hemminki K, Li X. Cancer risks in Nordic immigrants and their offspring in Sweden. Eur J Cancer. 2002;38:2428–34. doi: 10.1016/s0959-8049(02)00496-3. [DOI] [PubMed] [Google Scholar]
- 49.McGlynn KA, Devesa SS, Sigurdson AJ, et al. Trends in the incidence of testicular germ cell tumors in the United States. Cancer. 2003;97:63–70. doi: 10.1002/cncr.11054. [DOI] [PubMed] [Google Scholar]
- 50.Moller H. Trends in incidence of testicular cancer and prostate cancer in Denmark. Hum Reprod. 2001;16:1007–11. doi: 10.1093/humrep/16.5.1007. [DOI] [PubMed] [Google Scholar]
- 51.Bray F, Richiardi L, Ekbom A, et al. Do testicular seminoma and nonseminoma share the same etiology? Evidence from an age-period-cohort analysis of incidence trends in eight European countries. Cancer Epidemiol Biomarkers Prev. 2006;15:652–8. doi: 10.1158/1055-9965.EPI-05-0565. [DOI] [PubMed] [Google Scholar]
- 52.Baade P, Carriere P, Fritschi L. Trends in testicular germ cell cancer incidence in Australia. Cancer Causes Control. 2008;19:1043–9. doi: 10.1007/s10552-008-9168-z. [DOI] [PubMed] [Google Scholar]
- 53.Richiardi L, Bellocco R, Adami HO, et al. Testicular cancer incidence in eight northern European countries: secular and recent trends. Cancer Epidemiol Biomarkers Prev. 2004;13:2157–66. [PubMed] [Google Scholar]
- 54.Sincic N, Kulis T, Znaor A, et al. Time trends in testicular cancer in Croatia 1983-2007: rapid increases in incidence, no declines in mortality. Cancer Epidemiol. 2012;36:11–5. doi: 10.1016/j.canep.2011.09.010. [DOI] [PubMed] [Google Scholar]
Associated Data
This section collects any data citations, data availability statements, or supplementary materials included in this article.


