

Abstract
Introduction:
According to the 2010 estimates by the World Health Organization, nearly 285 million (4.24% of total population) people of all ages worldwide are visually impaired. Almost 18.9 million children under 15 years of age are visually impaired globally. In developing countries, 7%–31% of childhood blindness and visual impairment is avoidable.
Materials and Methods:
The study was conducted as a cross-sectional study among 1884 school students in Puducherry, in the age group of 10–14 years. A child with presenting maximum vision ≤6/12 Snellen equivalent in the better eye is considered visually impaired. Data were entered in Microsoft Excel 2013 and analyzed using the statistical software SPSS version 21.0. Chi-square test was applied for testing difference in proportion and a P < 0.05 was considered statistically significant.
Results:
The overall prevalence of visual impairment (vision ≤6/12) among the study participants was 6.37% (95% confidence interval = 5.27–7.47). The prevalence of visual impairment increased with age and it was found to be high among male students (6.6%) when compared to female students (6%). Presenting vision of 6/6 was observed in 79.8% of the children while with pinhole correction, the proportion increased to 94.6%.
Conclusion:
The prevalence of visual impairment in our study population was found to be 6.37% and the prevalence was even higher among children who belonged to schools of urban region or private schools. Children with a positive family history of spectacle use were more likely to have visual impairment.
Keywords: Myopia, refractive error, school children, visual impairment
Introduction
According to the 2010 estimates by the World Health Organization (WHO), nearly 285 million (4.24% of total population) people of all ages worldwide are visually impaired and 39 million are blind. Furthermore, 90% of world's visually impaired live in developing countries and 21.9% of the world's visually impaired are in India. Almost 18.9 million children under 15 years of age are visually impaired globally.[1] In developing countries, 7%–31% of childhood blindness and visual impairment is avoidable, 10%–58% is treatable, and 3% to 28% is preventable.[2] Less developed countries have more avoidable causes of visual impairment compared to the unavoidable congenital causes in developed countries.[3,4,5,6] Myopia being the most common cause of visual impairment among children, its prevalence is found to be high among children of Asian origin.[7] Visual acuity < 6/18 is considered visual impairment among adults; however, for children, the WHO recommends binocular vision ≤6/12 is considered statistically significant. The WHO also recommends the priority age group for vision screening as 11–15 years.[8] As on 2004, 1.6 million children in the age group of 5–15 years are visually impaired due to uncorrected refractive error.[9] It is estimated that there were 1.7 billion myopes in 2010 and by the year 2020, there will be 2.2 billion.[10] The resources and infrastructure for eye care services in India are much below the actual requirement. Estimated average coverage of refractive services for the age group 5–15 years for rural areas in India is 30% (which is the lowest of all regions of WHO) and it is 55% for urban areas. Furthermore, high proportion of people who could have benefited from eye care services were not using the available services.[11] Blind or visually impaired children are economically unproductive and they also consume 10% of the time of an economically productive member of their family. I$ 269 billion (GDP) each year is the global cost in “lost productivity” on account of avoidable distant vision impairment and for the Southeast Asian region, it is I$ 44.5 billion.[12] In 1995, the WHO launched Global School Health Initiative to improve health status of the students.[13] The WHO recommends screening for vision problems and providing refractive services to children at school along with other health issues.[8] School eye screening program was introduced under NPCB in 1994 in India. Despite the importance of uncorrected refractive error as a cause of visual disability in children, little published research in India has focused on exploring the possible risk factors for refractive error. Furthermore, data on prevalence, distribution, and determinants of refractive error are needed to plan and provide better eye care services so as to reduce visual impairment among children. The present study was carried out to measure the prevalence of visual impairment among 10–14-year-old school students in Puducherry, South India.
Materials and Methods
The study was conducted as a cross-sectional study in Puducherry, a union territory in South India, among 1884 school children belonging to the age group of 10–14 years. The study was conducted during January 2014 to October 2015. The minimum required sample size was calculated to be 1463 based on the prevalence of visual impairment (≤6/12) of 6.4%,[14] with the relative precision of 20%. There are 173 high and higher secondary schools in Puducherry, of which 100 are in urban areas and 73 are in rural areas. Out of 173 schools in Puducherry,[15] five schools were selected by stratified random sampling, using lottery method (1 urban private +1 urban government +1 rural private +2 rural government). To achieve the required sample size, a minimum 400 students was planned to be selected from each of the schools; however, all the eligible students in the schools were included in the study. Number of students studying in the rural government school was less than 400, so another closest government school was also included in the sampling frame. All the students in the selected schools were included in the study for interview and examination. Children who are enrolled but discontinued from school are excluded from the study. Subsequent visits are made in the next 2 consecutive days to include the students who were absent to school on the day of data collection and for the students who forgot to get the consent forms signed from their parent/guardian. Distant vision was tested using Snellen's chart and color vision was tested using pseudoisochromatic plates (17) of Ishihara's chart. The Institute ethics committee clearance was obtained before starting the study. Permission was obtained from the education department before the study was started. Principals of the selected schools were approached and permission was obtained from the school principals/head masters for carrying out the study on selected dates given by the school management. Participant information sheet, consent form, and assent forms were distributed to the students 2 days before date of data collection and the students were asked to obtain consent from their parents. A child with presenting maximum vision ≤6/12 Snellen equivalent in the better eye is considered visually impaired. Students who watch television (TV) for at least 1 h a day for at least 5 days in a week or those who watch at least 5 h in a week are classified as “Watching TV.” Games played in digital electronic gadgets such as TV, play station, computer/laptop, handheld gaming devices, and mobile phones are considered video games. Activities done at a closer distance from the eyes such as reading, writing, drawing, embroidery works, and fine arts are considered near work activities. Data were entered in Microsoft Excel 2013 and analyzed using the statistical software SPSS version 21.0 (IBM, New York, USA). Chi-square test was applied for testing difference in proportion and a P < 0.05 was considered statistically significant [Figure 1].
Figure 1.
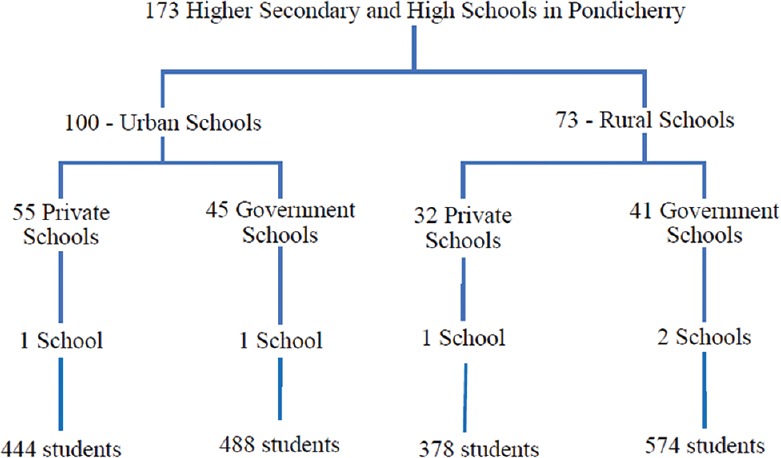
Schematic representation of sampling frame
Results
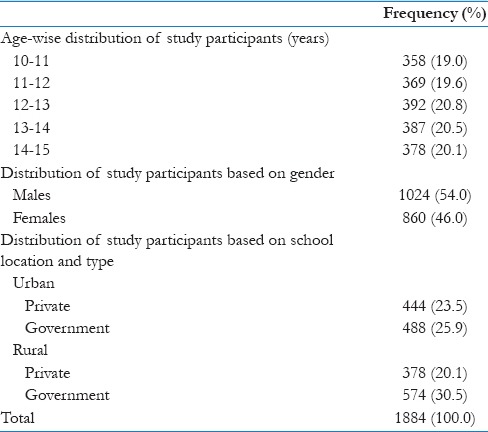
The study population was evenly distributed among different age group, gender, and type of school in which the students were studying [Table 1].
Table 1.
Distribution of study participants based on sociodemographic characteristics
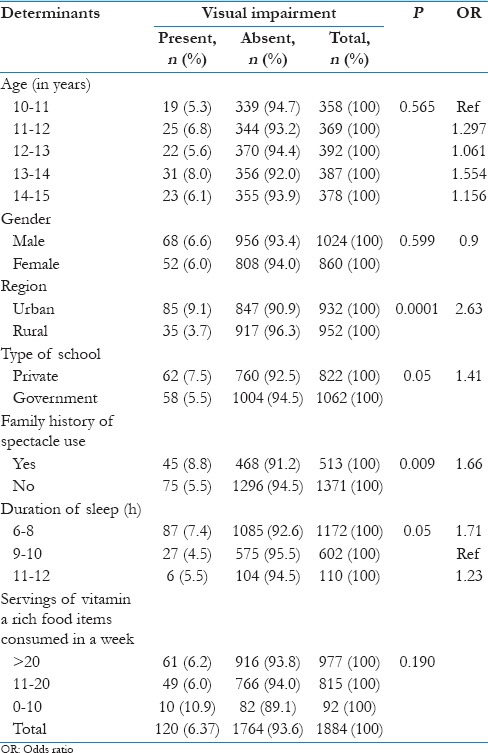
The overall prevalence of visual impairment (vision ≤6/12) among the study participants was 6.37% (95% confidence interval [CI] =5.27–7.47). The prevalence of visual impairment increased with age and it was found to be high among male students (6.6%) when compared to female students (6%). However, both of the above observations were not statistically significant. The prevalence of visual impairment was found to be significantly high among the students who belonged to private schools (7.5%) and schools in urban regions (9.1%) when compared to government schools and rural region, respectively. Furthermore, students with positive family history of spectacle use were observed to have a significantly higher prevalence (8.8%) [Table 2].
Table 2.
Association between visual impairment and selected sociodemographic determinants (n=1884)
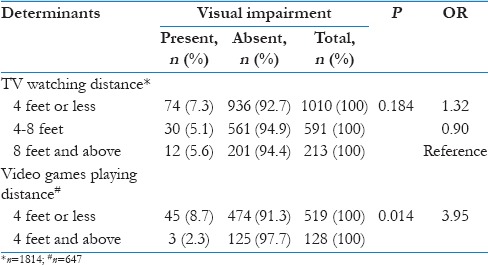
Similarly, higher prevalence was also observed in students who are not playing outdoor games, watching TV, playing video games, using computers/laptops, and involved in near work activities for more than 3 h were observed to have a higher prevalence of visual impairment although the difference was not statistically significant. A higher number of children with visual impairment were below average in their (self-reported) academic performance [Table 3]. Children who play video games at a closer distance (<4 feet) from digital screens are found to have visual impairment (P = 0.01), also higher proportion of children were visually impaired who watch TV at a closer distance (<4 feet) although this association was not statistically significant [Table 4].
Table 3.
Association between visual impairment and selected determinants (n=1884)
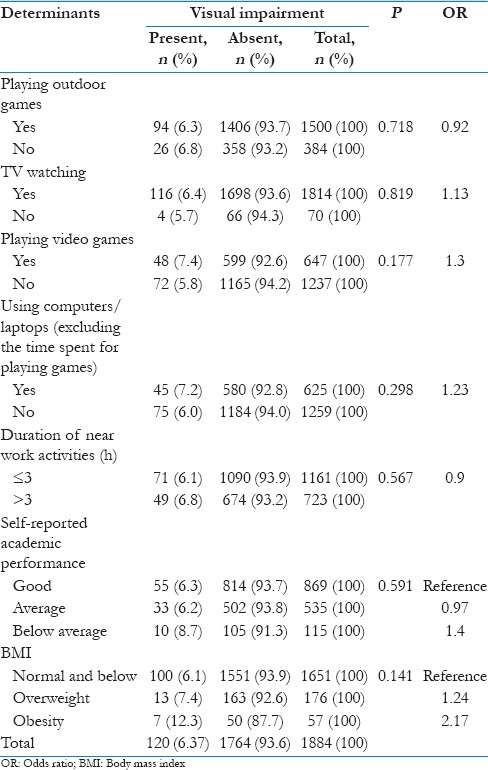
Table 4.
Association between digital screen usage distance and visual impairment
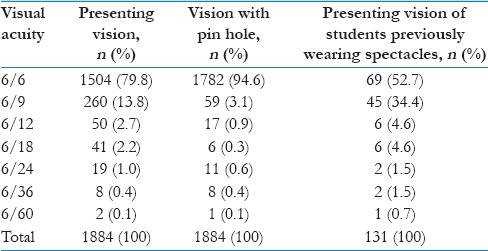
Presenting vision of 6/6 was observed in 79.8% of the children while with pinhole correction, the proportion increased to 94.6%. Presenting vision of the children who were already wearing spectacles at the time of examination showed that only 52.7% of them had a vision of 6/6 while the remaining children remain under corrected [Table 5].
Table 5.
Distribution of study participants based on their presenting maximum distant vision
Discussion
In our study, the prevalence of visual impairment was found to be 6.37% (95% CI = 5.27–7.47), visual impairment was significantly high among the students studying in urban schools (9.1%), when compared to the students in rural schools (3.7%). Family history of spectacle use was found to be significantly associated with visual impairment among the school students. Visual impairment was high among the children (8.7%) who were playing video games at a distance of 4 feet or less.
Krishnamurthy et al.[16] also reported a similar prevalence of 6.5% in a study conducted at Mysore. Murthy et al.[17] in a study done at Andhra Pradesh observed the prevalence of visual impairment of 6.7% in right eyes and 6.5% in left eyes which was similar to the results of the present study. A positive association between age and visual impairment due to myopia was observed in most of the studies. Kishore et al.[18] in a study among school children in Uttarakhand observed a higher prevalence in older age groups; however, in the present study, this association was not statistically significant. Bhatt[19] in a study among school students aged 7–15 years in Ahmedabad showed that the prevalence of myopia (vision < 6/12) was significantly high among urban region (15.9%) when compared to rural region (4.1%). Krishnamurthy et al.[16] (2014) also found a significantly higher prevalence of uncorrected refractive error among urban school children when compared to students of rural schools. The results of the above studies were consistent with that of the present study. While regarding the type of school to which the children belonged to Prasanna Kamath et al.[20] in their study among 1300 rural school children in Karnataka in the age group of 6–15 years found that the prevalence of refractive error was high among private school children (6.5%) when compared to the student who belonged to government schools (4.7%), which were similar to the present study results. Mutti et al.[21] study presented that children with myopia spent more time in near work activities and less time in sports compared with emmetropes. However, watching TV, playing video games, or working on computer did not differ between myopes and emmetropes. The above observations were comparable to the results of the present study. Kalikivayi et al.[22] reported that the prevalence of visual acuity of < 6/60 was 0.5% and Murthy et al.[14] reported in their study as 0.47% while in the present study, it was found to be 0.1% [Table 4]. In a study by Khan et al.,[23] it was observed that 71.32% of the children had a vision of 6/6 which was in the lower side when compared to 79.8% as observed in the present study [Table 5], while Basu et al.[24] reported a similar prevalence of 84.78% in their study done in Surat.
Strengths of our study include that schools representing all the regions (urban/rural) and school types (private/government) were studied, various possible determinants were studied, and significant number of children with visual impairment was newly diagnosed and referred to an ophthalmologist for refraction. Our study limitations are a relatively small sample was studied because of which all the determinants could not be studied; however, the primary objective of the study was to measure the prevalence. Refraction was not done to the students because of nonfeasibility. Further large-scale analytical studies may be required to establish strong evidence regarding the etiology and determinants of visual impairment.
Conclusion
The prevalence of visual impairment in our study population was found to be 6.37% and the prevalence was even higher among children who belonged to schools of urban region or private schools. Children with a positive family history of spectacle use were more likely to have visual impairment. The prevalence of visual impairment increased as the age of the child advanced.
Financial support and sponsorship
Nil.
Conflict of interest
There are no conflicts of interest.
Acknowledgment
We would like to extend their gratitude to the Education Department, Government of Puducherry, School Administration, and all the students who participated in the study.
References
- 1.Pascolini D, Mariotti SP. Global estimates of visual impairment: 2010. Br J Ophthalmol. 2012;96:614–8. doi: 10.1136/bjophthalmol-2011-300539. [DOI] [PubMed] [Google Scholar]
- 2.Kong L, Fry M, Al-Samarraie M, Gilbert C, Steinkuller PG. An update on progress and the changing epidemiology of causes of childhood blindness worldwide. J AAPOS. 2012;16:501–7. doi: 10.1016/j.jaapos.2012.09.004. [DOI] [PubMed] [Google Scholar]
- 3.de Carvalho KM, Minguini N, Moreira Filho DC, Kara-José N. Characteristics of a pediatric low-vision population. J Pediatr Ophthalmol Strabismus. 1998;35:162–5. doi: 10.3928/0191-3913-19980501-09. [DOI] [PubMed] [Google Scholar]
- 4.DeCarlo DK, Nowakowski R. Causes of visual impairment among students at the Alabama school for the blind. J Am Optom Assoc. 1999;70:647–52. [PubMed] [Google Scholar]
- 5.Du JW, Schmid KL, Bevan JD, Frater KM, Ollett R, Hein B. Retrospective analysis of refractive errors in children with vision impairment. Optom Vis Sci. 2005;82:807–16. doi: 10.1097/01.opx.0000178061.88598.9b. [DOI] [PubMed] [Google Scholar]
- 6.Gothwal VK, Herse P. Characteristics of a paediatric low vision population in a private eye hospital in India. Ophthalmic Physiol Opt. 2000;20:212–9. [PubMed] [Google Scholar]
- 7.Pan CW, Ramamurthy D, Saw SM. Worldwide prevalence and risk factors for myopia. Ophthalmic Physiol Opt. 2012;32:3–16. doi: 10.1111/j.1475-1313.2011.00884.x. [DOI] [PubMed] [Google Scholar]
- 8.WHO. Elimination of Avoidable Visual Disability Due to Refractive Errors: Report of an Informal Planning Meeting, Geneva, 3-5 July, 2000. Geneva: WHO; 2000. [Google Scholar]
- 9.Resnikoff S, Pascolini D, Mariotti SP, Pokharel GP. Global magnitude of visual impairment caused by uncorrected refractive errors in 2004. Bull World Health Organ. 2008;86:63–70. doi: 10.2471/BLT.07.041210. [DOI] [PMC free article] [PubMed] [Google Scholar]
- 10.Holden B, Davis S, Jong M, Resnikoff S. The evolution of uncorrected refractive error as a major public health issue. Journal and Proceedings of the Royal Society of New South Wales. 2014;147:453–4. [Google Scholar]
- 11.Fletcher AE, Donoghue M, Devavaram J, Thulasiraj RD, Scott S, Abdalla M, et al. Low uptake of eye services in rural India: A challenge for programs of blindness prevention. Arch Ophthalmol. 1999;117:1393–9. doi: 10.1001/archopht.117.10.1393. [DOI] [PubMed] [Google Scholar]
- 12.Smith TS, Frick KD, Holden BA, Fricke TR, Naidoo KS. Potential lost productivity resulting from the global burden of uncorrected refractive error. Bull World Health Organ. 2009;87:431–7. doi: 10.2471/BLT.08.055673. [DOI] [PMC free article] [PubMed] [Google Scholar]
- 13.Bhalwar R. Textbook of Public Health and Community Medicine. 1st ed. Pune: Armed Forces Medical College; 2000. [Google Scholar]
- 14.Murthy GV, Gupta SK, Ellwein LB, Muà±oz SR, Pokharel GP, Sanga L, et al. Refractive error in children in an urban population in New Delhi. Invest Ophthalmol Vis Sci. 2002;43:623–31. [PubMed] [Google Scholar]
- 15.Schools in Puducherry. [Last accessed on 2013 Sep 26]. Available from: https://www.schooledn.puducherry.gov.in/# .
- 16.Krishnamurthy H, Tanushree V, D’Silva AJ. Prevalence of refractive errors among school children of 5-15 years age group in Mysore District. Int J Sci Stud. 2014;2:150–4. [Google Scholar]
- 17.Murthy VK, Prabhu R, Reddy AK, Sridhar MS. A Study on Prevalence of Refractive Errors among 5-16 Years Rural Children in Chandragiri, Chittoor District, Andhra Pradesh. Journal of Evolution of Medical and Dental Sciences. 2014;3:11411–8. [Google Scholar]
- 18.Kishore S, Aggrawal P, Muzammil K, Singh S, Bhaskar Y, Bhaskar R. Ophthalmic Morbidity in School Children in Hilly Areas of Uttarakhand. Indian Journal of Community Health. 2014;26:56–60. [Google Scholar]
- 19.Bhatt JV. Is myopiamore common in urban than rural area? A comparative study. Indian J Appl Basic Med Sci. 2011;13:389–90. [Google Scholar]
- 20.Prasanna Kamath B, Bengalorkar GM, Prasad BG. Comparative study of prevalence of ocular morbidity among school going children of government and private schools in rural Karnataka, South India. Int J Curr Res Rev. 2013;5:69–76. [Google Scholar]
- 21.Mutti DO, Mitchell GL, Moeschberger ML, Jones LA, Zadnik K. Parental myopia, Near Work, school achievement, and children's refractive error. Invest Ophthalmol Vis Sci. 2002;43:3633–40. [PubMed] [Google Scholar]
- 22.Kalikivayi V, Naduvilath TJ, Bansal AK, Dandona L. Visual impairment in school children in Southern India. Indian J Ophthalmol. 1997;45:129–34. [PubMed] [Google Scholar]
- 23.Khan AA, Nasti A, Ayoub D, Lone SA. Prevalence of refractive errors in school children. JK Pract. 2005;12:156–9. [Google Scholar]
- 24.Basu M, Das P, Pal R, Kar S, Desai VK, Kavishwar A. Spectrum of visual impairment among urban female school students of Surat. Indian J Ophthalmol. 2011;59:475–9. doi: 10.4103/0301-4738.86317. [DOI] [PMC free article] [PubMed] [Google Scholar]