Abstract
Purpose
Test–retest variability (TRV) of visual field (VF) data seriously degrades our capacity to recognize true VF progression. We conducted repeated high-resolution perimetry with a test interval of 0.5° to investigate the sources of TRV. In particular, we examined whether the spatial variance of the observed sensitivity changes or if their absolute magnitude was of more importance.
Methods
Sixteen eyes of 16 glaucoma patients were each tested three times at 61 VF locations along the superior-temporal 45° meridian using a modified protocol of the Octopus 900 perimeter. TRV was quantified as the standard deviation of the repeats at each point (retest-SD). We also computed the mean sensitivity at each point (retest-MS) and the running spatial-SD along the tested meridian. Multiple regression models investigated whether any of those variables (and also age, sex, and VF eccentricity) were significant independent determinants of TRV.
Results
The main independent determinants of TRV were the retest-MS at −0.04 dB TRV/dB loss (P < 0.0001, t-statistic 5.05), and the retest-SD at 0.47 dB spatial variance/dB loss (P < 0.0001, t-statistic 12.5).
Conclusions
The larger effect for the spatial-SD suggested that it was perhaps a stronger determinant of TRV than scotoma depth per se. This might support the hypothesis that interactions between small perimetric stimuli, rapidly varying sensitivity across the field, and normal fixational jitter are strong determinants of TRV.
Translational Relevance
Our study indicates that methods that might reduce the effects of jagged sensitivity changes, such as increasing stimulus size or better gaze tracking, could reduce TRV.
Keywords: test–retest variability, high-resolution perimetry, glaucoma
Introduction
Diagnosis of glaucoma depends upon the correspondence between fundus changes and visual field (VF) defects. VF testing is also used to determine the stage of glaucoma for management of the disease. Various perimetric methods have been developed, but at present, standard automated perimetry (SAP) is the mainstream technique for VF testing. Unfortunately, the results of repeated SAP measurements are far from identical. This variability of VF sensitivity has been termed “fluctuation” and was recognized early to be divisible into short- and long-term fluctuation.1 Short-term fluctuation is now more commonly referred to as test–retest variability (TRV). TRV is very problematic because it makes it difficult to separate TRV from true VF progression, even in patients with mean defects declining at 2 dB/year or faster.2
A variety of automated perimeters seem to have very similar TRV, including the Humphrey Field Analyzer (HFA),3 the Octopus (Haag-Streit, Koeniz Switzerland),4 and the Medmont.5 All these devices employ small Goldmann size III stimuli and similar threshold strategies. Interestingly, increasing stimulus size appears to reduce TRV.6,7 Early workers such as Bebie, Frankhauser, and Spahr8 and Flammer, Drance, and Zulauf9 recognized that TRV increases with scotoma depth. These and other observations have suggested two concepts for the main sources of TRV: (1) spatial undersampling of the VF by small stimuli interacting with spatially jagged VF sensitivity profiles and the jitter present in good fixation (SD < 0.6°; compare Maddess,10,11 Morales et al.,12 and Springer et al.13) and (2) noise in the flagging responses of retinal ganglion cells.14 Either or both of these causes of TRV might actually operate in VF testing. This study is designed in part to examine these issues.
The noisy-response hypothesis of Gardiner et al.14 would be determined mainly by scotoma depth alone. By contrast the undersampling hypothesis10,11 would be influenced by scotoma depth and the spatial variability of scotomas. We performed high-resolution perimetry with a 0.5° sampling interval and revealed the correlation between the test point interval and the detectability of the glaucomatous VF defects. We have reported on the high-resolution method but have not reported on the observed TRV.15 To examine these issues, we have produced a high-resolution test protocol on the Octopus 900 (Haag-Streit) perimeter, using the same sampling interval of 0.5°, and then used it to conduct repeat testing of 61 points along the superior-temporal 45° meridian in 16 subjects. We then used multiple regression and other methods to examine the possible independent effects of scotoma depth, spatial variance, eccentricity, and any other factors that might determine TRV.
Subjects and Methods
Subjects
This research study enrolled 16 eyes of 16 patients with glaucoma: mean age (±SD) 63.1 ± 5.9 years; range: 51 to 72 years; 11 females. Nine eyes had primary open angle glaucoma (POAG) and seven had normal tension glaucoma (NTG). Inclusion criteria were age over 50; best corrected visual acuity ≥ 1.0; refractive errors of sphere ≥ −6.0 D [diopter] and ≤ 3.0 D; cylinder ≥ −2.0 D and ≤3 D. The mean spherical equivalent refraction (±SD) was −0.40 ± 2.28 D. A corrective lens was used during perimetric testing. Persons with eye diseases other than glaucoma or a history of ophthalmologic surgery were excluded.
This research protocol was approved by the Human Ethics Committee of Kindai University Faculty of Medicine and adhered to the tenets of the Declaration of Helsinki. Written informed consent was obtained from each subject.
Tests and Analysis
The high-resolution perimetry employing a 0.5° test point interval was implemented on an Octopus 900 perimeter (Haag-Streit). Background luminance was 31.4 apostib (10 cd/m2) and the stimuli were Goldmann Size III. VF sensitivity was measured using the default 4-2 dB bracketing method available on Octopus 900 (Haag-Streit). This bracketing method concludes after two reversals where the last reversal is within 1 dB of the previous result. The starting point is 4 dB above the normative data, which the program interpolates from standard test points when new test grids are programmed. The 61 test points ran from the fixation point to 30° eccentricity, arranged along the superior-temporal 45° meridian (Fig. 1). The motivation for choosing a single meridian was to reduce sources of variance between subjects and to try to keep the test as clinically relevant as possible. Subjects were chosen to have variable levels of damage along the meridian so that overall the effects of eccentricity were minimized/controlled. Testing a single meridian at 0.5° intervals produced 61 points, making the test duration about the same as the clinical standard. Also, another major study of sources of retest variability by Henson et al.16 tested along the 45, 135, 225, and 315 meridians at 12.7° eccentricity. We did not attempt to control fixational jitter in order to keep the test conditions as close as possible to those used in the clinic. The sets of 61 points were measured three times in each subject. As in standard field tests, the location of the stimuli was randomized (along the meridian) to minimize the ability of the subject to anticipate.
Figure 1.
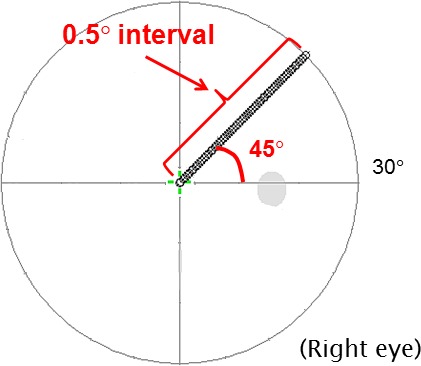
We used a custom Octopus 900 test to perform high-resolution perimetry. Sixty-one points were measured at an interval of 0.5° along the superior-temporal 45° meridian, from the fixation point up to an eccentricity of 30°. Sensitivity was measured three times for each subject. The mean sensitivity, retest-MS, the retest-SD, and the spatial-SD along the meridian were calculated for each subject.
We then calculated the mean sensitivity of the three test measurements (retest-MS), and its standard deviation (retest-SD) for each subject at each VF point. The retest-SD quantified the TRV, and we use the terms somewhat interchangeably.
We also calculated the spatial sensitivity SD (spatial-SD), which was used to examine whether the TRV was affected by the variability of spatial sensitivity change along the meridian (Fig. 2). The spatial-SD was computed as the standard deviation of consecutive sets of five test points in the retest-MS. The sets of five points consisted of a given measuring point and its two immediate neighboring points on either side. For example, in Figure 2 the spatial-SD of the central measuring point of the retest-MS (red arrow) was calculated from the retest-MS using the five test points enclosed by the red box. The spatial-SD for each retest-MS point was thus computed using a moving window from the fixation point to the eccentricity of 30°. To ensure that there were 61 points in the spatial-SD profile, we reflected the two points at either end of the retest-MS record before computing the running SD. Earlier studies have pointed out that small sample numbers will tend to underestimate variance.17,18 By setting the spatial window to five points, we ensured that the underestimation of the spatial and repeat variance was similar. We also examined narrower and wider moving windows and other standard methods for dealing with the end points, and none of these changed the outcomes reported here.
Figure 2.
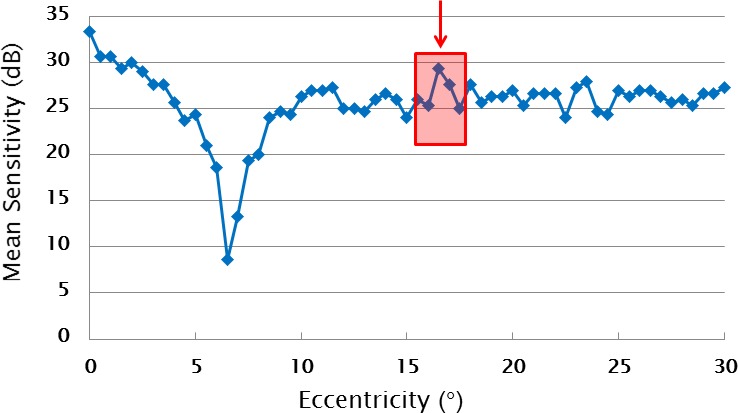
This graph shows an example of a retest-MS sensitivity profile. We introduced the concept of the spatial sensitivity SD, which we termed the spatial-SD. The spatial-SD was calculated from the sensitivity of running sets of five consecutive measuring points. The five points consist of a given measuring point and its two immediate neighboring points on both sides, as illustrated by the red box for the point selected by the arrow.
The spatial-SD is small where the sensitivity change fluctuates gently across the field. By contrast the spatial-SD is larger in areas where the sensitivity change of the five consecutive test points fluctuates rapidly across the field, which might lead to sampling errors due to small stimuli interacting with normal fixational errors and jagged VF sensitivity profiles. Normal fixational jitter typically has a SD of 0.6°12,19 and is thus comparable to our sampling interval. Notice that the spatial-SD can be independent of the scotoma depth.
We then used a range of methods to examine whether the TRV (retest-SD) is affected by any or all of the VF eccentricity, retest-MS, retest-SD, or the spatial-SD. In particular, we formed multiple regression models to determine which independent variables most strongly affect TRV. Those models were also adjusted for age and sex. The reference condition (intercept) for these models was thus the mean retest-SD for males of the mean age of 63 years.
Most of the analyses were done in using statistical analysis software (Matlab ver. 2014b; Mathworks, Natick, MA), and the principle curve analysis was done in R (free software from the Project for Statistical Computing).
Results
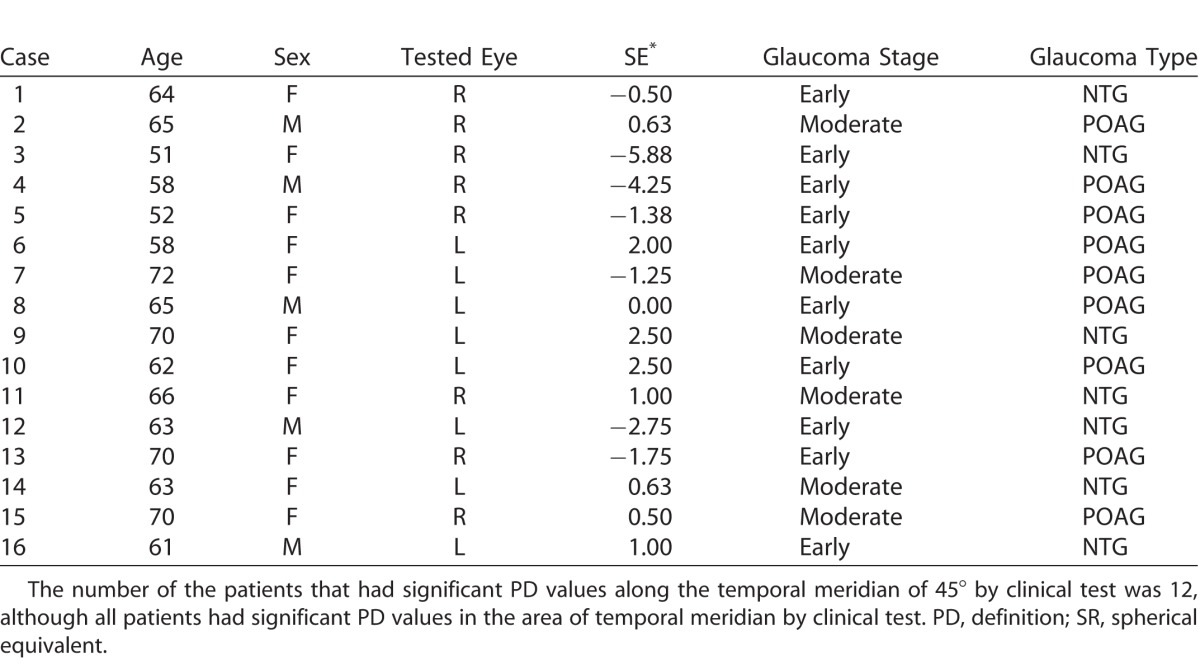
The visual field (VF) characteristics of the glaucoma patients is given in Table 1.
Table 1.
VF Characteristics of the Glaucoma Patients
To illustrate the issues and methods we present Case 1, a 62-year-old woman with POAG who had a superior nasal step defect as shown in Figure 3. High-resolution perimetry was performed along the 45° meridian indicated by the yellow lines. The retest-MS at each test point of this case is shown in blue, and the fluctuation and the spatial-SD in red and green in Figure 3. The standard HFA report presented only one point with significant sensitivity loss near our test meridian. The high-resolution perimetry revealed the deep sensitivity loss at the same area as the HFA result. This case showed increased sensitivity fluctuation between eccentricities of 5° to 8°.
Figure 3.
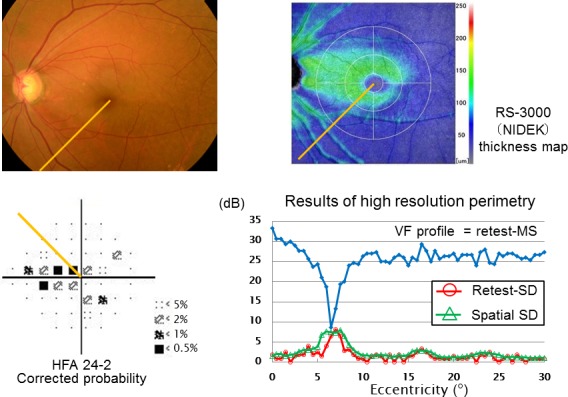
This exemplary case was a 62-year-old female with early stage of POAG. We performed high-resolution perimetry along the meridian indicated in yellow. In this graph, the VF profile had deep and narrow sensitivity loss at the same area that was reported by the standard HFA test. At the area of the eccentricity of 5° to 8°, the retest-SD (TRV) and spatial-SD increased locally.
Figure 4 illustrates a range of examples from three subjects illustrating how retest-MS (Fig. 5A) can compare to retest-SD (Fig. 5B). The cases shown in red or green revealed localized sensitivity loss at near fixation, and here the corresponding retest-SD also increased (red and green arrows). The blue retest-MS profile showed a gradual sensitivity decline with increasing eccentricity but high retest-SD in places (blue arrow).
Figure 4.
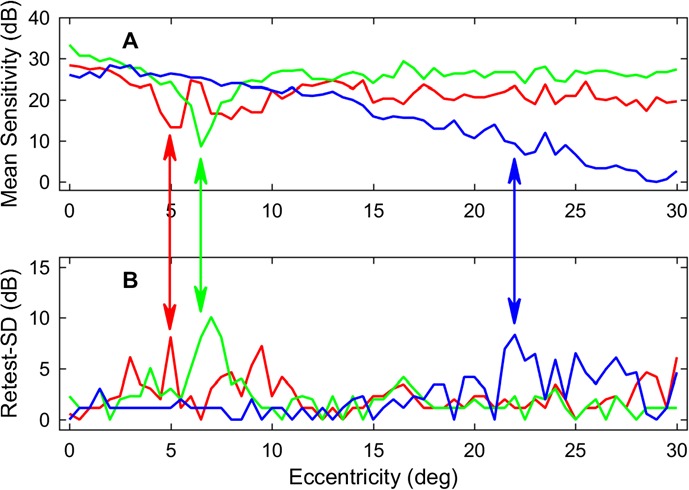
Comparison of mean sensitivity (A; retest-MS) and TRV (B; retest-SD) for three subjects. This suggests that the TRV is influenced by the retest-MS. Some cases showed increases of the TRV in accordance with localized low-sensitivity areas such as the cases shown in red or green. The case shown in blue had a larger TRV in the area where the retest-MS was low.
Figure 5.
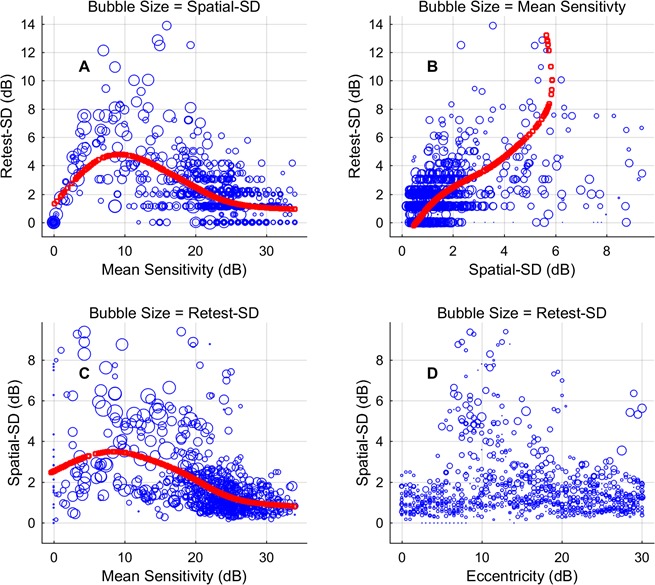
These bubble plots show the relationship between the TRV (retest-SD) and the retest-MS, spatial-SD, and VF eccentricity. Each plot shows the relationship between three variables, the third indicated by the size of the blue circles (bubbles; note the title of each panel). Both the retest-MS and spatial-SD were strongly correlated with the TRV (see Results). Nevertheless, it is clear that several of the relationships are not linear. The red curves are the principle curves about which the data vary most. (A) The retest-SD has a very nonlinear relationship with retest-MS, going to 0 as sensitivity goes to 0. (B) The relationship between spatial-SD and retest-SD is quite linear up to large values, but the small number of squares indicates that the curve for those values is based on few points. (C) The relationship between retest-MS and spatial-SD is relative linear down to 10 dB. (D) Retest-SD and spatial-SD can be large at any eccentricity.
Figure 5 shows scatter plots examining relationships between retest-SD, retest-MS, spatial-SD, and VF eccentricity. Each plot summarizes relationships between three variables, using bubble size to indicate the third variable. The retest-SD was well correlated with the retest-MS (Fig. 5A, r = −0.342, P < 0.0001) and spatial-SD (Fig. 5B, r = 0.452, P < 0.0001). Retest-MS was also well correlated with spatial-SD (Fig. 5C, r = −0.420, P < 0.0001). Eccentricity was not significantly correlated with spatial-SD (Fig. 5D) or retest-SD (not shown). In Figures 5A to 5C, the red plots are the principle axes of variation as determined by principle curvature analysis. That is to say, the data mainly vary approximately equally in directions perpendicular to the principle axis, effectively the best-fitting spine of the scatter plot. The method has been used to compare results of different perimeters to see if there is a linear relationship between the results.20,21 It is suitable when two variables are not in a dependent and independent variable. Although there is often significant correlation between the variables here, it is clear that there is a nonlinear relationship between some (especially Fig. 5A).
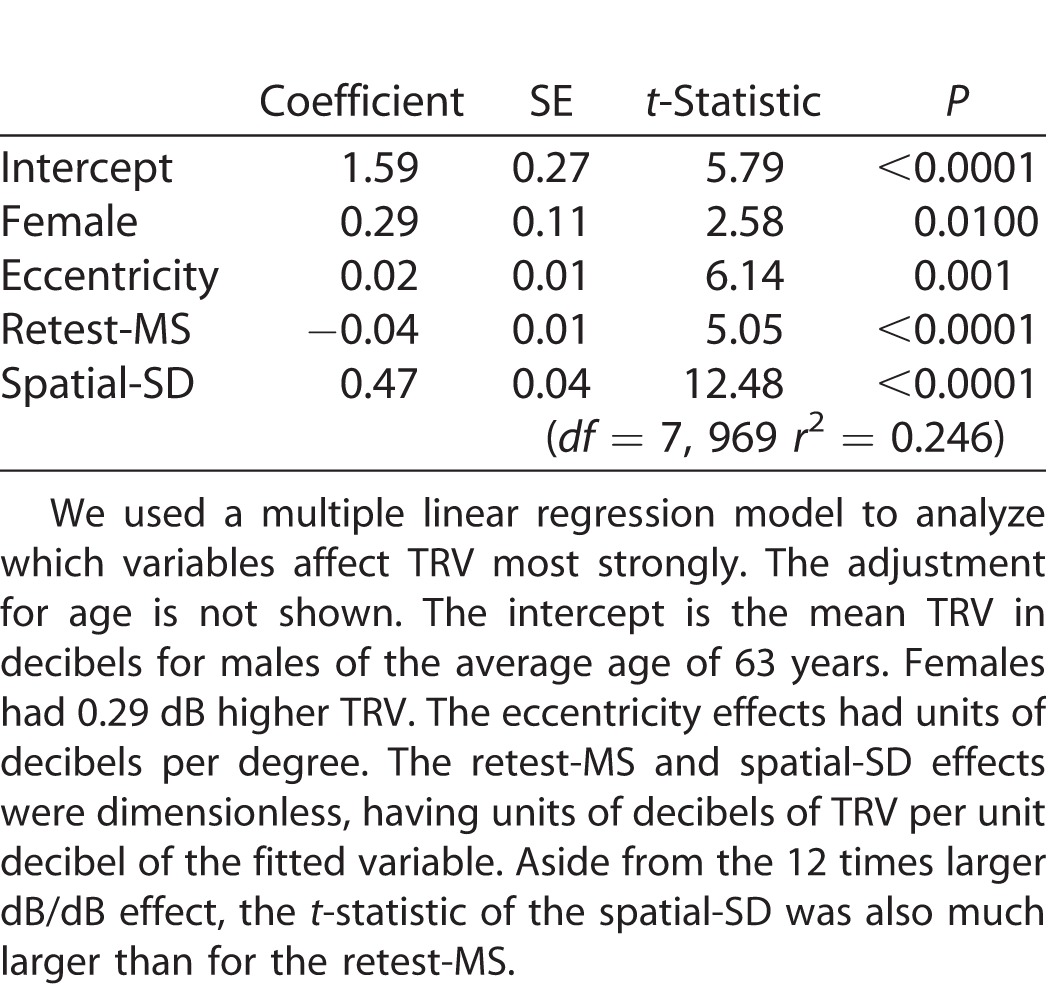
Table 2 shows the results of multiple regression analysis indicating the variables influencing the TRV. TRV was strongly influenced by the retest-MS (t-value: 5.05) and spatial-SD (t-value: 12.48). The larger t-statistic for the spatial-SD result suggested that the spatial-SD exerted stronger effect size on the TRV than the retest-MS itself. It is important to note that the multiple regression analysis estimated the independent effects of retest-MS and spatial-SD on the TRV. The spatial-SD effect was 11.8 times larger than that for retest-MS.
Table 2.
Multiple Linear Regression Analysis of the Independent Sources of TRV
Discussion
Automated perimetry is commonly used to judge the progression of glaucoma in patients. It is critical to discern whether any apparent sensitivity decline is caused by pathologic events or only TRV.2 First, we examined the association of the retest-MS and the retest-SD. The TRV was small within the normal range of the sensitivity, and the fluctuation was great at the testing points where sensitivity was low (Figs. 3–5). As the sensitivity approached zero, the TRV became small again (Fig. 5A). Figure 5A shows an overall trend of the fluctuation in a mountain-like shape; that is, gradually rising to the midway and falling afterward. This is a commonly reported result independent of perimeter type or test-pattern layout, indicating that TRV rises as sensitivity falls until eventually it begins to decline once there is next to no response.3–5,22
Some very narrow scotomas approximately 2° to 3° wide were implied by some of the sensitivity profiles shown here (e.g., Figs. 2–4). Airaksinen and Heijl23 also reported similar narrow, deep defects when they used fine-grained VF sampling. Such results have been reported for 1° sampling of small patches of the retina.24,25 An analysis of 512 SAP 10-2 VFs showed a strong signal at 0.25 cpd (VF defects on a scale of about 4°) within glaucomatous VFs produced by jagged sensitivity profiles or sharp scotoma borders.10 Thus, it would seem that the normal 6°-sampling coupled with Goldmann size III, which samples <0.5% of the tested field area, and normal fixational jitter may contribute significantly to TRV.10,11 Several studies suggest that larger stimuli may reduce TRV.6,7,10,11 A complication may be that larger stimuli might increase scattered light. This might be ameliorated by the use of a higher background luminance as used, for example, in the FDT/Matrix perimeters.
Källmark et al.26 used microperimetry and scanning laser ophthalmoscopy to measure fixational movements of normal individuals and reported that the SD in normal fixational movements was about 0.27°. Other similar studies report normal fixational jitter with SDs between 0.6° and 1.0°.12,13 These normal eye movements have been suggested to exacerbate TRV due to displacement of small perimetry stimuli relative to fine-grained fluctuations in VF sensitivity across the field.10,11 The finding that spatial-SD was a strong determinant of TRV suggests that fixational jitter is an important component of TRV (Fig. 5 and Table 2). Indeed, once its effects were accounted for, the independent effect of scotoma depth (retest-MS) was 12 times smaller (Table 2). That effect is further exacerbated if those sensitivity fluctuations are large or sharp. The normal finding that scotoma depth was also a strong determinant of TRV also means that the noisy retinal ganglion cell hypothesis cannot be ruled out.14 Probably both contribute to TRV.
If the interaction between rapidly changing scotoma sensitivity across space and normal fixational jitter are an issue, then stabilizing gaze should reduce test variability. Two reports examined the effects of active stabilization of gaze.25,29 One of the studies examined the change in variability for the stabilized and nonstabilized cases for a point near the blind spot, where the change in sensitivity across space appears to be slow.30 There was no change for stabilized viewing, which is in agreement with the published models of the effects of small fixation jitter when spatial variance is small.10,11 When a pathologic field defect was examined, the changes were larger. The second study mainly examined one central field defect caused by a cortical lesion. It tested the defect with a two-dimensional grid of 60 points at 1° resolution.25 The log thresholds changed by an average of 55% (±49% SD), becoming sharper and denser with stabilization. Henson and Bryson29 examined variability as a function of the number of sharp edges in the fields of 90 glaucoma patients and concluded that “a significant proportion of the variability seen in patients with glaucoma is the result of fixation inaccuracy.” Another large study by this group rules out factors such as fixation loss rate (i.e., large fixation errors), age, eccentricity, and false-positive rate as sources of variability. While good fixation has jitter of about 0.6°, Demirel and Vingrys30 showed that average VF tests have more than 60 gaze shifts of between 1° and 3°.
Fixation can also be affected by microsaccades. Engbert and Kliegl31 reported that microsaccades can be up to 2° in amplitude. Microsaccades are essential for visual perception of objects; however, VF measurement could be affected if fixation changes by 2° during VF testing. This would be most important for the central VF as occurs with the SAP 10-2 test pattern with its 2° interval sampling within the central 10°. At present, no perimeters can accurately monitor microsaccades; however, accurate measurement of microsaccades will be indispensable when the central VF becomes the subject of investigation. It has been shown that the frequency of gaze-tracking errors of between 3° and 5° are excellent predictors of TRV in 10-2 perimtery.32 The same errors in 24-2 perimetry are reported to be predictive of retinal structural parameters such as retinal nerve fiber layer thickness.33
Although retest-SD appears to be a bigger determinant of TRV than retest-MS (12 times), it is not the whole story. The linear model of Table 2 accounts for only 24.7% of the variance in the retest-SD (TRV). This will in part be due to noise in the retest-SD data; humans are unreliable. Underestimation of retest-SD (and spatial-SD) due to the small number of repeats available might also be a factor (see Subjects and Methods). Another potentially large issue is that the measured profiles are one-dimensional, while fixational jitter is two-dimensional, so spatial-SD along a line may over- or underestimate the relevant spatial variance. Given the outcome, however, one large source of unexplained variance is likely to be the jitter in normal fixation, what we might call jitter-SD. Two modeling studies indicate that the normal jitter during good fixation (with SD of about 0.6°) interacting with the spatial variance of field defects could explain much of the observed TRV.10,11 If this jitter-SD is not very different between the subjects, then spatial-SD is a good proxy for the combination of spatial-SD and jitter-SD. Redoing the current study with a microperimeter to obtain data on jitter-SD could test this hypothesis. Another factor we did not consider is fatigue. Henson et al.34 have shown that fatigue can be objectively estimated from pupillary “fatigue waves.” Another possible factor is circadian effects. It has been reported that TRV in glaucoma patients varies over normal office hours, possibly being greatest around 2:00 (Pearce JG. IOVS. 2016;57:ARVO E-Abstract 4228).
We also explored the explanatory power of some other covariates in the linear model. One that reached near significance was the slope in the retest-MS. Using the square root of eccentricity was slightly better than eccentricity. Other functions of eccentricity such as ganglion cell density or ganglion cell spatial-sampling rate performed about the same as eccentricity. Expanding the data set to include more repeats, more subjects, and variables such as jitter-SD and pupillary fatigue waves might allow the effects of these variables to be correctly assessed. We do not feel that more complex models are justified at this point. Nevertheless, the present results represent a significant increase in the amount of data available on high-resolution analysis of glaucomatous scotomas. A larger number of subjects and perhaps two-dimensional determination of spatial-SD would improve future studies of the sources of TRV.
In conclusion, TRV in general perimetry is strongly influenced by the spatial-SD, implying a strong effect of small-scale sensitivity changes such as those found at the edge of the scotoma. Scotoma depth is also an important determinant. Other factors such as the two-dimensional structure of scotomas, fatigue, and fixational jitter need to be considered to advance this topic.
Acknowledgments
Ted Maddess was supported by the Australian Research Council through the ARC Centre of Excellence in Vision Science (CE0561903).
In the interest of full disclosure we wish to mention that Maddess previously received royalty income from Carl Zeiss Meditec for the sale of the FDT/Matrix perimeters, but those royalties have now ceased, and this paper did not use those devices. Maddess and colleagues are also attempting to develop an objective perimeter.
The disclosures listed for that potential product are F, I, P, S, all to nuCoria Pty Ltd.
Disclosure: T. Numata, nuCoria Pty Ltd. (F, I, P, S); T. Maddess, Carl Zeiss Meditec (R); nuCoria Pty Ltd. (F, I, P, S); C. Matsumoto, nuCoria Pty Ltd. (F, I, P, S); S. Okuyama, nuCoria Pty Ltd. (F, I, P, S); S. Hashimoto, nuCoria Pty Ltd. (F, I, P, S); H. Nomoto, nuCoria Pty Ltd. (F, I, P, S); Y. Shimomura, nuCoria Pty Ltd. (F, I, P, S)
References
- 1. Flammer J. . Fluctuation in the visual field. : MD, Stephan Anderson DR, . Automatic Perimetry in Glaucoma: A Practical Guide. Orlando, FL: Grune & Statton; 1985: 161– 173. [Google Scholar]
- 2. Chauhan BC, Garway-Heath DF, Goni FJ,et al. . Practical recommendations for measuring rates of visual field change in glaucoma. Br J Ophthalmol. 2008; 92: 569– 573. [DOI] [PMC free article] [PubMed] [Google Scholar]
- 3. Artes P, Iwase A, Ohno Y, Kitazawa Y, Chauhan B. . Properties of perimetric threshold estimates from full threshold, SITA Standard, and SITA Fast Strategies. Invest Ophthalmol Vis Sci. 2002; 43: 2654– 2659. [PubMed] [Google Scholar]
- 4. Piltz JR, Starita RJ. . Test-retest variability in glaucomatous visual fields. Am J Ophthalmol. 1990; 109: 109– 111. [PubMed] [Google Scholar]
- 5. Pearce JG, Maddess T. . Retest variability in the Medmont M700 automated perimeter. Optom Vis Sci. 2016; 93: 272– 280. [DOI] [PubMed] [Google Scholar]
- 6. Wall M, Woodward KR, Doyle CK, Artes PH. . Repeatability of automated perimetry: a comparison between standard automated perimetry with stimulus size III and V, matrix, and motion perimetry. Invest Ophthalmol Vis Sci. 2009; 50: 974– 979. [DOI] [PubMed] [Google Scholar]
- 7. Chauhan BC, Johnson CA. . Test-retest variability of frequency-doubling perimetry and conventional perimetry in glaucoma patients and normal subjects. Invest Ophthalmol Vis Sci. 1999; 40: 648– 656. [PubMed] [Google Scholar]
- 8. Bebie H, Frankhauser F, Spahr J. . Static-perimetry: accuracy and fluctuations. Acta Ophthalmol. 1976; 54: 339– 347. [DOI] [PubMed] [Google Scholar]
- 9. Flammer J, Drance SM, Zulauf M. . Differential light threshold in automated static perimetry. Arch Ophthalmol. 1984; 102: 704– 706. [DOI] [PubMed] [Google Scholar]
- 10. Maddess T. . The influence of sampling errors on test-retest variability in perimetry. Invest Ophthalmol Vis Sci. 2011; 52: 1014– 1022. [DOI] [PubMed] [Google Scholar]
- 11. Maddess T. . Modeling the relative influence of fixation and sampling errors on test-retest-variability in perimetry [published online ahead of print July 30, 2014] Graefes Arch Clin Exp Ophthalmol. doi:http://dx.doi.org/10.1007/s00417-014-2751-y. [DOI] [PubMed]
- 12. Morales MU, Saker S, Mehta RL, Rubinstein M, Amoaku WM. . Preferred retinal locus profile during prolonged fixation attempts. Can J Ophthalmol. 2013; 48: 368– 374. [DOI] [PubMed] [Google Scholar]
- 13. Springer C, Bultmann S, Volcker HE, Rohrschneider K. . Fundus perimetry with the Micro Perimeter 1 in normal individuals: comparison with conventional threshold perimetry. Ophthalmology. 2005; 112: 848– 854. [DOI] [PubMed] [Google Scholar]
- 14. Gardiner SK, Swanson WH, Goren D, Mansberger SL, Demirel S. . Assessment of the reliability of standard automated perimetry in regions of glaucomatous damage. Ophthalmology. 2014; 121: 1359– 1369. [DOI] [PMC free article] [PubMed] [Google Scholar]
- 15. Numata T, Matsumoto C, Okuyama S,et al. . Detectability of visual field defects in glaucoma with high-resolution perimetry. J Glaucoma. 2016; 25: 847– 853. [DOI] [PubMed] [Google Scholar]
- 16. Henson DB, Chaudry S, Artes PH, Faragher EB, Ansons A. . Response variability in the visual field: comparison of optic neuritis, glaucoma, ocular hypertension, and normal eyes. Invest Ophthalmol Vis Sci. 2000; 41: 417– 421. [PubMed] [Google Scholar]
- 17. Chauhan BC, LeBlanc RP, Drance SM, Wijsman K, Cruz AM. . Effect of the number of threshold determinations on short-term fluctuation in automated perimetry. Ophthalmology. 1991; 98: 1420– 1424. [DOI] [PubMed] [Google Scholar]
- 18. Casson E, Johnson C, Shapiro L. . Longitudinal comparison of temporal-modulation perimetry with white-on-white and blue-on-yellow perimetry in ocular hypertension and early glaucoma. J Opt Soc Am A. 1993; 10: 1792– 1806. [DOI] [PubMed] [Google Scholar]
- 19. Springer C, Bultmann S, Volcker HE, Rohrschneider K. . Fundus perimetry with the Micro Perimeter 1 in normal individuals: comparison with conventional threshold perimetry. Ophthalmology. 2005; 112: 848– 854. [DOI] [PubMed] [Google Scholar]
- 20. Wall M, Woodward KR, Doyle CK, Zamba G. . The effective dynamic ranges of standard automated perimetry sizes III and V and motion and matrix perimetry. Arch Ophthalmol. 2010; 128: 570– 576. [DOI] [PubMed] [Google Scholar]
- 21. Fredette MJ, Giguere A, Anderson DR, Budenz DL, McSoley J. . Comparison of Matrix with Humphrey Field Analyzer II with SITA. Optom Vis Sci. 2015; 92: 527– 536. [DOI] [PubMed] [Google Scholar]
- 22. Heijl A, Lindgren A, Lindgren G. . Test-retest variability in glaucomatous visual fields. Am J Ophthalmol. 1989; 108: 130– 135. [DOI] [PubMed] [Google Scholar]
- 23. Airaksinen, Heijl A. Visual field and retinal fibre layer in early glaucoma after optic disc haemorrhage. Acta Ophthalmol. 1983; 61: 186– 194. [DOI] [PubMed] [Google Scholar]
- 24. Westcott MC, McNaught AI, Crabb DP, Fitzke FW, Hitchings RA. . High spatial resolution automated perimetry in glaucoma. Br J Ophthalmol. 1997; 81: 452– 459. [DOI] [PMC free article] [PubMed] [Google Scholar]
- 25. Fendrich R, Messenger CM, Marshall D, Johnson CA. . Stabilized image perimetry: evaluating the influence of eye movements on perimetry data. Opt Soc Am Tech Digest Ser. 1995.
- 26. Källmark FP, Ygge J. . Fixation pattern in healthy subjects during microperimetry with the scanning laser ophthalmoscope. Med Sci Monit. 2008; 14: CR311– 315. [PubMed] [Google Scholar]
- 27. Demirel S, Johnson C, Fendrich R, Vingrys AJ. . The slope of frequency-of-seeing curves in normal, amblyopic and pathologic vision. Opt Soc Am Tech Digest Ser. 1997; 244– 247.
- 28. Vingrys AJ, Demirel S. . The effect of fixational loss on perimetric thresholds and reliability. : Mills RP, . Perimetry Update. Amsterdam: Kugler & Ghedini; 1993: 521– 526. [Google Scholar]
- 29. Henson DB, Bryson H. . Is the variability in glaucomatous visual field loss due to poor fixation control? IPS Perimetry Update 1990/91. Amsterdam: Kugler; 1990/91: 217– 220. [Google Scholar]
- 30. Demirel S, Vingrys AJ. . Eye movements during perimetry and the effect that fixational instability has on perimetric outcomes. J Glaucoma. 1994; 3: 28– 35. [PubMed] [Google Scholar]
- 31. Engbert R, Kliegl R. . In the mind's eyes. : Hyona J, Radach R, Deubel H, . Cognitive and Applied Aspects of Eye Movements. Oxford: Elsevier; 2003: 103– 117. [Google Scholar]
- 32. Ishiyama Y, Murata H, Mayama C, Asaoka R. . An objective evaluation of gaze tracking in Humphrey perimetry and the relation with the reproducibility of visual fields: a pilot study in glaucoma. Invest Ophthalmol Vis Sci. 2014; 55: 8149– 8152. [DOI] [PubMed] [Google Scholar]
- 33. Ishiyama Y, Murata H, Hirasawa H, Asaoka R. . Estimating the usefulness of Humphrey perimetry gaze tracking for evaluating structure-function relationship in glaucoma. Invest Ophthalmol Vis Sci. 2015; 56: 7801– 7805. [DOI] [PubMed] [Google Scholar]
- 34. Henson DB, Emuh T. . Monitoring vigilance during perimetry by using pupillography. Invest Ophthalmol Vis Sci. 2010; 51: 3540– 3543. [DOI] [PubMed] [Google Scholar]


