Abstract
This work evaluates the response of human aortic endothelial cells (HAECs) to thromboresistant collagen-mimetic hydrogel coatings toward improving the biocompatibility of existing “off-the-shelf” small-caliber vascular grafts. Specifically, bioactive hydrogels – previously shown to support α1/α2 integrin-mediated cell adhesion but to resist platelet activation – were fabricated by combining poly(ethylene glycol) (PEG) with a 120 kDa, triple-helical collagen-mimetic protein(Scl2-2) containing the GFPGER adhesion sequence. Analysis of HAECs seeded onto the resulting PEG-Scl2-2 hydrogels demonstrated that HAEC adhesion increased with increasing Scl2-2 concentration, while HAEC migration rate decreased over this same concentration range. In addition, evaluation of HAEC phenotype at confluence indicated significant differences in the gene expression of NOS3, thrombomodulin, and E-selectin on the PEG-Scl2-2 hydrogels relative to PEG-collagen controls. At the protein level, however, only NOS3 was significantly different between the PEG-Scl2-2 and PEG-collagen surfaces. Furthermore, PECAM-1 and VE-cadherin expression on PEG-Scl2-2 hydrogels versus PEG-collagen controls could not be distinguished at either the gene or protein level. Cumulatively, these data indicate the PEG-Scl2-2 hydrogels warrant further investigation as “off-the-shelf” graft coatings. In future studies, the Scl2-2 protein can potentially be modified to include additional extracellular matrix or cytokine binding sites to further improve endothelial cell responses.
1. Introduction
Thrombosis and intimal hyperplasia are two primary causes of failure for synthetic vascular prostheses, such as expanded tetrapolyfluorethylene conduits, in small-caliber applications.1, 2 The formation of a quiescent, luminal endothelial cell layer is believed to be critical to inhibiting thrombosis and intimal hyperplasia in small-caliber grafts over the long-term. A key goal in improving the patency of vascular prostheses has therefore been to promote graft endothelialization.3, 4 One method for generating endothelialized grafts involves seeding conduits with patient-derived endothelial cells prior to implantation.5-8 Unfortunately, these pre-fabricated endothelial layers are currently patient-specific and generally require extended pre-culture, limiting their utility in emergency or “off-the-shelf” graft applications.1, 7
An alternative approach involves harnessing the potential of host endothelial cells to migrate from graft-host anastomoses.9 In this approach, the graft luminal surface is generally modified to enhance endothelial cell migration.10 Previous efforts have often focused on using proteins from the blood vessel basement membrane, such as fibronectin and collagens I and IV, as coatings.11, 12 However, many of these proteins3, 4 and associated peptides – such as RGD13– also support platelet adhesion until a confluent endothelium is established, rendering their use problematic for “off-the-shelf” applications. An ideal coating for “off-the-shelf” vascular prostheses would intrinsically resist platelet activation while supporting rapid endothelial cell migration from the anastomoses and the formation of a quiescent, luminal endothelial layer. The primary goal of the current study is to evaluate the capacity of a novel, thromboresistant biomaterial coating based on poly(ethylene glycol) (PEG) and collagen-mimetic proteins to support human endothelial cell adhesion, migration, and differentiation.
Recently, a biomaterial platform has been developed based on Designer Collagens, a family of collagen-mimetic proteins derived from the group A Streptococcus protein, Scl2.28 (referred to as Scl2-1).14, 15 Scl2-1 proteins contain the GXY repeats characteristic of collagen and spontaneously assemble into stable triple helical structures of ∼120 kDa.16 Importantly, Scl2-1 lacks hydroxyproline and does not require post-translational modification to attain a triple helical structure,16, 17 enabling its facile recombinant expression in E. coli.14, 15 These features circumvent the batch variability concerns of native collagens as well as the high scale-up costs associated with the solid-phase synthesis of GXY peptides capable of taking on physiologically stable triple helical structures.18 In contrast to collagen, Scl2-1 resists significant platelet aggregation16 and lacks cell adhesion sites.19 Specifically, Scl2-1 acts as a biological “blank slate” that only displays the selected receptor-binding sequences programmed in by site-directed mutagenesis.20
Recently, the GFPGER sequence – based on the collagen sequences GF/LOGER (O; hydroxyproline)21, 22 and recognized by integrin α1β1 and α2β1 complexes – was introduced into Scl2-1 through site-directed mutagenesis.16 The modified protein, designated Scl2-2, has been shown to maintain the triple helical structure and low platelet aggregation of Scl2-1, 16 while promoting the adhesion and spreading of bovine aortic endothelial cells (BAECs).20 Conjugation of Scl2 proteins within synthetic poly(ethylene glycol)(PEG) diacrylate hydrogels has allowed the selective bioactivity of Scl2 proteins to be combined with the availability and tunable material properties of synthetic polymers.20 Importantly, the intrinsic resistance to protein adsorption and cell adhesion characteristic of PEG isolates the cell-material interactions of PEG-Scl2 hydrogels to the adhesion sites introduced by the Scl2 proteins.20 PEG-Scl2-2 hydrogels have also been shown to resist platelet adhesion and aggregation, in contrast to collagen, and PEG-Scl2-2 surfaces do not significantly activate non-adherent platelets.23
Recent studies of BAEC attachment, spreading and migration on PEG-Scl2-2 hydrogels indicate that endothelial cell function can be modulated by Scl2-2 concentration.23, 24 While studies with bovine endothelial cells support the potential of PEG-Scl2-2 hydrogels in vascular applications, an in-depth evaluation of human endothelial cell behavior on PEG-Scl2-2 hydrogels is needed. This is particularly true when the contrasting integrin α1/α2 profiles of HAECs and BAECs are considered (Supplementary Figure 1). In the present study, we evaluated the response of human aortic endothelial cells (HAECs) to PEG-Scl2-2 hydrogels. Given the biphasic dependence of cell migratory capacity on adhesion strength (ie. cell migration initially increases with increasing adhesion through a maximum and then decreases),25 the effect of Scl2-2 concentration (4 mg/mL, 8 mg/mL, and 12 mg/mL)on cell adhesion and migration was investigated. In addition, HAEC proliferation and phenotype at confluence were evaluated on PEG-Scl2-2 hydrogels relative to PEG-collagen hydrogels containing 4 mg/mL of collagen I (which is roughly equivalent to 4 mg/mL Scl2-2 in terms of combined integrin α1/α2-I domain binding affinity16). Results support the potential utility of the proposed PEG-Scl2-2 hydrogel systems as coatings to improve the performance of small-caliber vascular grafts.
2. Materials and Methods
2.1. Polymer Synthesis and Scl2-2 Expression and Modification
2.1.1. Synthesis of PEG diacrylate
PEG diacrylate was prepared as previously described by combining 0.1 mmol/mL dry PEG (3.4 kDa, Fluka), 0.4 mmol/mLacryloyl chloride and 0.2 mmol/mL triethylamine in anhydrous dichloromethane and stirring under argon overnight.26 The resulting solution was washed with 2 M K2CO3 and separated into aqueous and dichloromethane phases to remove HCl. The organic phase was subsequently dried with anhydrous MgSO4, and PEG diacrylate was precipitated in diethyl ether, filtered and dried under vacuum. Acrylation of the terminal hydroxyl groups of PEG was confirmed by proton nuclear magnetic resonance (1H-NMR) to be ∼99%.
2.1.2. Expression and purification of Scl2-2 protein
Scl2-2 was previously engineered by introducing the DNA sequence encoding for GFPGER into Scl2-1via site-directed mutagenesis.16 Both Scl2-2 and Scl2-1 proteins have previously been demonstrated to take on stable triple-helical structures of ∼120 kDa.16 The recombinant Scl2-2 protein was expressed in E. coli BL21 (Novagen) as previously described and was purified by affinity chromatography on a HisTrap HP column followed by a HiTrap Q column (GE Healthcare).16 Protein purity was confirmed by sodium dodecyl sulfate–polyacrylamide gel electrophoresis (SDS–PAGE) followed by Coomassie Blue staining.20 Thereafter, Scl2-2 was dialyzed against double deionized water, lyophilized and stored at -20 °C until use.
2.1.3. Synthesis of acrylate-derivatized Scl2-2 protein
Following expression and purification, the Scl2-2 protein was acrylate-derivatized in order to permit its chemical conjugation within PEG diacrylate hydrogels. Briefly, Scl2-2 was reacted with acrylate-PEG-succinimidyl valerate (ACRL-PEG-SVA, 3.4 kDa; Laysan Bio, Inc.) at a molar ratio of 1:6 for 2 h in Dulbecco's phosphate buffered saline (DPBS, pH 7.4; Life Technologies). The resulting acrylate-derivatized protein was used immediately for the fabrication of PEG-Scl2-2 hydrogels. In a similar manner, collagen I (rat tail, Life Technologies) was reacted with ACRL-PEG-SVA at a 1:6 molar ratio for 2 h in 50 mM sodium bicarbonate buffer, pH 8.5.27 The resulting acrylate-derivatized collagen was purified by dialysis against double deionized water, lyophilized and stored at -20 °C until use. Acrylation of the Scl2-2 protein and collagen was confirmed using Fourier Transform Infrared Spectroscopy as previously described.20
2.2. Fabrication of PEG-Scl2-2and PEG-collagen Hydrogels
Hydrogel precursor solutions were prepared by combining a solution containing 10% (w/v) PEG diacylatein DPBS and acrylate-derivatized Scl2-2 at three different protein concentrations, namely 4 mg/mL, 8 mg/mL and 12 mg/mL. A positive control solution was prepared by dissolving 4 mg/mL of the acrylate-derivatized collagen in a solution of 10% PEG diacrylate in 20 mM acetic acid. Next, photoinitiator solution (260 mg/mL Irgacure 2959 in 70% ethanol) was added to each hydrogel precursor solution at 10 μL/mL. The precursor solutions were then dispensed into 0.5 mm thick rectangular glass molds and polymerized by exposure to longwave ultraviolet light (≈ 6 mW/cm2, 365 nm) for 6 min. The resulting hydrogel slabs were removed from the molds and allowed to swell in 70% ethanol for 1 h for the purpose of sterilization. Subsequently, the slabs were washed in a series of graded ethanol solutions for 20 min each (70%, 50%, 20% and 0% in DPBS), after which they were immersed in DPBS containing 1% PSA (10,000 U/mL penicillin, 10,000 mg/L streptomycin and 25 mg/L amphotericin; Hyclone) at room temperature for 12-14 h. Uniform hydrogel discs were then obtained from the slabs using a sterile 8 mm biopsy punch (Miltex). The discs were placed in DPBS within a 48-well plate, after which HAECs were seeded onto the hydrogel surfaces.
2.3. Cell Culture
Cryopreserved HAECs (Lonza) at passage 5 were thawed and expanded within a 37 °C/5% CO2 incubator. During expansion, cells were cultured in Endothelial Growth Medium (EGM BulletKit™;Lonza) supplemented with 10% fetal bovine serum (FBS; Hyclone) and 1% PSA. HAECs between passages 6 and 7 were harvested for use.
2.4. Cell Adhesion and Proliferation on Hydrogels
For adhesion and proliferation assessments, HAECs were seeded onto the hydrogel discs at a density of 5,000 cells/cm2. Following 24 h and 72 h of culture, cells on hydrogel surfaces were washed with DPBS twice and treated with a 10% formalin solution for 30 min. Cells were then stained with rhodamine-phalloidin (Life Technologies) and DAPI (Life Technologies) for the visualization of the actin cytoskeleton and nuclei, respectively. Fluorescence images of stained cells were used to quantify cell adhesion (number of cells/mm2) and fraction area coverage (fraction of the imaged area covered by cells). A total of 6 hydrogel discs per formulation were imaged (Zeiss Axiovert 200 M), with 10 regions per hydrogel disc selected at random for imaging and analysis.
Fluorescence images were transformed into 8-bit digital grayscale images using ImageJ software, followed by the selection of a threshold on gray levels in order to separate lighter-appearing cells from the darker background. In this process, pixels with grayscale values above the selected threshold were assigned a new grayscale value of “255” (white), and pixels with grayscale values below this threshold were assigned a new grayscale value of “0” (black). In order to remove background/debris appearing as “white” following thresholding, a median filter was applied to the modified images. Remaining “non-cell” regions appearing as “white” were removed manually using the ImageJ “Paintbrush” tool. Finally, the total white area in an image was divided by the total imaged area to obtain the “fraction area coverage” for that image, and the number of nuclei in an image was used to obtain a measure of “cells/mm2” for that image.
2.5. Cell Migration on Hydrogels
For the assessment of migration, HAECs seeded at 5000 cells/cm2 were allowed to attach and spread for 24 h. For each hydrogel formulation, a total of 70-100 cells over 6 hydrogel discs and at least three randomly selected locations per hydrogel were monitored for 1 h at 5-min intervals. To avoid cell-cell interactions, only cells in isolation (>100 μm from surrounding cells) were monitored. The Manual Tracking ImageJ Plug-In was used to track the movement of individual cells by monitoring the position of their nuclei throughout the image sequences (12 images per sequence). At each 5-min time point, the position of the cell centroid was tracked using ImageJ software, and the centroid positions were later used to calculate the mean-square displacement (MSD, <D2>) for a range of time intervals according to:
where N is the total number of 5-min time increments within the time duration under consideration, and di is the square of cell displacement during time increment,i.28 The cell speed, S, and persistence time, P, were then determined by fitting the MSD (<D2>) and the time interval, t, to the persistent random walk equation using nonlinear least squares regression analysis29, 30:
2.6. Cell Phenotype at Confluence on Hydrogels
For cell phenotype assessments, HAECs were seeded at a density of 10,000 cells/cm2 to allow cell confluence to be achieved prior to phenotypic analyses. As the 4 mg/mL PEG-Scl2-2 hydrogels did not support the formation of a confluent monolayer, this group was not included in the phenotypic analyses.
2.6.1 mRNA extraction and gene expression analyses
After 72 h of culture, mRNA was extracted from confluent cell layers on 8 mg/mL and 12 mg/mL PEG-Scl2-2 hydrogels and 4 mg/mL PEG-collagen controls using the Dynabeads mRNA direct kit (Ambion, Life Technologies).31 Briefly, cell culture medium was removed from the 48 well plates and the hydrogel discs were rinsed with 200 μL of DPBS. There after, the discs were incubated with 330 μL of lysis buffer (provided with the kit) at room temperature. After 10 min of incubation, the polyA-mRNA in the lysis buffer was extracted using 20 μL of Dynabeads oligo (dT)25 magnetic beads. Following rinsing steps, the polyA-mRNA was released from the Dynabeads in 100 μL of a 10 mM Tris-HCl solution by heating the beads to 80 °C for 2 min. The supernatant was stored at -80 °C for subsequent protein extraction.
Proprietary qRT-PCR verified primers for human NOS3, VE-Cadherin, PECAM-1, thrombomodulin (TM), E-selectin and β-actin were purchased from Origene. qRT-PCR was performed using a StepOne real-time PCR system (Life Technologies) and the SuperScript III Platinum One-Step qRT-PCR kit (Life Technologies). Approximately 16 ng of polyA-mRNA and 5 μL of a 1 μM primer solution were combined into a total reaction volume of 25 μL. Amplification was monitored using a StepOne RT-PCR system (Life Technologies) by measuring the change in SYBR Green fluorescence as a function of the amplification cycle, with ROX dye serving as a passive reference. For each sample, a threshold fluorescence value in the exponential phase of amplification was identified using StepOne software v2.0. The fractional cycle value at the intersection between the amplification curve for a particular gene product and this threshold line was recorded as the Ct (threshold cycle) of that gene. Gene expression was then calculated using the ΔΔCt method, with β-actin serving as the housekeeping gene and PEG-collagen hydrogels serving as the reference control.32 Melting temperature analysis was performed for each reaction product to verify the presence of the appropriate amplicon.
2.6.2 Quantification of protein production using western blot
Supernatant from the mRNA extraction process was utilized for western blot analysis to assess the expression of the endothelial cell markers VE-Cadherin, PECAM-1, NOS3, TM and E-selectin. DNA levels in the lysate were measured using the Quant-iT™ PicoGreen® dsDNA Reagent (Life technologies).For each protein of interest, volumes representing equal amounts of DNA (∼125-175 ng) were then concentrated using 3,000 MWCO Amicon filter units (Millipore), followed by the addition of β-mercaptoethanol and heat treatment at 95 °C for 10 minutes. The concentrated protein lysates were loaded into the wells of a 10% polyacrylamide gel and separated via SDS-PAGE. After electrophoresis, proteins were transferred to a nitrocellulose membrane (Thermo Scientific), washed twice with double distilled water and blocked with a solution of 5% bovine serum albumin (BSA, Fisher Scientific) in Tris-buffered saline containing 0.1% Tween-20 (TBST; 25 mMTris-HCl, pH 7.5, 137 mMNaCl, 0.1% Tween 20) for 1 h at room temperature. Following blocking, the membranes were incubated overnight at 4°C with primary antibodies against VE-Cadherin (clone C-19, Santa Cruz Biotechnology), PECAM-1 (clone EP3095, Abcam), NOS3 (clone C-20, Santa Cruz Biotechnology), TM (clone H-11, Santa Cruz Biotechnology), and E-selectin (clone C-20, Santa Cruz Biotechnology)diluted in TBST solution containing 5% BSA and 0.05% NaN3. After 16 h of incubation, samples were treated with horse radish peroxidase (HRP)-conjugated secondary antibody or alkaline phosphatase (AP)-conjugated secondary antibody (Jackson Immunoresearch) diluted in TBST solution containing 5% BSA for 1 h at room temperature. Bound secondary antibody was detected using Luminol reagent (Santa Cruz Biotechnology) or AP chemiluminescent solution (Invitrogen). Signal detection was performed using the molecular imager Chemidoc XRS system (Biorad) while band integrated optical density was quantified using Adobe Photoshop. Measured band integrated optical densities levels were normalized to the DNA content in each sample.
2.7. Statistical Analyses
Data are reported as mean ± standard error of the mean. Comparison of sample means was performed using analysis of variance (ANOVA) followed by a Tukey's post-hoc test (SPSS software), with p < 0.05 considered statistically significant.
3. Results
3.1. HAEC Adhesion and Proliferation
Acrylate-derivatized Scl2-2 was incorporated into 10% (w/v) PEGdiacrylate hydrogels at 4 mg/mL, 8 mg/mL, and 12 mg/mL.PEG-collagen hydrogels containing 4 mg/mL of collagen I were utilized as a reference control. HAECs seeded at 5,000 cells/cm2 on the PEG-Scl2-2 and PEG-collagen hydrogels were analyzed after 24 h and 72 h to quantify adhesion and proliferation (Figure 1). In general, the number of adherent HAECs at 24 h post-seeding increased with an increase in Scl2-2 concentration (Figure 2). Specifically, a significantly higher (∼50%) number of cells were found to adhere to the 12 mg/mL PEG-Scl2-2 hydrogels compared to the 4 mg/mL PEG-Scl2-2 hydrogels (p < 0.001) at this time-point. In addition, the number of adherent cells on the 12 mg/mL PEG-Scl2-2 hydrogels after 24 h of culture could not be statistically distinguished from the 4 mg/mL PEG-collagen controls.
Figure 1.
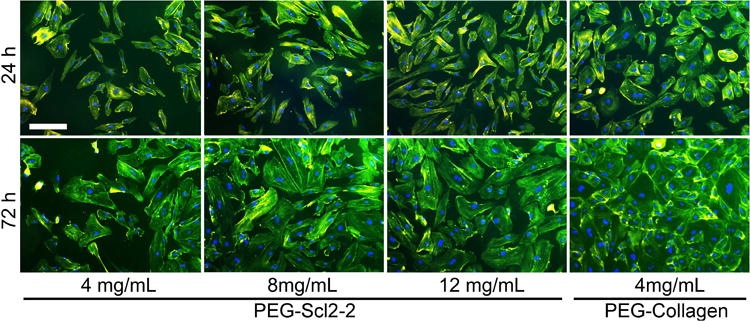
representative images of haecs stained with phalloidin and counterstained with dapi on peg-scl2-2 and peg-collagen hydrogels at 24 h and 72 h. the scale bar in the first image equals 200 μm and applies to all images in the series.
Figure 2.
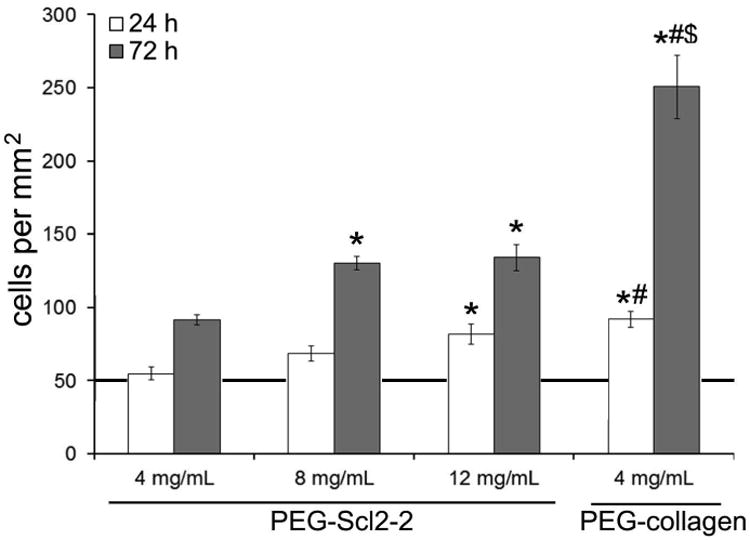
quantitative assessments of the surface cell density of haecs at 24 h and 72 h. measurements are expressed as mean ± standard error of mean. results were obtained from n = 6 independent samples per formulation with 10 images per sample. the line at 50 cells/mm2 indicates the initial seeding density at time 0. * significantly different from the 4 mg/ml peg-scl2-2 hydrogel, p < 0.05; # significantly different from the 8 mg/ml peg-scl2-2 hydrogel p < 0.05; $ significantly different from the 12 mg/ml peg-scl2-2 hydrogel, p < 0.05.
As with 24 h cell adhesion, total cell number after 72 h of culture was also found to increase with increasing Scl2-2 concentration (Figure 2). Specifically, cell numbers on the 8 mg/mL and 12 mg/mL PEG-Scl2-2 hydrogels were 40% greater than on the 4 mg/mL PEG-Scl2-2 hydrogels (p < 0.042). However, cell numbers on the PEG-collagen hydrogels at 72 h were 100-170% higher than those on the PEG-Scl2-2 hydrogels (p < 0.001). Taking the ratio of the 72 h cell densities to the 24 h adhesion results, the 4 mg/mL, 8 mg/mL and the 12 mg/mL PEG-Scl2-2 formulations gave ratios of 1.7-1.9, whereas the PEG-collagen controls gave a ratio of 2.7. These results indicate that the rate of HAEC proliferation on the PEG-collagen hydrogels was significantly greater than on the PEG-Scl2-2 formulations between 24 h and 72 h of culture, regardless of Scl2-2 concentration. That said, the cell surface coverage on the 8 mg/mL and 12 mg/mL PEG-Scl2-2 formulations at 72 h was within 10-15% of the 95% cell surface coverage associated with the PEG-collagen controls (Figure 3), despite the 2-fold difference in total cell numbers among these formulations at this time-point. In contrast, cell surface coverage on the 4 mg/mL PEG-Scl2-2 hydrogel was only ∼60%, significantly lower than the remaining formulations (p < 0.001).
Figure 3.
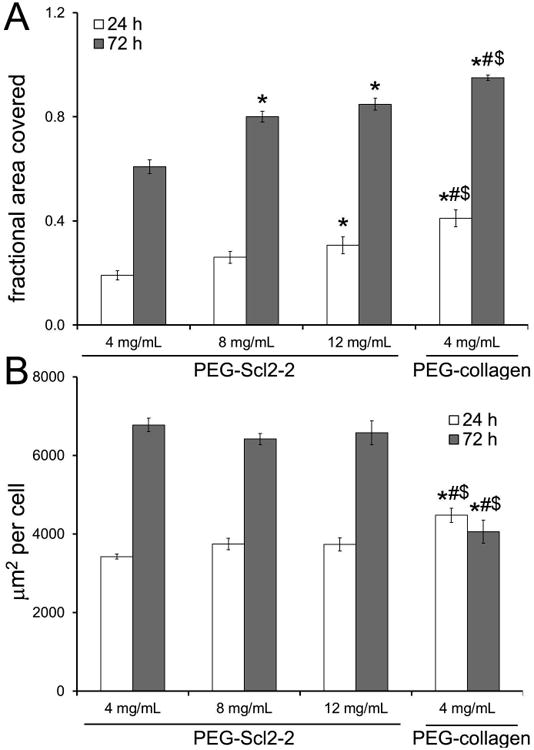
quantitative assessments of the fraction of surface covered by haecs at 24 h and 72 h of culture. measurements are expressed as mean ± standard error of the mean. for each hydrogel type, n = 5-6 independent samples were analyzed. * significantly different from the 4 mg/ml peg-scl2-2 hydrogel, p < 0.05; # significantly different from the 8 mg/ml peg-scl2-2 hydrogel, p < 0.05; $ significantly different from the 12 mg/ml peg-scl2-2 hydrogel, p < 0.05.
3.2. HAEC Migration
Although increased HAEC adhesion is generally desirable, cell migration is also critical to achieving graft endothelialization post-implantation. Previous work has demonstrated that cell migration speed increases with adhesion up to a maximum, after which the migration rate decreases as adhesion strength overcomes the migratory capacity of the cells.25 Thus, to assess the dependence of the HAEC migration rate on Scl2-2 concentration, HAECs were allowed to attach and spread for 24 h on PEG-Scl2-2 hydrogels and cell migration was monitored for 1 h at 5-min intervals. The highest average migration speed was exhibited by cells cultured on the 4 mg/mL PEG-Scl2-2 hydrogels (Figure 4). However, an increase in Scl2-2 concentration to 12 mg/mL resulted in a decreased migration speed that was comparable to the relatively low average cell speed on the PEG-collagen hydrogels. Specifically, doubling the concentration of the Scl2-2 protein from 4 mg/mL to 8 mg/mL decreased the migration speed by 25% (p = 0.006), while tripling the concentration to 12 mg/mL decreased the migration speed by 43% (p < 0.001) relative to the 4 mg/mL Scl2-2 formulation.
Figure 4.
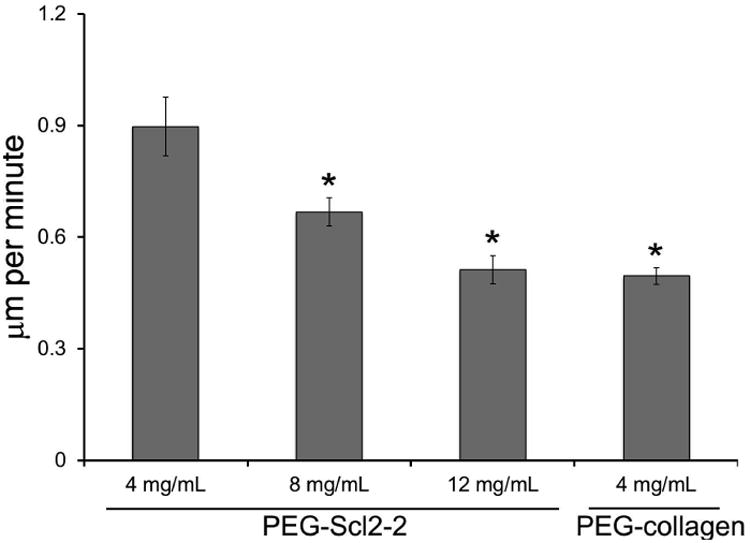
influence of scl2-2 concentration on the migration speed of haecs. for each formulation, n = 70-100 cells were analyzed. measurements are expressed as mean ± standard error of mean. * significantly different from the 4 mg/ml peg-scl2-2 hydrogel, p < 0.05.
3.3. HAEC Phenotype at Confluence
In addition to promoting endothelial cell adhesion and migration, a graft coating must enable the formation of a confluent endothelial cell monolayer and support a quiescent endothelial cell phenotype. To evaluate HAEC phenotype on the PEG-Scl2-2 surfaces at confluence, cells were seeded at an increased initial density of 10,000 cells/cm2. Cells on all surfaces achieved confluence by 72 h. However, HAEC monolayers on the 4 mg/mL PEG-Scl2-2 hydrogels were not stable, and the cell layers peeled off the hydrogel surfaces following the formation of continuous cell-cell contacts (data not shown). As a result, the 4 mg/mL PEG-Scl2-2 hydrogels were not included in the phenotypic analyses.
Several endothelial cell markers were assessed at both the gene and protein level for each hydrogel formulation. qRT-PCR results indicated no significant differences in HAEC gene expression of PECAM-1 and VE-cadherin, two markers associated with endothelial cell intercellular junctions, on either the 8 mg/mL or 12 mg/mL PEG-Scl2-2 hydrogels relative to the PEG-collagen controls (Figure 5). However, HAECs on both PEG-Scl2-2 formulations demonstrated significantly lower gene expression for NOS3, an enzyme which promotes the maintenance of vascular homeostasis,33 compared to PEG-collagen controls (p < 0.001). Similar results were found for TM, a protein associated with anti-coagulant activity.34 In contrast, gene expression for E-selectin, a cell adhesion molecule expressed by endothelial cells upon activation by damage-associated cytokines, was 16-to-22 fold greater on the PEG-Scl2-2 hydrogels relative to the PEG-collagen controls. Cumulatively, these qRT-PCR data indicate that HAECs on the PEG-collagen surfaces may be on a trajectory toward a more quiescent phenotype than HAECs on the PEG-Scl2-2 hydrogels.
Figure 5.
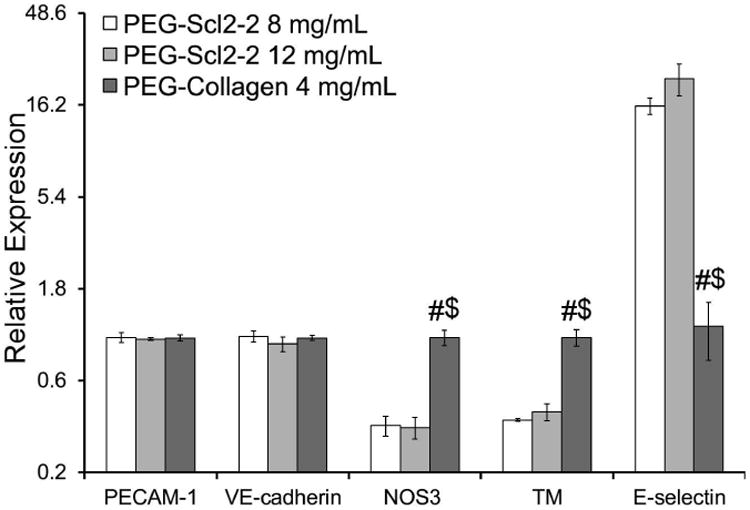
relative gene expression of the endothelial markers pecam-1, ve-cadherin, nos3, tm and e-selectin of confluent haecs cultured on peg-scl2-2 and peg-collagen hydrogels. for each hydrogel type, n = 3-6 independent samples were analyzed. # significantly different from the 8 mg/ml peg-scl2-2 hydrogel, p < 0.05; $ significantly different from the 12 mg/ml peg-scl2-2 hydrogel, p < 0.05.
At the protein level, HAECs on the 8 mg/mL PEG-Scl2-2 hydrogels appeared to produce higher per cell levels of PECAM-1 relative to PEG-collagen controls, although this difference was not statistically significant (p = 0.051, Figure 6). The protein levels of VE-Cadherin were also not significantly different among the PEG-Scl2-2 hydrogels and the PEG-collagen controls (Figure 6). In agreement with the qRT-PCR data, the production of NOS3 protein by cells cultured on the PEG-Scl2-2 hydrogels was significantly lower compared to cells on the PEG-collagen hydrogels (p < 0.014, Figure 6). However, in contrast to the gene expression data, protein levels of TM and E-selectin could not be distinguished among formulations (Figure 6), indicating that the differences seen at the gene expression level had not yet been translated to the protein level and/or that more complex regulatory dynamics (eg. increased turnover) were involved. Combined, the protein level data indicate that confluent HAECs displayed a similar behaviors on the PEG-Scl2-2 and PEG-collagen hydrogels for the markers analyzed, with the exception of NOS3.
Figure 6.
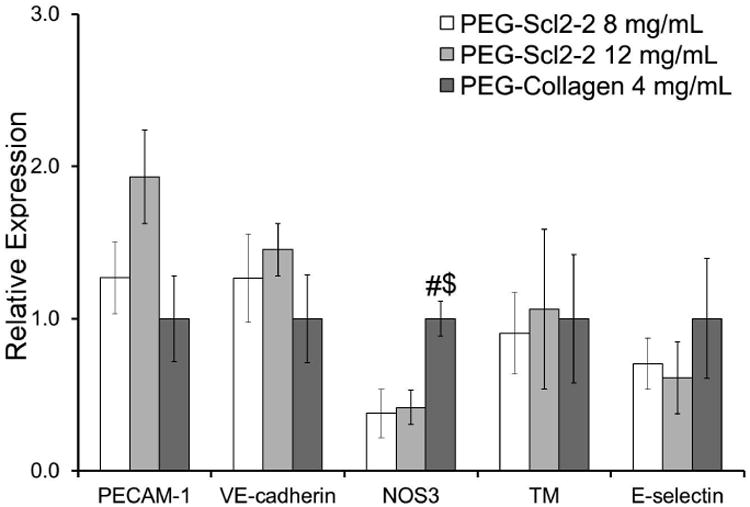
relative protein expression of the endothelial markers: pecam-1, ve-cadherin, nos3, tm, and e-selectin by confluent haecs cultured on peg-scl2-2 and peg-collagen hydrogels. measurements are express as mean ± standard error of the mean. for each hydrogel type, n = 3-6 independent samples were analyzed. # significantly different from the 8 mg/ml peg-scl2-2 hydrogel, p < 0.05; $ significantly different from the 12 mg/ml peg-scl2-2 hydrogel, p < 0.05.
4. Discussion
An “off-the-shelf” small-caliber vascular prosthesis should provide a thromboresistant lumen that promotes rapid endothelialization.35 One approach to achieve rapid graft endothelialization involves supporting the migration of endothelial cells from graft-host anastomoses via functionalized luminal coatings.9, 10 While previous efforts to create such bioactive coatings have met with varying levels of success,3, 4, 11, 12 the design of functionalized coatings that resist platelet activation and concurrently induce appropriate endothelial cell responses remains a challenge.36 Therefore, the development of thromboresistant materials that direct endothelial cell behavior would have a significant impact on small-caliber “off-the-shelf” grafts. Towards this long-term goal, we investigated the role of hydrogels containing varying levels of the thromboresistant, triple-helical protein Scl2-2 (containing the collagen-mimetic integrin binding motif GFPGER) on HAEC responses relative to collagen-containing controls.
To enable endothelialization following implantation, the PEG-Scl2-2 coatings must promote endothelial cell adhesion to a sufficient extent to allow the formation of a stable monolayer. However, the endothelial cells cannot be so tightly bound that migration is significantly inhibited.24 Therefore, we first evaluated HAEC adhesion and proliferation on PEG-Scl2-2 hydrogels as a function of Scl2-2 concentration. As expected, initial cell attachment after 24 h of culture was enhanced with increasing levels of Scl2-protein, with adhesion on the 12 mg/mL PEG-Scl2-2 hydrogel being lower than, but comparable to, that of the PEG-collagen control. After 72 h of culture, HAECs had proliferated rapidly on all PEG-Scl2-2 hydrogels, and cell surface coverage had reached ∼84% for the 12 mg/mL PEG-Scl2-2 hydrogels. These results indicate that increasing the number of available integrin binding sites can be beneficial for the rapid formation of a confluent endothelial cell layer. Indeed, when the cell seeding density was doubled from that used in the initial adhesion tests, the 8 mg/mL and 12 mg/mL PEG-Scl2-2 surfaces showed the capacity to support a stable, confluent endothelial cell monolayer. However, the 4 mg/mL PEG-Scl2-2 surface was unable to support HAEC confluence.
We next demonstrated that migration speeds were inversely proportional to the concentration of Scl2-2 protein in the PEG-Scl2-2 hydrogels over the range of concentrations tested in this study. In particular, migration speeds were highest on the 4 mg/mL PEG-Scl2-2 hydrogels, while at 12 mg/mL Scl2-2, average cell speeds were indistinguishable from those observed on 4 mg/mL PEG-collagen controls. Although the speeds in our study (0.5 μm/min - 0.9 μm/min) are significantly lower than the 2.5 μm/min reported for BAECs cultured on 8 mg/mL PEG-Scl2-2 hydrogels, 24 our results are comparable with migration speeds reported for human umbilical vein endothelial cells cultured on polyacrylamide hydrogels37 and HAECs cultured on glass surfaces coated with RGD.38 However, the present results are in contrast to a previously published study that reported an increase in BAEC migration with increasing Scl2-2 over a similar Scl2-2 concentration range.24 That said, comparative analyses of cell migration should be interpreted with caution as cell migration is a dynamic process and is a function of several factors, including cell phenotype, density of cell receptors, availability of binding sites, and substrate stiffness and chemistry.39
Once recruited, endothelial cells are expected to adhere strongly to the graft, form tight junctions and establish a confluent monolayer. A vital preliminary indicator of the ability of PEG-Scl2-2 hydrogels to support endothelializationis therefore their ability to promote a quiescent HAEC phenotype. To evaluate HAEC phenotype at confluence, we focused our attention on five common EC markers: VE-cadherin, PECAM-1, NOS3, TM, and E-selectin.40 The expression of VE-cadherin, PECAM-1, NOS3 and TM are, in general, positively correlated with a quiescent EC phenotype, while E-selectin is negatively correlated with quiescence. The expression of PECAM-1 and VE-cadherin were not significantly different on the 8 mg/mL and 12 mg/mL PEG-Scl2-2 hydrogels relative to the PEG-collagen controls at either the gene or the protein level. In addition, differences in TM and E-selectin noted at the gene expression level for PEG-Scl2-2 hydrogels relative to PEG-collagen controls were not observed at the protein level. However, HAECs cultured on the PEG-Scl2-2 hydrogels expressed significantly lower NOS3 than on the PEG-collagen controls at both the gene and protein level. This lower expression of NOS3 could be significant in that NOS3 is critical to vascular homeostasis.33
An additional limitation of the present study is the use of PEG-collagen hydrogels containing 4 mg/mL collagen as a comparative control for the PEG-Scl2-2 hydrogels. Although we based this choice on α1/α2 integrin affinity assessments,16 collagen also interacts with a range of integrins with which the current Scl2-2 protein does not interact.41, 42 That said, the Scl2-2 protein can then potentially be modified to include additional extracellular matrix or cytokine binding sites to further improve endothelial cell responses while maintaining the unique thromboresistance of Scl2 proteins. For instance, a heparin binding domain could be included, which would be anticipated to indirectly stimulate endothelial cell migration,43 increase NOS3 activity,44 and support a mature endothelial cell phenotype.45
In summary, the results from this study demonstrate that PEG-Scl2-2 hydrogels support HAEC adhesion and migration in a dose-dependent manner. The 8 mg/mL PEG-Scl2-2 hydrogels promoted intermediate levels of cell adhesion and migration, while also supporting cell confluence. Thus, future studies will focus on using this formulation for the development of “off-the-shelf” vascular graft coatings and will incorporate a broader range of markers to more fully evaluate endothelial cell phenotype. In addition, although previous studies have reported that the parent Scl2 protein is cytocompatible and does not elicit an immune response in SJL/J and Arc mice,46 the potential immune and inflammatory responses associated with the use of this bacterially-derived protein must also be further investigated in future work.
Supplementary Material
Acknowledgments
We would like to acknowledge the NIH R01 EB013297, NIH R03 EB0152167, and the NSF DMR CAREER Award 1346807 for funding.
References
- 1.Burkel WE. Med Prog Technol. 1989;14:165–175. [PubMed] [Google Scholar]
- 2.Kader KN, et al. Tissue Eng. 2000;6:241–251. doi: 10.1089/10763270050044425. [DOI] [PubMed] [Google Scholar]
- 3.L'heureux N, Paquet S, Labbe R, Germain L, Auger FA. FASEB J. 1998;12:47–56. doi: 10.1096/fasebj.12.1.47. [DOI] [PubMed] [Google Scholar]
- 4.Weinberg C, Bell E. Science. 1986;231:397–400. doi: 10.1126/science.2934816. [DOI] [PubMed] [Google Scholar]
- 5.Thompson MM, Budd J, Eady S, James R, Bell P. Br J Surg. 1994;81:1121–1127. doi: 10.1002/bjs.1800810813. [DOI] [PubMed] [Google Scholar]
- 6.Zhang ZX, et al. Tissue Eng Pt A. 2008;14:1109–1120. doi: 10.1089/ten.tea.2007.0219. [DOI] [PubMed] [Google Scholar]
- 7.Schmedlen RH, Elbjeirami WM, Gobin AS, West JL. Clin Plast Surg. 2003;30:507–517. doi: 10.1016/s0094-1298(03)00069-5. [DOI] [PubMed] [Google Scholar]
- 8.Heyligers JMM, Arts CHP, Verhagen HJM, de Groot PG, Moll FL. Ann Vasc Surg. 2005;19:448–456. doi: 10.1007/s10016-005-0026-0. [DOI] [PubMed] [Google Scholar]
- 9.Tu Q, Zhao Y, Xue X, Wang J, Huang N. Tissue Eng Pt A. 16:3635–3645. doi: 10.1089/ten.TEA.2010.0088. [DOI] [PubMed] [Google Scholar]
- 10.Noh I, Goodman SL, Hubbell JA. J Biomater Sci Polym Ed. 1998;9:407–426. doi: 10.1163/156856298x00532. [DOI] [PubMed] [Google Scholar]
- 11.Tersteeg C, et al. J Cell Mol Med. 2012;16:2117–2126. doi: 10.1111/j.1582-4934.2011.01519.x. [DOI] [PMC free article] [PubMed] [Google Scholar]
- 12.De Visscher G, Mesure L, Meuris B, Ivanova A, Flameng W. Acta Biomater. 2012;8:1330–1338. doi: 10.1016/j.actbio.2011.09.016. [DOI] [PubMed] [Google Scholar]
- 13.Rubin BG, McGraw DJ, Sicard GA, Santoro SA. J Vasc Surg. 1992;15:683–692. [PubMed] [Google Scholar]
- 14.Xu Y, Keene D, Bujnicki J, Höök M, Lukomski S. Biol Chem. 2002;277:27312–27318. doi: 10.1074/jbc.M201163200. [DOI] [PubMed] [Google Scholar]
- 15.Han R, et al. Appl Microbiol Biotechnol. 2006;72:109–115. doi: 10.1007/s00253-006-0387-5. [DOI] [PubMed] [Google Scholar]
- 16.Seo N, et al. Journal of Biological Chemistry. 2010;285:31046–31054. doi: 10.1074/jbc.M110.151357. [DOI] [PMC free article] [PubMed] [Google Scholar]
- 17.Brown FR, Hopfinger AJ, Blout ER. J Mol Bio. 1972;63:101–115. doi: 10.1016/0022-2836(72)90524-4. [DOI] [PubMed] [Google Scholar]
- 18.Khew ST, Zhu XH, Tong YW. Tissue Eng. 2007;13:2451–2463. doi: 10.1089/ten.2007.0063. [DOI] [PubMed] [Google Scholar]
- 19.Humtsoe JO, et al. J Biol Chem. 2005;280:13848–13857. doi: 10.1074/jbc.M410605200. [DOI] [PubMed] [Google Scholar]
- 20.Cosgriff-Hernandez E, et al. Acta Biomater. 2010;6:3969–3977. doi: 10.1016/j.actbio.2010.05.002. [DOI] [PubMed] [Google Scholar]
- 21.Xu Y, et al. J Biol Chem. 2000;275:38981–38989. doi: 10.1074/jbc.M007668200. [DOI] [PubMed] [Google Scholar]
- 22.Kim JK, et al. J Biol Chem. 2005;280:32512–32520. doi: 10.1074/jbc.M502431200. [DOI] [PubMed] [Google Scholar]
- 23.Browning MB, et al. Acta Biomater. 2012;8:1010–1021. doi: 10.1016/j.actbio.2011.11.015. [DOI] [PubMed] [Google Scholar]
- 24.Browning MB, et al. Tissue Eng Pt A. 2014;20:3130–3141. doi: 10.1089/ten.tea.2013.0602. [DOI] [PMC free article] [PubMed] [Google Scholar]
- 25.Peyton SR, Putnam AJ. J Cell Physiol. 2005;204:198–209. doi: 10.1002/jcp.20274. [DOI] [PubMed] [Google Scholar]
- 26.Bulick AS, et al. Tissue Eng Pt A. 2008;15:815–825. doi: 10.1089/ten.tea.2008.0179. [DOI] [PubMed] [Google Scholar]
- 27.Munoz-Pinto DJ, et al. Tissue Eng Pt A. 2012;18:1710–1719. doi: 10.1089/ten.tea.2011.0348. [DOI] [PMC free article] [PubMed] [Google Scholar]
- 28.Stokes CL, Lauffenburger DA, Williams SK. J Cell Sci. 1991;99:419–430. doi: 10.1242/jcs.99.2.419. [DOI] [PubMed] [Google Scholar]
- 29.Reinhart-King CA, Dembo M, Hammer DA. Biophys J. 2008;95:6044–6051. doi: 10.1529/biophysj.107.127662. [DOI] [PMC free article] [PubMed] [Google Scholar]
- 30.DiMilla P, Stone J, Quinn J, Albelda S, Lauffenburger D. J Cell Biol. 1993;122:729–737. doi: 10.1083/jcb.122.3.729. [DOI] [PMC free article] [PubMed] [Google Scholar]
- 31.Munoz-Pinto DJ, Jimenez-Vergara AC, Gharat TP, Hahn MS. Biomaterials. 2015;4042:32. doi: 10.1016/j.biomaterials.2014.10.051. [DOI] [PMC free article] [PubMed] [Google Scholar]
- 32.Livak KJ, Schmittgen TD. Methods. 2001;25408:402. doi: 10.1006/meth.2001.1262. [DOI] [PubMed] [Google Scholar]
- 33.Hastings NE, Simmers MB, McDonald OG, Wamhoff BR, Blackman BR. Am J Physiol Cell Physiol. 2007;293:C1824–1833. doi: 10.1152/ajpcell.00385.2007. [DOI] [PubMed] [Google Scholar]
- 34.Malek AM, Jackman R, Rosenberg RD, Izumo S. Circ Res. 1994;74:852–860. doi: 10.1161/01.res.74.5.852. [DOI] [PubMed] [Google Scholar]
- 35.Teebken OE, Haverich A. Eur J, Vasc Endovasc. 2002;23:475–485. doi: 10.1053/ejvs.2002.1654. [DOI] [PubMed] [Google Scholar]
- 36.Burkel W. Med Prog Technol. 1987;14:165–175. [PubMed] [Google Scholar]
- 37.Saunders R, Hammer D. Cell Mol Bioeng. 2010;3:60–67. doi: 10.1007/s12195-010-0112-4. [DOI] [PMC free article] [PubMed] [Google Scholar]
- 38.Wacker BK, et al. Biophys J. 2008;94:273–285. doi: 10.1529/biophysj.107.109074. [DOI] [PMC free article] [PubMed] [Google Scholar]
- 39.Lamalice L, Le Boeuf F, Huot J. Circ Res. 2007;100:782–794. doi: 10.1161/01.RES.0000259593.07661.1e. [DOI] [PubMed] [Google Scholar]
- 40.Jimenez-Vergara A, et al. Ann Biomed Eng. 2010;38:2885–2895. doi: 10.1007/s10439-010-0049-8. [DOI] [PubMed] [Google Scholar]
- 41.Castanos-Velez E, Biberfeld P, Patarroyo M. Immunology. 1995;86:270. [PMC free article] [PubMed] [Google Scholar]
- 42.Tulla M. Collagen receptor integrins: evolution, ligand binding selectivity and the effect of activation. University of Jyväskylä; 2007. [Google Scholar]
- 43.Giraux JL, et al. Eur J Cell Biol. 1998;77:352–359. doi: 10.1016/S0171-9335(98)80094-0. [DOI] [PubMed] [Google Scholar]
- 44.Kouretas PC, et al. J Mol Cell Cardiol. 1998;30:2669–2682. doi: 10.1006/jmcc.1998.0831. [DOI] [PubMed] [Google Scholar]
- 45.Hoshi RA, et al. Biomaterials. 2013;34:30–41. doi: 10.1016/j.biomaterials.2012.09.046. [DOI] [PMC free article] [PubMed] [Google Scholar]
- 46.Peng YY, et al. Biomaterials. 2010;31:2755–2761. doi: 10.1016/j.biomaterials.2009.12.040. [DOI] [PMC free article] [PubMed] [Google Scholar]
Associated Data
This section collects any data citations, data availability statements, or supplementary materials included in this article.


