Abstract
One important index to assess left ventricular diastolic function is the quantitative measurement of atrioventricular junction (AVJ) motion in one cardiac cycle including systole and diastole. The best way to perform the measurement is to use a software tool that can conduct AVJ motion tracking from cine cardiovascular magnetic resonance (CMR) images. In this paper, a software tool for this purpose is presented by using the insight segmentation and registration toolkit (ITK), the visualization toolkit (VTK), and Qt. We propose a surface area-based tracking approach in the software tool. In the tracking approach to obtain the surface area swept by six points being tracked, we manually select six points from four-, three- and two-chamber views of CMR images. After that, we reconstruct the 3-D coordinates of the six points from image acquisition parameters extracted from DICOM files. We perform interpolation by using parametric cubic curve fitting techniques. From the curve fitting results, we finally obtain the surface areas for all time points in one cardiac cycle. The software tool has been successfully implemented. The functionality include single point-based tracking, surface area-based tracking by using 6 tracked points, generation of displacement, sweep surface area and velocity, and generation of tracking movies. From the software engineering practice, it is concluded that ITK, VTK, and Qt are very handy software systems to implement automatic image analysis functions for CMR images, such as quantitative measure of motion by visual tracking. The software tool provides a convenient and efficient way to measure AVJ motion and extends the scope of methods for ventricular function assessment.
Keywords: Software tool, tracking, AVJ motion, ITK, VTK, Qt
We use sweep surface area (SSA), defined by 6 tracked points in 4-, 3- and 2-chamber views of cine cardiovascular magnetic resonance (CMR) images with 2 points in each view in Atrioventricular Junction (AVJ) region, to realize surface area based tracking for left ventricular (LV) function assessment. It is demonstrated that the surface area based tracking presented in this paper gives better performance than the single point based tracking in our previous paper in terms of reproducibility.
I. Introduction
Left ventricular (LV) diastolic function is an important index for the evaluation and diagnosis of heart failure (HF), which has high morbidity and mortality rates [1]–[4]. Atrioventricular Junction (AVJ) motion tracking can be used to assess the functionality of the left ventricle in End Diastole (ED) and End Systole (ES) phases of one cardiac cycle. Wu et al. proposed to use cine cardiovascular magnetic resonance (CMR) images to access LV diastolic function by performing AVJ feature tracking, which has been evaluated to be an effective approach for this purpose [5], [6]. Feature tracking is a technique to realize motion estimation based on image features such as corners or edges by using cross correlation or normalized cross correlation. Typically, the motion estimation is realized by searching within a predefined region through similarity measure based matching techniques. In this paper, we perform feature tracking by using normalized cross correlation through a search with template matching within a predefined rectangular region based on corners in CMR images. By using normalized cross correlation, we can overcome the problem due to the brightness variation caused in imaging process, which affects tracking accuracy with standard cross correlation. The current state of the art implementations for AVJ feature tracking are mainly Matlab based including [5], [7]–[9]. In this paper, we propose to use C++ to implement the AVJ tracking software tool based on the libraries of the Insight Segmentation and Registration Toolkit (ITK) [10], [11], the Visualization Toolkit (VTK) [12] and Qt [13]. Our C++ implementation provides an integration package, which is ready for clinical usage. The software tool we proposed is able to semi-automatically track AVJ motion based on both a single point [14] and 6 point based surface area from cine CMR images. The quantitative measurement results are computed and visualized by using the software tool. In the development of the software tool we use ITK for image processing part of the AVJ motion tracking, VTK for interaction and visualization of the processed images, and Qt for user interface.
In our software tool, we implement functionality for both single point based tracking and surface area based tracking from 6 tracked points. The reason we implement this surface area based tracking method alongside single point based tracking is that the surface area swept by 6 tracked points is a global measure based on 3D and can provide more accurate and reliable motion analysis results for AVJ region movement. In this tracking method, we first manually select 2 points in 4-, 3- and 2-chamber views respectively in the AVJ region. In total, we select 6 points and then perform tracking for each of the 6 points by using the technique described in [14]. Therefore, we obtain tracking trajectories for all the 6 points. We then use 3D transformation by extracting the parameters from DICOM images to map the 2D tracked point coordinates to 3D space. After that, we use a parametric cubic spline curve fitting technique in 3D to perform interpolation for each time point based on the 6 control points. Consequently we compute the surface areas swept by the fitted curves for all time points in one cardiac cycle in 3D. At last by defining the surface areas at the systole phase as negative and those at the diastole phase as positive we then calculate the accumulated sum of the signed surface areas and output the tracking results. A preliminary version of this work on single point based tracking has been reported in [14]. This paper is the extension for surface area based tracking by using 6 tracked points. Our software tool is free to use and can be obtained by contact with any of the authors.
In the following sections, we present software architecture in Section II; we illustrate single point based tracking algorithm implementation in Section III; and then we present how to perform 3D transformation of tracked points in Section IV; after that we illustrate the surface area based tracking technique in Section V; subsequently, we demonstrate our experimental results in Section VI; and finally we conclude in Section VII.
II. Software Architecture
A. Physical Design
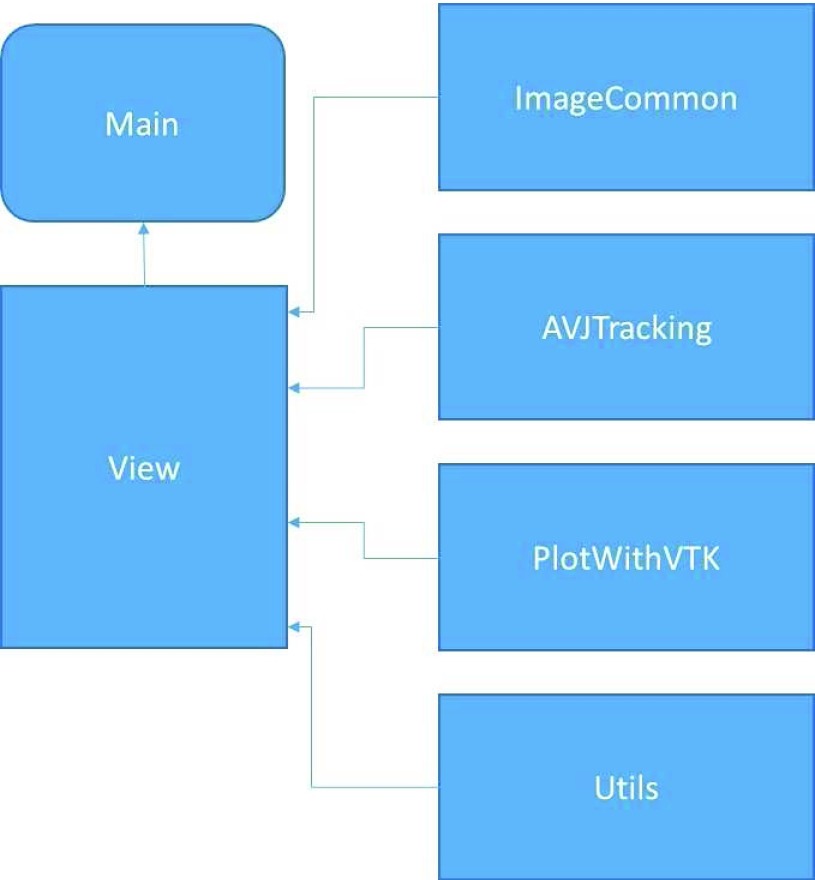
Physical design is the first step in a software tool development. Good physical design can keep software maintenance cost small. According to our AVJ tracking software tool goal, the code for image view, core tracking, and display figure generation is purposely separated in several different components. Each component is responsible for different functionality.
The physical design diagram is shown in Figure 1.
FIGURE 1.
Physical design diagram.
B. Logical Design
A good logical design is a key to the success for the software tool development. The AVJ tracking tool is designed by complying with pure C++ design rules and organizing everything in classes. For main view windows, a class with the name MainView is designed, which is inherited from Qt’s QMainWindow. The MainView class’s main functionality is to display the CMR images slice by slice. It handles all the interaction with users including opening an image file, resampling the image, manually choosing an area to start tracking, displaying figure generation, and generating tracking movie.
C. Software Engineering Process
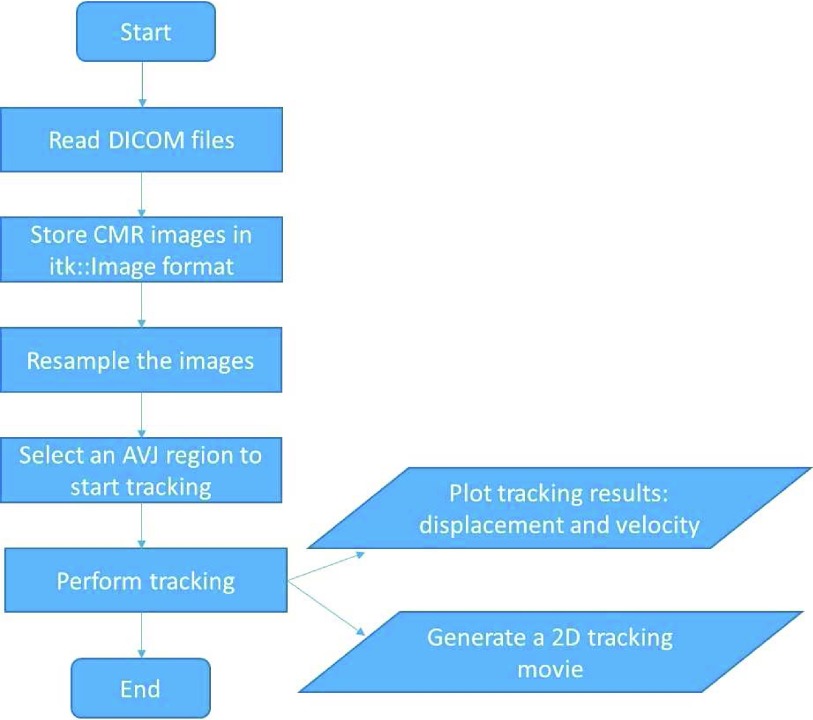
The software engineering process is managed by using CMake. During the process, the source code and the binary build generation are separated into two different directories. Each time the physical design of the code is modified, CMake is re-run to generate the binary build generation. To edit and compile code, the integrated development environment (IDE) of Visual Studio Community 2013 is used. During the development process, Qt [13] with version 5.5.0 is first installed for both debug and release modes. ITK and VTK are built from the latest source code [10]–[12] using the same process of CMake. Finally, ITK/VTK/Qt are integrated together to implement the AVJ tracking software tool. The usage flow chart diagram of the software tool for single point based tracking is shown in Figure 2.
FIGURE 2.
Usage flow chart diagram for single point based tracking.
D. Software Framework for Surface Area Based Tracking
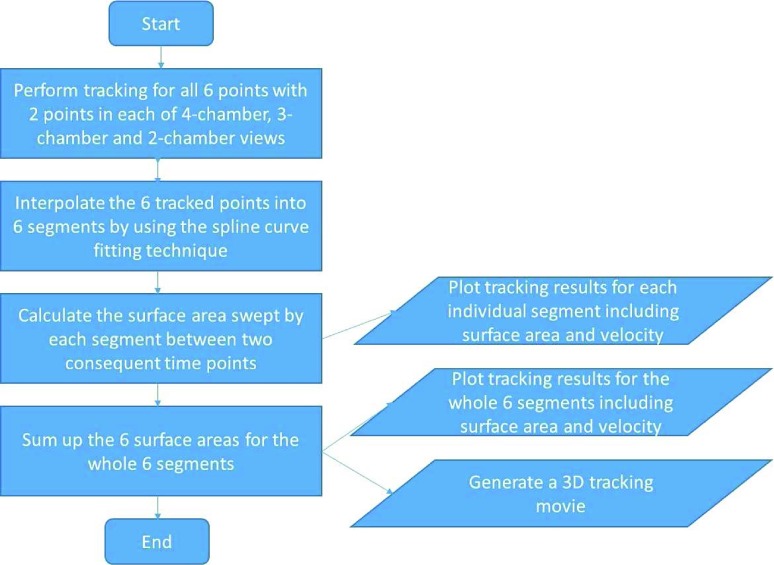
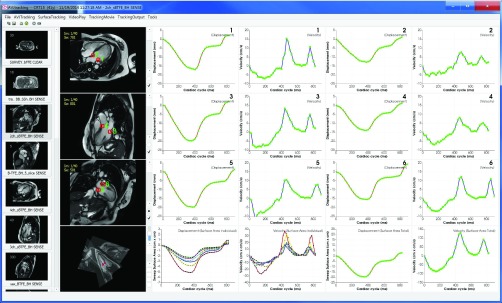
The framework for surface area based tracking incorporates the code to handle three 2D image displays for 4-, 3- and 2-chamber views, and also includes the code for 3D visualization of the chamber views, curve fitting interpolation and tracking process. The usage flow chart diagram for surface area based tracking is shown in Figure 3, and the software tool interface for surface area based tracking is shown in Figure 4. In the interface, the left most column is a DICOM image after read-in. The second column is the four displays for 4-, 3- and 2-chamber views and a 3D view. The right four columns are for the presentation of tracking results including both displacement/surface area and velocity. The second and fourth columns from the rightmost are for displacement/surface area; and the first and third columns from the rightmost are for velocity. The numbers in the upper right corners in the first three rows of the rightmost four columns are indications of which point of the 6 tracked points the displacement and velocity plots belong to. The pair of a single number from 1 to 6 are for the displacement and velocity plots each. In total, there are 6 pairs of displacement and velocity plots. The corresponding 6 tracked points are displayed in the first three CMR image views in the second column. The bottom row of the rightmost four columns is for the surface area and velocity plots. The first two plots are for each individual of the 6 segments; and the second two plots are for total surface area by summing up the whole 6 segments.
FIGURE 3.
Usage flow chart diagram for surface area based tracking.
FIGURE 4.
Software tool interface for AVJ motion tracking based on surface area.
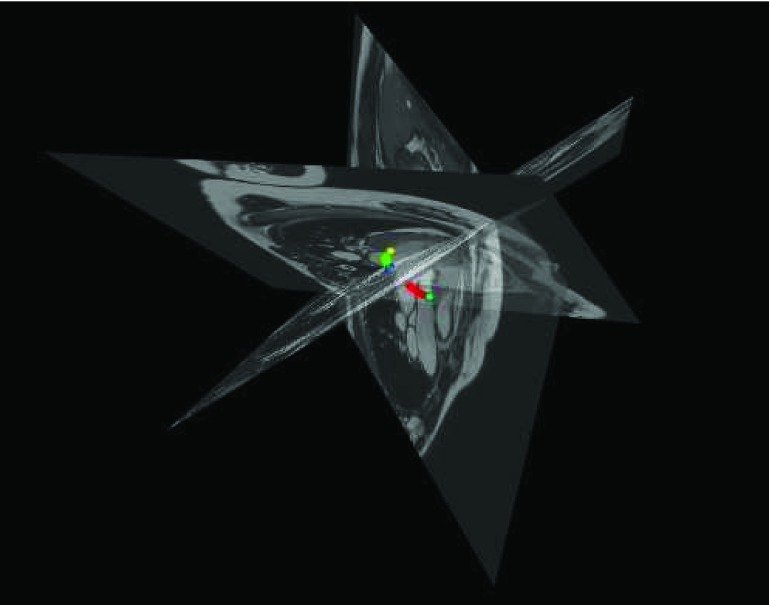
In particular, in the software tool interface, we implemented a display view for 3D visualization. In this view, the three 2D image views for 4-, 3- and 2-chambers are displayed together and aligned in 3D world coordinate system for better visualization as shown in Figure 5.
FIGURE 5.
3D visualization view. The three 2D image views for 4-, 3- and 2-chambers are displayed together and aligned in 3D world coordinate system for better visualization purpose. The color segments are interpolated cubic splines explained in Section V.
III. Single Point Based Tracking Algorithm Implementation
The single point based AVJ motion tracking algorithm is implemented based on the intensity correlation between the tracking areas of two subsequent frames [5]. In Matlab, cross correlation or normalized one can be used for the tracking. In the ITK implementation of this paper, a similar version of the correlation calculation function itk::FFTNormalizedCorrelationImageFilter is used. This filter works in arbitrary dimension of images. In this software tool development, the dimension for the filter is set to 2. In the first frame, a small region is manually selected to start tracking. In the next frame, the mask rectangle will automatically move to the most correlated region. Since the AVJ does not move beyond 10mm between two subsequent frames in time resolution from 25f/cardiac cycle to 40f/cardiac cycle of CMR images, the search region in the next frame is set to pixels larger than the current frame by 10mm including for resampled images.
IV. 3D Reconstruction of Tracked Points
In order to perform surface area based tracking, we need to reconstruct the 3D coordinate information for 6 tracked points by using the functionality provided by ITK and VTK. We first extract the “Image Orientation (Patient)” parameter from DICOM images for all the 4-, 3- and 2-chamber views, and then represent it as a  matrix incorporating both rotation and translation. The corresponding VTK actors are transformed by using the transformation matrix for visualization purpose. For surface area calculation, we use a VTK class vtkTransform to transform the 6 tracked points in the original 2D image plane of the chamber views to 3D world coordinate system by using the
  matrix. In this way, the 3D coordinate information for the 6 tracked points is reconstructed which is used for the input for the surface area calculation as illustrated in the next section.
V. Tracking By Surface Area
Since we use 6 points to estimate surface areas, we first perform interpolation based on the 6 points by using a parametric cubic spline fitting technique and divide the fitted curve into 6 splines. While we perform the fitting, we keep the 6 splines to have the property of  and
and  continuity.
A. Curve Fitting By Parametric Cubic Splines
Let the representation of a point in the cubic curve be the following parametric form
 |
Therefore by taking the first derivative we have
 |
Let
 |
After we represent the position and first derivative corresponding to the points of  and 1, we obtain the equation as follows
 |
Let
 |
and
 |
we obtain the following equation for matrix 
 |
After we obtain the final representation of matrix  , we compute each point in the parametric cubic splines by the equation as follows
 |
where  , and
, and  .
.
In order to keep  and
and  continuity for the 6 splines we make the positions and first derivatives to be the same at the control points while we construct the matrix
  . For the actual estimation of the first derivatives we use the following equation
 |
where  are the
  coordinates of the 6 control points.
B. Point Interpolation
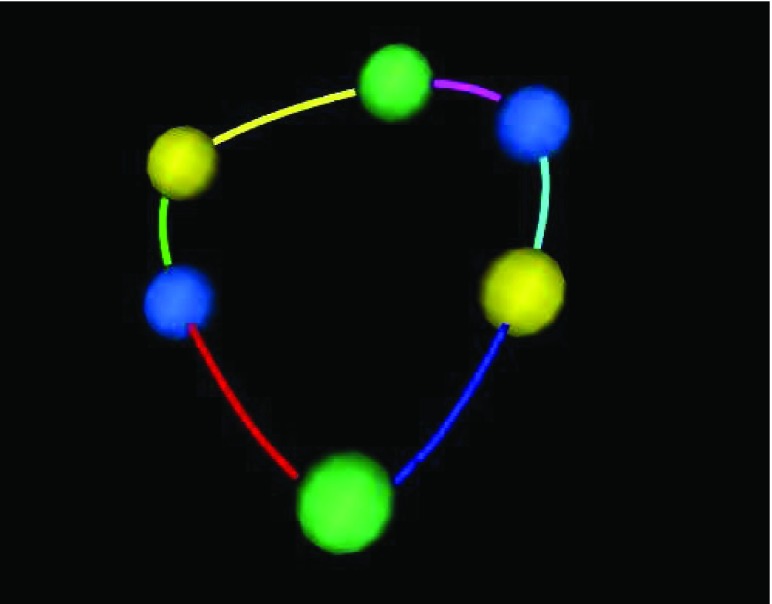
Since we have obtained the representation for each point in the parametric cubic splines as in Equation (5), we are able to perform the point interpolation calculation for all the 6 splines. In each spline, we interpolate 7 points. Therefore, totally there are 48 points for the 6 cubic splines based on the 6 control points obtained. A curve fitting result is shown in Figure 6.
FIGURE 6.
A curve fitting result for all the interpolated points. The 6 splines all have  and
and  continuity. The 6 tracked points and 6 segments are represented in different colors. For the 6 tracked points, yellows are from 4-chamber; greens are from 3-chamber; and blues are from 2-chamber. The names for the 6 segments are: green - IS-I; red - I-IL; blue - IL-AL; cyan - AL-A; magenta - A-AS; yellow - AS-IS. A: anterior; AS: anteroseptal; I: inferior; IS: inferoseptal; IL: inferolateral; AL: anterolateral.
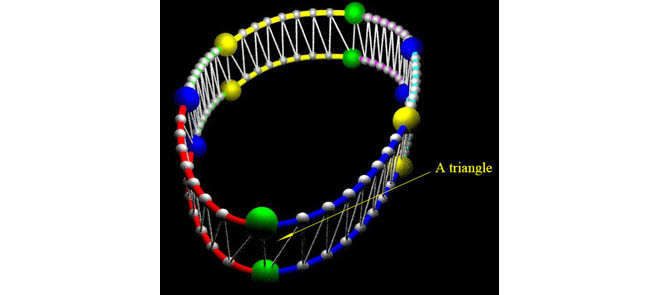
C. Surface Area Calculation
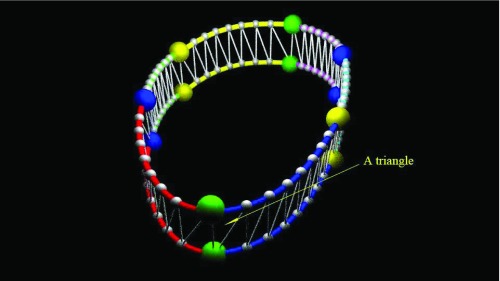
The sweep surface area (SSA) for two subsequent time points is shown in Figure 7. We calculate the surface area swept by 6 tracked points between two subsequent time points by summing up the small triangles by connecting the interpolated points of two consequent parametric cubic curves. The surface area for each small triangle is calculated by using the dot and cross products of the adjacent vectors for a particular point. After we obtain the surface area between two time points, to track the surface area changes in one cardiac cycle we define the surface area to be negative in the systole phase and to be positive in the diastole phase. Based on this definition, we then calculate the accumulated sum of the signed surface areas for all time points and obtain the final tracking results.
FIGURE 7.
The sweep surface area (SSA) for two subsequent time points, which is defined as the summation of the small triangles as shown in the figure. For each of the 6 splines, we interpolate 7 points. There are totally 48 points. The small triangles are defined based on the interpolated points. The sign of SSA is defined similarly as for the sign of the displacement in single point based tracking: being negative for the systole phase and positive for the diastole phase.
VI. Experiments and Results
We performed experiments for (1) single point based tracking; (2) reproducibility test for surface area based tracking by using 6 tracked points vs single point based tracking; and comparison test for semi-auto vs manual.
A. Data
All data used in our experiments was acquired in National Heart Centre Singapore (NHCS).
For the data used in single point based tracking and reproducibility test for surface area based tracking by using 6 tracked points vs single point based tracking, the CMR scans were performed using steady-state free precession (SSFP) balanced turbo field echo (BTFE) sequences. All subjects were imaged on a 3T magnetic resonance imaging (MRI) system (Ingenia, Philips Healthcare, Netherlands) with a dStream Torso coil (maximal number of channels 32). BTFE end-expiratory breath hold cine images were acquired in multi-planar long-axis views (namely 4-, 3- and 2-chamber views). The following typical sequence parameters were used: TR/TE 3/1 ms, flip angle 45°, slice thickness 8 mm for both short- and long-axis, frame rate 30 or 40 frames per cardiac cycle. The 4-, 3- and 2-chamber views of a normal control are shown in Figure 8.
FIGURE 8.
CMR acquisition for a normal control. (a) Long-axis 4-chamber view. (b) Long-axis 3-chamber view. (c) Long-axis 2-chamber view.
For the data used in comparison test for semi-auto vs manual, the MRI scanning was performed using steady-state free precession (SSFP) cine gradient echo sequences. Subjects were imaged on a 1.5T Siemens scanner (Avanto, Siemens Medical Solutions, Erlangen, Germany). Some preliminary short-axis acquisitions were used to locate the plane passing through the mitral and aortic valves. The following planes (ventricular 2-chamber, 3-chamber, 4-chamber and short-axis planes with 12–14 equidistant slices covering both ventricles) were acquired. Each slice was acquired in a single breath hold, with 25 temporal frames per cardiac cycle.
B. Single Point Based Tracking
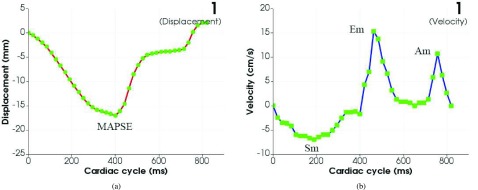
We first demonstrate the single point based tracking algorithm by using a cine CMR image in DICOM format to track a small region in a 4-chamber long axis view with 40f/cardiac cycle for a normal control. The quantitative measurement results of the AVJ motion including displacement and velocity are shown in Figure 9. The measurement results are a good indication of one cardiac cycle for a healthy control including systole and diastole. The displacement achieves its minimum, mitral annular plane systolic excursion (MAPSE), in the middle of the cardiac cycle. The AVJ returns to its start position in the end of the cycle. The velocity achieves its minimum, peak systolic (Sm), in the first half of the cycle; and reaches two maxima, peak early diastolic (Em) and peak late diastolic (Am) respectively, in the second half of the cycle. As shown in the figure the displacement generated is very smooth. The tracking results is consistent with the smoothness of the actual AVJ motion as displayed in the CMR image. Tracking experiments for other small regions in the CMR image and other CMR images with different time resolution have also been performed. The processing time for each tracking takes 20 seconds on a normal PC. The experimental results show that the software tool is very robust in the single point based AVJ tracking for movies with different time resolution from 25f/cardiac cycle to 40f/cardiac cycle.
FIGURE 9.
Single point based tracking results. (a) Displacement. (b) Velocity.
C. Surface Area Based Tracking: Reproducibility and Comparison Tests
While performing surface area based tracking experiments, we first conducted 6 times of single point based tracking for 6 manually selected single points in AVJ region. The curve fitting results for the 6 tracked points are shown in Figure 6. In the figure, the 6 tracked points and 6 segments generated while conducting surface area based tracking are all represented in different colors. For the 6 tracked points, yellows are from 4-chamber; greens are from 3-chamber; and blues are from 2-chamber. The names for the 6 segments are: green – IS-I; red – I-IL; blue – IL-AL; cyan – AL-A; magenta – A-AS; yellow – AS-IS. A: anterior; AS: anteroseptal; I: inferior; IS: inferoseptal; IL: inferolateral; AL: anterolateral.
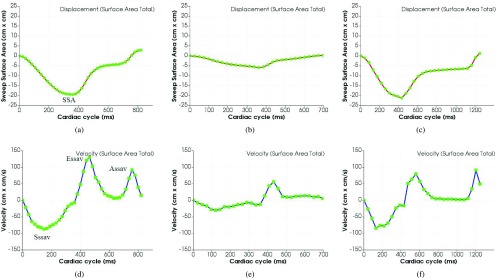
We first performed reproducibility test for surface area based tracking by using 6 tracked points vs single point based tracking. We used 10 controls, 10 HF with reduced ejection fraction (HFrEF) cases, and 10 HF with preserved ejection fraction (HFpEF) cases for comparison. We measured 4 parameters for the reproducibility test include SSA, Sssav, Essav and Assav as shown in Figure 12 (a) and (d) corresponding to MAPSE, Sm, Em and Am in single point based tracking results.
FIGURE 12.
Surface area based tracking results for summing up of the whole 6 segments. (a), (b) and (c) are for surface area; (d), (e) and (f) are for velocity. From the figure we can see that the surface area based tracking curves for whole 6 segments are smoother than the single point based tracking curve for displacement. The velocity figure gives a clean indication for Sssav, Essav and Assav velocities. There is a clear difference between normal and HFrEF in terms of both surface area and velocity; the difference between normal and HFpEF can be identified by the ratio of Essav and Assav in the velocity curves.
For inter-observer variability study, the analysis was repeated by a second-independent observer using the software tool, blinded to the first observer’s results. For intra-observer variability study, the analysis was repeated by the same observer who re-analyzed the same 30 cases after 7 days. The data was analyzed using SPSS (version 17.0, Chicago, IL, USA). All values were presented as mean +/− SD. To evaluate the reproducibility of the obtained measurements, intra-observer and inter-observer variability were studied for the 30 cases (10 for controls, HFrEFs and HFpEFs each) using the Pearson’s r correlation, Bland-Altman analysis, intra-class correlation coefficient (ICC) and coefficient of variation (COV).
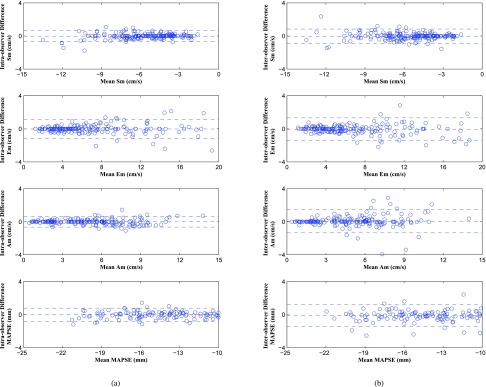
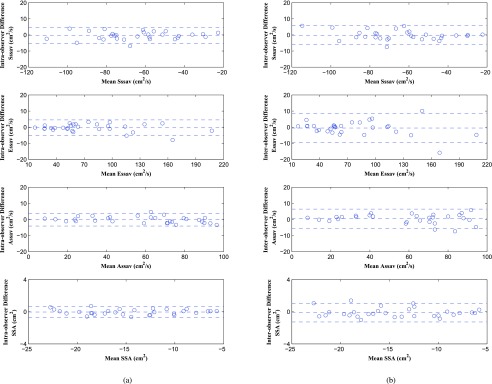
We obtained consistent tracking results for controls, HFrEFs and HFpEFs. The experimental results for 10 controls, 10 HFrEFs and 10 HFpEFs are shown as follows. The statistical analysis results are shown in Table 1. In the table, the first 4 rows of Sssav, Essav, Assav and SSA are for surface area based tracking by using 6 tracked points; and the second 4 rows of Sm, Em, Am and MAPSE are for single point based tracking. From the table we can see that surface area based tracking consistently performs better than single point based tracking in both intra-observer and inter-observer reproducibility test. Bland Alman Plots for intra- and inter-observer variability obtained for single point based tracking are shown in Figure 10; the plots for surface area based tracking are shown in Figure 11. In Figure 10, there are totally 180 small circles (representing 6 points for each case, 30 cases in total) for each parameter. In Figure 11, totally 30 small circles (for 30 cases in total) are displayed for each parameter. From the plots we can see that surface area based tracking produces better reproducibility results than single point based tracking.
TABLE 1. The Statistical Analysis Results for Reproducibility Test.
| Intra-observer (10 controls + 10 HFrEFs + 10 HFpEFs) | Inter-observer (10 controls + 10 HFrEFs + 10 HFpEFs) | |||||||
|---|---|---|---|---|---|---|---|---|
| r | Bias | ICC (95% CI) | COV (%) | r | Bias | ICC (95% CI) | COV (%) | |
| Sssav | 0.993 | −0.48 (−5.44 to 4.48) | 0.997 (0.993 to 0.998) | 2.7 | 0.992 | −0.21 (−6.11 to 5.69) | 0.996 (0.991 to 0.998) | 3.2 |
| Essav | 0.999 | −0.40 (−5.27 to 4.48) | 0.999 (0.999 to 1.000) | 2.2 | 0.996 | −0.54 (−9.46 to 8.38) | 0.998 (0.995 to 0.999) | 4.0 |
| Assav | 0.998 | −0.19 (−4.09 to 3.71) | 0.999 (0.997 to 0.999) | 2.3 | 0.994 | 0.46 (−5.50 to 6.43) | 0.997 (0.993 to 0.998) | 3.6 |
| SSA | 0.998 | −0.03 (−0.70 to 0.63) | 0.999 (0.998 to 0.999) | 1.6 | 0.993 | −0.11 (−1.28 to 1.06) | 0.997 (0.993 to 0.998) | 2.9 |
| Sm | 0.990 | −0.03 (−0.71 to 0.66) | 0.995 (0.993 to 0.996) | 4.2 | 0.983 | −0.03 (−0.90 to 0.84) | 0.991 (0.989 to 0.994) | 5.4 |
| Em | 0.990 | −0.02 (−1.17 to 1.13) | 0.995 (0.994 to 0.996) | 5.9 | 0.986 | −0.05 (−1.43 to 1.32) | 0.993 (0.991 to 0.995) | 7.0 |
| Am | 0.993 | −0.01 (−0.65 to 0.62) | 0.997 (0.996 to 0.998) | 4.4 | 0.967 | 0.07 (−1.34 to 1.48) | 0.983 (0.977 to 0.987) | 9.8 |
| MAPSE | 0.996 | −0.03 (−0.84 to 0.78) | 0.998 (0.997 to 0.999) | 2.4 | 0.990 | −0.09 (−1.42 to 1.24) | 0.995 (0.993 to 0.996) | 4.0 |
FIGURE 10.
Bland Alman Plots for intra- and inter-observer variability obtained for single point based tracking results: Sm, Em, Am and MAPSE. (a) Intra-observer Variability. (b) Inter-observer Variability.
FIGURE 11.
Bland Alman Plots for intra- and inter-observer variability obtained for surface area based tracking results: Sssav, Essav, Assav and SSA. (a) Intra-observer Variability. (b) Inter-observer Variability.
We also performed comparison test for semi-auto vs manual. We used 10 controls for the test. The experimental results show 90% correlation between semi-auto and manual in terms of 6 points based sweep surface area during tracking.
Finally, to demonstrate the difference among controls, HFrEF cohort and HFpEF cohort, we show the surface area based tracking results by using 3 cases each from controls, HFrEFs and HFpEFs as illustrated in the following paragraphs and figures.
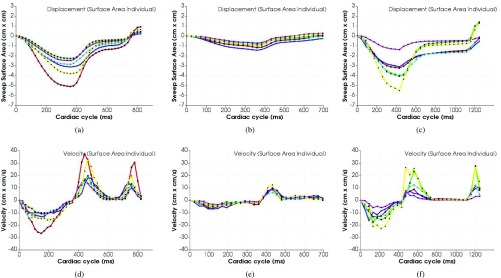
Figure 12 shows the surface area tracking results for summing up of the whole 6 segments. The surface area based tracking results for each individual of the 6 segments are shown in Figure 13.
FIGURE 13.
Surface area tracking results for each individual of the 6 segments. (a), (b) and (c) are for surface area; (d), (e) and (f) are for velocity. Different colors of the curves represent the surface area and velocity for the corresponding segments as defined in Figure 6.
From the track results as shown in Figure 12, we can see that the surface area based tracking curves for whole 6 segments are smoother than the single point based tracking curve for displacement, which demonstrates more accurate and reliable results for AVJ motion tracking. The velocity figures give a clean indication for Sssav, Essav and Assav velocities. The surface areas and velocities for each individual of the 6 segments are pretty consistent as shown in Figure 13.
By comparison of the tracking results for normal, HFrEF and HFpEF as shown in Figure 12, we can see a clear difference between normal and HFrEF in terms of both surface area and velocity; even though the curves of surface area and velocity for normal and HFpEF look similar, we still can see the obvious difference in terms of the ratio of Essav and Assav in the velocity curves.
VII. Conclusion
In this paper, a software tool for AVJ tracking is presented by using ITK, VTK and Qt. Alongside single point based tracking, our software tool also allows the user to perform AVJ motion analysis based on the surface areas swept by 6 points in 4-, 3- and 2-chamber views with 2 points in each view. The surface area based tracking results are global in 3D and are able to provide more accurate and reliable analysis results for AVJ motion tracking. By quantitatively measuring AVJ motion through tracking it is demonstrated that ITK, VTK and Qt are very convenient software systems to use for automatic image analysis for CMR images.
Biographies

Pengdong Xiao received the bachelor’s degree in mechanical engineering from the China University of Mining and Technology in 1987, the master’s degree in mechatronics (robotics) from the Chongqing Institute of Architecture and Engineering in 1990, the master’s degree in computer science from the National University of Singapore in 2002, the Ph.D. degree in mechanical engineering from Chongqing University, China, in 1993, and the Ph.D. degree in information engineering from Australian National University in 2011. He held post-doctoral position with Tsinghua University, China, and Nanyang Technological University, Singapore, four years. He subsequently acquired many years of research experience in both academic institutions and industry, including the University of North Carolina, Chapel Hill, USA, Data61, Australia, A*Star, Singapore, Biobot Surgical, Sybase, and Motorola. He was a Visiting Scientist with the Data61, CSIRO, Australia. He is currently a Research Fellow with the National Heart Research Institute Singapore, National Heart Center Singapore, Singapore. His research interests include medical image analysis and medical robotics.

Xiaodan Zhao received the Ph.D. degree in computational mathematics from Nanyang Technological University. She is currently a Research Fellow with the National Heart Center Singapore. Her research interest includes medical image processing and numerical partial differential equations.

Shuang Leng received the Ph.D. degree in engineering. He is currently a Researcher with the National Heart Center Singapore. His research interests include biomedical image and signal processing.

Ru San Tan is currently a cardiologist with the National Heart Center Singapore and holds concurrent appointments as a Deputy Director with the National Heart Research Institute of Singapore, and an Adjunct Associate Professor with the Duke-National University Singapore Graduate Medical School Singapore. He specializes in noninvasive cardiovascular imaging (echocardiography and magnetic resonance imaging), and leads a team of scientists involved in bioengineering and cardiovascular imaging research. He is an experienced clinical trialist and site principal investigator of several multicentre cardiology clinical trials.

Philip Wong is currently a Senior Consultant with the National Heart Center Singapore, with specialization in the field of interventional cardiology. He is a keen Clinician Innovator with experience in medical device development and has been a study PI for over 100 large animal studies. He is also an Adjunct Professor with the Nanyang Technology University Singapore, where he teaches development of medical devices. He is also an Associate Professor with the Duke-NUS Graduate Medical School. His primary research interest includes use of digital health platforms for improving patient care and monitoring, development of pre-clinical models of drug validation, and medical device testing.

Liang Zhong received the Ph.D. degree from Nanyang Technological University in 2005. He is currently a Principal Investigator with the National Heart Center Singapore, where he is also involved in directing cardiovascular bioengineering theme. He is a Committee Member of ISMRM (Singapore Chapter) and the Vice Chairman of Engineering in Medicine and Biology Society (Singapore Chapter). His research interests include advanced cardiac imaging, cardiovascular biomechanics, computational fluid dynamics, and coronary circulation in health and disease. His research is funded by competitive funds from the National Medical Research Council, the Biomedical Research Council, and the National Research Foundation.
Funding Statement
This work was supported by the National Medical Research Council Singapore under Grant NMRC/MOHIAFCAT2/0002/2014. The research is funded by National Medical Research Council Singapore (NMRC/MOHIAFCAT2/0002/2014) and (NMRC/OFIRG/0018/2016).
Contributor Information
Pengdong Xiao, Email: xiao.pengdong@nhcs.com.sg.
Liang Zhong, Email: zhong.liang@nhcs.com.sg.
References
- [1].Flachskampf F. A., Biering-Sørensen T., Solomon S. D., Duvernoy O., Bjerner T., and Smiseth O. A., “Cardiac imaging to evaluate left ventricular diastolic function,” JACC Cardiovascular Imag., vol. 8, no. 9, pp. 1071–1093, 2015. [DOI] [PubMed] [Google Scholar]
- [2].Singh A., Addetia K., Maffessanti F., Mor-Avi V., and Lang R. M., “LA strain for categorization of LV diastolic dysfunction,” JACC Cardiovascular Imag., vol. 10, no. 7, pp. 735–743, Dec. 2016, doi: 10.1016/j.jcmg.2016.08.014. [DOI] [PMC free article] [PubMed] [Google Scholar]
- [3].Abdul-Rahim A. H.et al. , “Risk of stroke in chronic heart failure patients with preserved ejection fraction, but without atrial fibrillation: Analysis of the CHARM-preserved and I-preserve trials,” Eur. Heart J., vol. 38, no. 10, pp. 742–750, 2017. [DOI] [PMC free article] [PubMed] [Google Scholar]
- [4].Solomon S. D. and Biering-Sørensen T., “LA strain when ejection fraction is preserved: A new measure of diastolic function?” JACC Cardiovascular Imag., vol. 10, no. 7, pp. 744–746, 2017. [DOI] [PubMed] [Google Scholar]
- [5].Wu V., Chyou J. Y., Chung S., Bhagavatula S., and Axel L., “Evaluation of diastolic function by three-dimensional volume tracking of the mitral annulus with cardiovascular magnetic resonance: Comparison with tissue Doppler imaging,” J. Cardiovascular Magn. Reson., vol. 16, p. 71, Aug. 2014. [DOI] [PMC free article] [PubMed] [Google Scholar]
- [6].Wu V.et al. , “Global diastolic function in endurance athletes: Three-dimensional volume tracking of the mitral annulus with cine-CMR,” J. Cardiovascular Magn. Reson., vol. 17, nos. 1–Q6, pp. 1–3, Feb. 2015. [Google Scholar]
- [7].Leng S., Zhao X. D., Tan R. S., and Zhong L., “Novel method for atrioventricular motion assessment from three-dimensional cine magnetic resonance imaging,” in Proc. 37th Annu. Int. Conf. IEEE Eng. Med. Biol. Soc. (EMBC), Apr. 2015, pp. 319–322. [DOI] [PubMed] [Google Scholar]
- [8].Leng S.et al. , “Automated quantitative assessment of cardiovascular magnetic resonance-derived atrioventricular junction velocities,” Amer. J. Physiol. Heart Circulatory Physiol., vol. 309, no. 11, pp. 1923–1935, 2015. [DOI] [PubMed] [Google Scholar]
- [9].Zhao X. D., Leng S., Tan R. S., and Zhong L., “Computer-based assessment of ventricular mechanical synchrony from magnetic resonance imaging,” in Proc. 37th Annu. Int. Conf. IEEE Eng. Med. Biol. Soc. (EMBC), Sep. 2015, pp. 6536–6539. [DOI] [PubMed] [Google Scholar]
- [10].ITK Software Guide, ITK Software Guide, Kitware, New York, NY, USA, Aug. 2017. [Google Scholar]
- [11].Insight Segmentation and Registration Toolkit (ITK). Accessed on Aug. 2017. [Online]. Available: http://www.itk.org/
- [12].The Visualization Toolkit (VTK). Accessed on Aug. 2017. [Online]. Available: http://www.vtk.org/
- [13].Qt Library. Accessed on Aug. 2017. [Online]. Available: http://www.qt.io/
- [14].Xiao P. D.et al. , “Atrioventricular junction (AVJ) motion tracking: A software tool with ITK/VTK/Qt,” in Proc. 38th Annu. Int. Conf. IEEE Eng. Med. Biol. Soc. (EMBC), Aug. 2016, pp. 4141–4144. [DOI] [PubMed] [Google Scholar]


