

In this study, Murakami et al. investigate the kinetics and dynamics of p300-dependent enhancer assembly and function by using selective loss- or gain-of-function mutants of ERα to define two distinct phases of ligand-dependent enhancer formation. Their results reveal an ordered and cooperative assembly of ERα enhancers requiring functional interplay among p300, Mediator, and SRCs, which has implications for hormone-dependent gene regulation in breast cancers.
Keywords: coregulator, breast cancer, enhancer, estrogen receptor α (ERα), p300/CBP, transcription
Abstract
Although many features of active transcriptional enhancers have been defined by genomic assays, we lack a clear understanding of the order of events leading to enhancer formation and activation as well as the dynamics of coregulator interactions within the enhancer complex. Here, we used selective loss- or gain-of-function mutants of estrogen receptor α (ERα) to define two distinct phases of ligand-dependent enhancer formation. In the first phase (0–20 min), p300 is recruited to ERα by Mediator as well as p300's acetylhistone-binding bromodomain to promote initial enhancer formation, which is not competent for sustained activation. In the second phase (20–45 min), p300 is recruited to ERα by steroid receptor coregulators (SRCs) for enhancer maturation and maintenance. Successful transition between these two phases (“coregulator switching”) is required for proper enhancer function. Failure to recruit p300 during either phase leads to abortive enhancer formation and a lack of target gene expression. Our results reveal an ordered and cooperative assembly of ERα enhancers requiring functional interplay among p300, Mediator, and SRCs, which has implications for hormone-dependent gene regulation in breast cancers. More broadly, our results demonstrate the unexpectedly dynamic nature of coregulator interactions within enhancer complexes, which are likely to be a defining feature of all enhancers.
Transcription factors (TFs) control cell type-specific gene transcription by binding to their cognate DNA motifs in chromatin and nucleating enhancer formation by recruiting a set of transcriptional coregulators (Reiter et al. 2017). In many cases, enhancer formation and activation occur as an endpoint of cellular signaling pathways, allowing integration of extracellular cues with intracellular responses (Heinz et al. 2015). Despite wide variation in the types of TFs that may be expressed in a given cell, the enhancers that they form share several common features (Shlyueva et al. 2014; Heinz et al. 2015). For example, enhancers are enriched with a common set of histone modifications or “marks,” including histone H3 Lys4 monomethylation (H3K4me1) and H3K27 acetylation (H3K27ac) (Heintzman et al. 2009). Enhancers are also enriched with a common set of coregulators, such as the bromodomain-containing lysine acetyltransferases p300 and CBP (referred to collectively as p300/CBP), the RNA polymerase II (Pol II)-binding Mediator complex, and the ATP-dependent chromatin-remodeling complexes Swi/Snf (Heintzman et al. 2009; Visel et al. 2009; Reiter et al. 2017). While some of these features may be found at enhancers prior to full activation, others are further enriched or occur only in response to cellular signaling events (Heinz et al. 2015).
Recent studies have focused on additional enhancer features that generally correlate with enhancer activity, such as enhancer transcription and looping to target gene promoters. Genomic assays have revealed that many enhancers bound by Pol II are actively transcribed, producing enhancer RNAs (eRNAs) (De Santa et al. 2010; Kim et al. 2010; Hah et al. 2011), and loop to nearby target genes (Kulaeva et al. 2012). While looping may provide a logical framework for enhancer–promoter communication, the function of enhancer transcription is less clear. Three models have been proposed: (1) The act of enhancer transcription may help to open the chromatin and allow enhancer formation, (2) the eRNAs may act in cis at the enhancer from which they were transcribed to regulate enhancer function, or (3) the eRNAs may act in trans as regulatory RNAs to control promoter function (Kim and Shiekhattar 2015). Regardless of what the function is, enhancer transcription represents a robust mark of active enhancers that can be used to track enhancer activity (Wang et al. 2011; Hah et al. 2013; Kim and Shiekhattar 2015). Although the features noted above (i.e., TF binding, enrichment of histone marks, coregulator recruitment, enhancer transcription, and looping) are readily identifiable, they provide only cryptic clues to enhancer biology. We lack a clear and detailed understanding of (1) the order of events leading to enhancer formation and activation, (2) the specific roles of each coregulator and feature enriched at an enhancer, and (3) the functional interrelationships among them.
Estrogen receptor α (ERα), a member of the nuclear receptor superfamily, is a ligand-regulated TF that is activated by binding to estrogenic ligands, including 17β-estradiol (E2) (Nilsson et al. 2001; Burns and Korach 2012). Within minutes of ligand-dependent activation, ERα dimerizes, binds to genomic DNA in chromatin, and promotes the formation of enhancers at the ERα-binding sites to rapidly and transiently induce the transcription of target genes (Nilsson et al. 2001; Hah et al. 2011). Like the enhancers formed by other TFs, ERα enhancers are associated with the shared enhancer features noted above, including coregulators that associate with ERα in response to estrogen (Hah et al. 2013; Dasgupta et al. 2014). Mediator and the steroid receptor coregulators (SRCs) are two of the best-studied ERα coregulators, both of which interact directly with ERα through α-helix 12 in the major transactivation domain (i.e., activation function 2 [AF-2]) of the ligand-binding domain (LBD) (Shiau et al. 1998; Kang et al. 2002; Malik and Roeder 2010; Dasgupta et al. 2014).
The Mediator complex, which binds to ERα through the Med1 subunit, interacts with Pol II and may interact with regulatory RNAs to promote enhancer–promoter looping (Malik and Roeder 2010; Chen and Roeder 2011; Lai et al. 2013). In contrast, the SRCs serve as scaffold proteins to recruit additional coregulators (many of which possess protein-modifying activities) to ERα-binding sites, including p300/CBP (Dasgupta et al. 2014; Yi et al. 2015). The interactions of p300/CBP with ERα are mediated through the SRC proteins (Kim et al. 2001; Dancy and Cole 2015; Yi et al. 2015). p300/CBP acetylates histones, TFs, and other coregulators and have also been used as a mark of active enhancers (Visel et al. 2009; Dasgupta et al. 2014; Dancy and Cole 2015). Amplifications, mutations, and aberrant functions of Mediator, SRCs, and p300/CBP have been implicated in some types of cancers, including hormone-dependent cancers (Anzick et al. 1997; Barbieri et al. 2012; Dasgupta et al. 2014). Indeed, p300 is one of the most commonly mutated genes across cancer types, including breast cancers (Kandoth et al. 2013; Chang et al. 2016).
Understanding the dynamics of enhancer formation and function is a critical component of our overall understanding of enhancer biology. In the studies described here, we used selective loss- or gain-of-function ERα mutants combined with genomic and molecular biology assays to dissect the order of assembly and activation of ERα enhancers as well as the downstream biology.
Results
ERα L540Q (ERαLQ) selectively recruits Mediator, but not SRCs, to ERα-binding sites
To gain a better understanding of the molecular mechanisms that lead to the assembly and activation of enhancers at TF-binding sites across the genome, we used ERα as a model signal-regulated TF. We applied a set of complementary sequencing-based genomic assays and quantitative PCR (qPCR)-based locus-specific molecular assays in time-course experiments designed to explore the kinetics of ERα enhancer assembly. We hypothesized that a selective loss-of-function ERα mutant defective in one activity, but not others, might provide unique insights into the order of enhancer assembly. ERαLQ is one such mutant, which retains ligand, DNA, and Mediator binding but is impaired in SRC binding, as determined by biochemical and cell-based assays (Ince et al. 1993; Schodin et al. 1995; Acevedo et al. 2004). As a result, ERαLQ exhibits reduced E2-dependent transcription (Ince et al. 1993; Schodin et al. 1995; Acevedo et al. 2004).
For our studies with this mutant ERα, we used previously described ERα-negative MDA-MB-231 breast cancer cells expressing either ERα wild type (ERαWt) or ERαLQ (231/ERαWt and 231/ERαLQ cells, respectively) (Acevedo et al. 2004). To examine the selective loss of function of ERαLQ at ER-binding sites genome-wide, we performed ChIP-seq (chromatin immunoprecipitation [ChIP] combined with high-throughput sequencing) for ERα, Med1, SRCs (using a “pan” SRC antibody), and p300 in both 231/ERαWt and 231/ERαLQ cells after 45 min of E2 treatment (note that Med1, SRCs, and p300 are expressed to similar levels in both cell types) (Supplemental Fig. S1). As expected, we observed E2-dependent binding of both ERαWt and ERαLQ to genomic loci, with considerable overlap between the sites of ERα binding between the two cell lines (Fig. 1A,B; Supplemental Figs. S2A,B, S3A,B). In addition, we observed E2-dependent recruitment of Mediator (i.e., Med1) by both ERαWt and ERαLQ when filtered for common sites with similar levels of ERα binding (Fig. 1A,B; Supplemental Fig. S3A,B). ERαWt also exhibited robust E2-dependent recruitment of SRC and p300, whereas ERαLQ exhibited significantly reduced recruitment of SRC and p300 (Fig. 1A,B; Supplemental Fig. S3A,B). Similar results were observed for individual SRC proteins (i.e., SRC1, SRC2, and SRC3) and CBP in ChIP-qPCR assays (Supplemental Figs. S4, S5). Thus, ERαLQ is a selective loss-of-function mutant genome-wide.
Figure 1.

Reduced SRC recruitment at ERαLQ-binding sites impairs enhancer formation and target gene transcription. (A) SRC and p300 recruitment is impaired at ERαLQ-binding sites. ChIP-seq browser tracks for ERα, Med1, SRC (pan), and p300 at the OTUB2 locus in 231/ERαWt and 231/ERαLQ cells with or without E2 for 45 min. (B) Box plots of ERα, Med1, SRC (pan), and p300 ChIP-seq read counts with or without 45 min of E2 treatment at ERα-binding sites shared between 231/ERαWt and 231/ERαLQ cells. Box plots marked with different letters (a, b, and c) are significantly different from each other. P < 2.2 × 10⁻¹⁶, Wilcoxon rank-sum test. (C) ERαLQ exhibits impaired transcriptional activity. Venn diagram showing the number of genes significantly regulated by 45 min of E2 treatment in 231/ERαWt and 231/ERαLQ cells as measured by global run-on sequencing (GRO-seq). False discovery rate = 0.05. (D) Box plots showing the read counts for 367 genes up-regulated by ERαWt, but not the ERαLQ mutant, upon E2 treatment, as shown in C. Box plots marked with different letters (a, b, and c) are significantly different from each other. P < 1.54 × 10⁻⁵, Wilcoxon rank-sum test. (E) Browser tracks of the OTUB2 locus in 231/ERαWt (left) and 231/ERαLQ (right) cells showing ERα ChIP-seq after 45 min of E2 treatment and GRO-seq with a time-course E2 treatment.
Impaired SRC recruitment results in impaired E2-dependent transcription
Although previously characterized as a transcriptionally dead dominant-negative mutant in cell-based reporter gene assays (Ince et al. 1993; Schodin et al. 1995), ERαLQ has not been examined genome-wide in sequencing-based transcription assays. To determine how the impaired recruitment of SRC-p300/CBP observed with ERαLQ affects E2-dependent gene transcription, we used global run-on sequencing (GRO-seq), a genomic assay that detects sites of active transcription across the genome (Core et al. 2008). We treated 231/ERαWt and 231/ERαLQ cells with E2 for 0, 20, and 45 min and then subjected them to GRO-seq. We identified 1240 genes with significant E2-dependent regulation (up or down) in 231/ERαWt cells after 45 min of treatment (Fig. 1C). In total, 747 genes were uniquely regulated by E2 in 231/ERαWt cells versus 231/ERαLQ cells, of which about half were up-regulated (Fig. 1C,D).
Surprisingly, we also identified 788 genes with significant E2-dependent regulation in 231/ERαLQ cells (Fig. 1C; Supplemental Fig. S3C). The majority of these genes was a subset of the genes regulated in 231/ERαWt cells, although we observed some uniquely regulated genes as well (Fig. 1C,D; Supplemental Fig. S3C,D). We considered two sets of ERαLQ-regulated genes: (1) those regulated by both ERαWt and ERαLQ and (2) those regulated by ERαLQ only (Supplemental Fig. S3D). In ChIP-seq assays, we observed impaired recruitment of SRCs at ERα-binding sites located near the genes regulated by both ERαWt and ERαLQ but not at ERα-binding sites located near the genes regulated by ERαLQ only (Supplemental Fig. S6). These results suggest that the ERα enhancers regulating the expression of these genes may have an alternate mechanism for recruiting SRCs. They also suggest that SRCs are not sufficient for the activation of these genes because ERαWt recruits SRCs to these binding sites but does not promote E2-dependent gene transcription.
In spite of the transcriptional activity of ERαLQ with some genes, the extent of up-regulation was significantly less than the extent of up-regulation with ERαWt, especially for the 45-min time point (Fig. 1D). Thus, the selective loss of SRC–p300 binding by ERαLQ results in impaired E2-dependent transcription for a major subset of ERα target genes. For the purposes of this study, we focused on the genes up-regulated by E2 treatment only in the 231/ERαWt cells to compare enhancer formation by ERαWt versus ERαLQ.
ERαLQ supports a subset of active enhancer features in spite of impaired SRC recruitment
The selective recruitment of Mediator versus SRCs with ERαLQ presents an interesting opportunity to dissect the molecular mechanisms of enhancer complex formation, perhaps by producing incompletely formed enhancers. The initial indications of this were manifest in reduced enhancer transcription with ERαLQ, as determined by GRO-seq, at a number of ERα enhancers (Fig. 1E; Supplemental Fig. S3A,B). To explore this in more detail, we surveyed the status of features thought to be indicative of active enhancers, such as Pol II recruitment, enhancer–promoter looping, and H3K27ac enrichment. In ChIP-qPCR assays with five different ERα enhancers, we found that Pol II recruitment by ERαLQ was significantly reduced compared with ERαWt in most cases (Fig. 2A; Supplemental Fig. S7), suggesting that the initiation of enhancer transcription is impaired with ERαLQ. This was also reflected in impaired Pol II loading at target gene promoters with ERαLQ (Supplemental Fig. S8). Thus, we examined additional enhancer features likely to occur before the initiation of enhancer transcription.
Figure 2.

Selective impairment of enhancer features with ERαLQ. (A) Pol II recruitment is impaired at ERαLQ-binding sites. ChIP-qPCR assays for Pol II in 231/ERαWt and 231/ERαLQ cells with or without E2 treatment for 45 min. Each bar represents the mean + SEM for at least three independent biological replicates. Bars marked with different letters (a, b, c, and d) are significantly different from each other. P < 0.05, two-way ANOVA. (B) E2-dependent enhancer–promoter chromatin loop formation is maintained with ERαLQ in spite of impaired SRC recruitment. (Top) Browser tracks for ERα ChIP-seq and GRO-seq in 231/ERαWt cells after 45 min of E2 treatment, shown with the location of the chromatin conformation capture (3C) primers. (Bottom) 3C-qPCR assays showing chromatin looping from a distal ERα-binding site to the OTUB2 promoter in 231/ERαWt and 231/ERαLQ cells with or without 45 min of E2 treatment. Each point represents the mean ± SEM for at least three independent biological replicates. Asterisks indicate significant differences compared with wild type at each genomic location in each condition. P < 0.05, two-way ANOVA. (C) E2-stimulated H3K27ac levels are maintained with ERαLQ in spite of impaired SRC recruitment. ChIP-seq browser tracks for ERα and H3K27ac at the OTUB2 locus in 231/ERαWt and 231/ERαLQ cells treated with E2 for 45 min. (D) Box plots of H3K27ac ChIP-seq read counts at ERα-binding sites shared between 231/ERαWt and 231/ERαLQ cells with or without 45 min of E2 treatment. Box plots marked with different letters (a and b) are significantly different from each other. P < 2.2 × 10⁻¹⁶, Wilcoxon rank-sum test. (E) p300 histone acetyltransferase (HAT) activity is required for E2-stimulated increases of H3K27ac levels. ChIP-qPCR assays for H3K27ac in 231/ERαWt cells with or without E2 treatment for 45 min in the presence of the p300/CBP HAT inhibitor C646. Each bar represents the mean + SEM for at least three independent biological replicates. Bars marked with different letters (a, b, and c) are significantly different from each other. P < 0.05, two-way ANOVA. (F) A table summarizing the features of ERαWt- and ERαLQ-binding sites upon 45 min of E2 treatment. (+) Full or partial (≥50%) activity; (−) no or significantly reduced (<50%) activity.
Enhancer–promoter looping is a mechanism by which distal enhancers communicate with their target gene promoters (Dekker et al. 2002; Ong and Corces 2011). We used chromatin conformation capture (3C)-qPCR assays with five different enhancer–promoter pairs to determine whether ERαLQ is capable of promoting enhancer–promoter looping. Interestingly, ERαLQ promoted E2-dependent looping similar to or even better than ERαWt (Fig. 2B; Supplemental Fig. S9). Likewise, the enrichment of H3K27ac, a histone modification mediated by p300/CBP and used as a mark of active enhancers (Jin et al. 2011; Tang et al. 2013), was similar for ERαWt and ERαLQ, as determined by ChIP-seq (Fig. 2C,D; Supplemental Fig. S3A,B). H3K27ac enrichment was maintained with ERαLQ despite reduced p300 recruitment (Fig. 1A,B; Supplemental Fig. S3A,B). H3K27ac enrichment, however, was reduced in the presence of the p300/CBP acetyltransferase inhibitor C646 (Fig. 2E; Supplemental Fig. S10; Bowers et al. 2010), suggesting p300 activity at an earlier point during ERα enhancer formation. Collectively, these initial studies indicate that ERαLQ is a selective loss-of-function mutant that still supports some aspects of enhancer formation and function (Fig. 2F).
Impaired SRC–p300 recruitment leads to abortive E2-dependent transcription at enhancers and promoters
We showed previously that only a subset of ERα-binding sites is transcribed, indicating that ERα binding, per se, is not sufficient to establish an active enhancer or promote target gene transcription (Hah et al. 2013). To link impaired enhancer formation with ERαLQ to the transcriptional outcomes of target genes, we mined our ERα ChIP-seq and GRO-seq data sets from 231/ERαWt and 231/ERαLQ cells. We started with the 367 genes up-regulated by E2 with ERαWt but not ERαLQ (i.e., ERαWt only) and determined the nearest common ERα-binding site in the regulatory region, assuming that it would control the expression of the neighboring gene (Fig. 3A, right). We then determined the levels of transcription at the ERα-binding sites and the corresponding target genes in 231/ERαWt and 231/ERαLQ cells (Fig. 3A, left). Interestingly, the E2-dependent transcription of the enhancer and the nearest gene were similar for ERαWt and ERαLQ at 20 min of treatment (Fig. 3B). However, continued up-regulation of enhancer and gene transcription at 45 min of treatment was observed only with ERαWt (Fig. 3B). These results indicate a two-component response, with impaired ERαLQ activity evident only during the second component.
Figure 3.
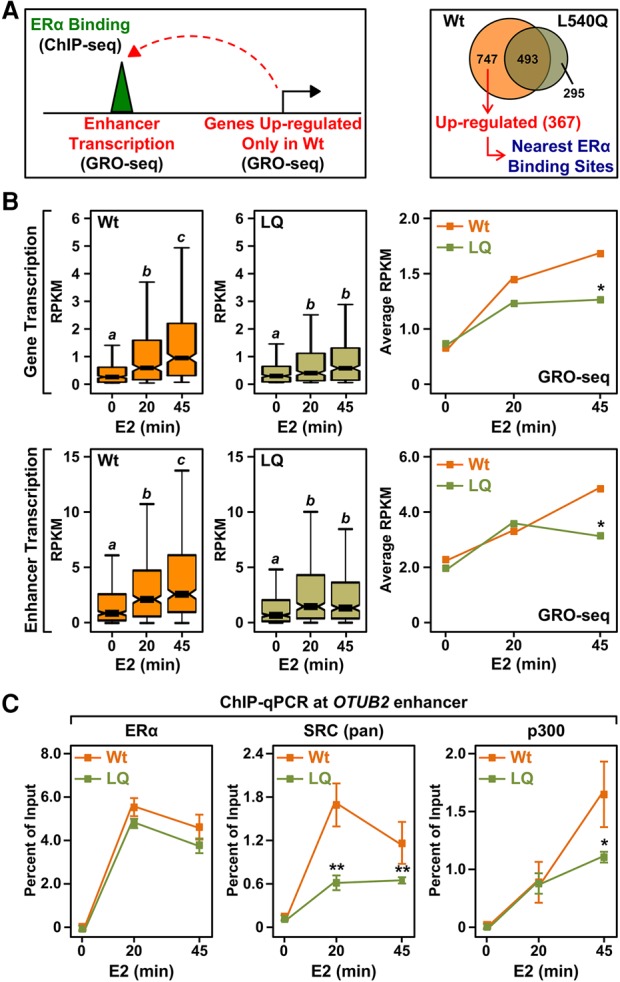
Impaired SRC recruitment with ERαLQ causes abortive enhancer formation and target gene transcription. (A) Schematics of the selection pipeline for the genes and enhancers analyzed in B. Three-hundred-sixty-seven genes up-regulated by E2 only in 231/ERαWt cells (right) were associated with the nearest ERαWt-binding site (left). GRO-seq data for the promoters of the genes and the nearest ERα-binding sites were analyzed as described in B. (B) Box plots (left and middle) and line graphs (right) of GRO-seq-normalized read counts for 367 genes up-regulated by ERαWt, but not by ERαLQ, upon E2 treatment (top) and the nearest ERα enhancers (bottom). (Left and middle) In the box plots, bars marked with different letters (a, b, and c) are significantly different from each other. P < 6 × 10−09, Wilcoxon rank-sum test. (Right) In the line graphs, each point represents the average read counts. Asterisks indicate significant differences compared with wild type at each time point. P < 0.05, Student's t-test. (C) p300 is recruited in an SRC-independent manner during the initial phase of enhancer formation (“enhancer priming”). ChIP-qPCR assays for ERα, SRCs (pan), and p300 in doxycycline (Dox)-inducible 231/ERαWt and 231/ERαLQ cells treated with a time course of E2. Each point represents the mean ± SEM for at least three independent biological replicates. Asterisks indicate significant differences compared with wild type at each time point. (*) P < 0.05; (**) P < 0.0005, two-way ANOVA.
To explore the molecular underpinnings of the abortive transcriptional response at enhancers and promoters with ERαLQ in more detail, we monitored SRC and p300 recruitment by ChIP-qPCR for five different enhancers in 231/ERαWt and 231/ERαLQ cells during the same time course of E2 treatment. As expected, the kinetics of ERαLQ binding to chromatin were comparable with ERαWt (Fig. 3C, left; Supplemental Fig. S11A–E, left). Also as expected, SRC recruitment by ERαLQ was impaired at both time points of E2 treatment (20 and 45 min) (Fig. 3C, middle; Supplemental Fig. S11B–E, middle). In contrast, p300 was recruited to similar levels by both ERαWt and ERαLQ after 20 min of treatment. However, p300 recruitment by ERαLQ was significantly impaired at 45 min of treatment compared with ERαWt (Fig. 3C, right; Supplemental Fig. S11B–E, right), coinciding with the two-component transcriptional response described above (Fig. 3B). These temporal effects with p300 recruitment were observed genome-wide in 231/ERα cells (Supplemental Fig. S12) as well as in ERα knockdown MCF-7 cells re-expressing either ERαWt or ERαLQ (Supplemental Fig. S13). Collectively, these results suggest that the first phase of ERα enhancer formation (“enhancer priming”), which is supported by ERαLQ, requires the recruitment of p300 through an SRC-independent mechanism. In contrast, the second phase (“enhancer maintenance”), which is not supported by ERαLQ, requires the recruitment of p300 through an SRC-dependent mechanism. Interestingly, these ERα enhancer events do not require the pioneer factor FoxA1, since the temporal effects with p300 were observed in both 231/ERα cells, which do not express FoxA1, and MCF-7 cells, which do express FoxA1 (Supplemental Fig. S14).
SRC-independent enhancer priming requires Mediator and the bromodomain of p300
The experiments in Figure 3 suggest that p300 is recruited to liganded ERα in an SRC-independent manner during the first phase of enhancer formation (Fig. 4A). How might this occur? Black et al. (2006) showed that p300 is recruited by Mediator to GAL4-VP16-activated promoters to activate transcription. Since Mediator and p300 are both recruited to enhancers as well as promoters (Stumpf et al. 2006; Heintzman et al. 2009; Visel et al. 2009), we considered the possibility that p300 is recruited by Mediator to ERα enhancers during the first phase of activation. We found that E2-dependent recruitment of p300 was dramatically reduced upon knockdown of the ERα-interacting Mediator subunit Med1 in 231/ERαWt cells (Fig. 4B,C; Supplemental Fig. S15A–E). These results indicate that Mediator plays a role in p300 recruitment in the initial phase of enhancer formation. In addition, E2-dependent transcription of the enhancers and the corresponding target genes was significantly reduced by Med1 knockdown but perhaps to a lesser extent than might be expected given the dramatic reduction in p300 recruitment (Fig. 4D; Supplemental Fig. S15F–I).
Figure 4.
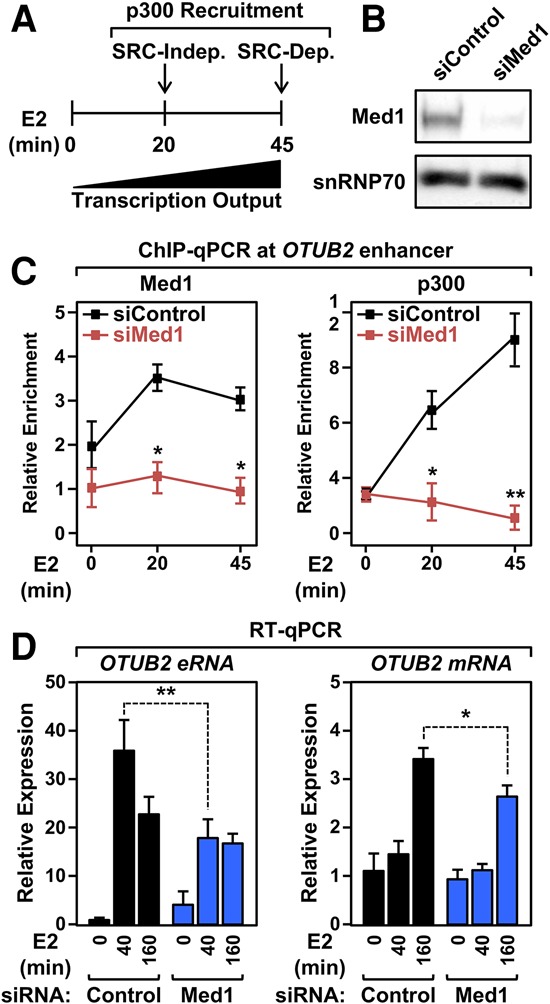
SRC-independent ERα enhancer priming requires Mediator. (A) Schematic showing the distinct SRC-independent and SRC-dependent phases of p300 recruitment during enhancer formation. (B) Western blot showing siRNA-mediated knockdown of Med1 in Dox-inducible 231/ERαWt cells. (C) SRC-independent recruitment of p300 requires Mediator. ChIP-qPCR assays for Med1 and p300 in Med1-depleted Dox-inducible 231/ERαWt cells treated with a time course of E2. Each point represents the mean ± SEM for at least three independent biological replicates. Asterisks indicate significant differences compared with the siRNA control at each time point. (*) P < 0.005; (**) P < 0.0001, two-way ANOVA. (D) Mediator is required for E2-induced gene expression. RT-qPCR assays in Med1-depleted 231/ERαWt cells treated with a time course of E2. Each bar represents the mean + SEM for at least three independent biological replicates. Asterisks indicate significant differences compared with the siRNA control at each time point. (*) P < 0.05; (**) P < 0.005, two-way ANOVA.
p300 contains a bromodomain and a plant homeodomain (PHD), which allow p300 to bind to chromatin through acetylated and methylated histones, respectively (Dancy and Cole 2015). Thus, we asked whether these domains might also facilitate p300 enrichment at ERα enhancers as well as p300-dependent enhancer priming and target gene transcription. We explored these questions using MCF-7 breast cancer cells, which express endogenous ERα. Treatment of the cells with the p300/CBP bromodomain inhibitor SGC-CBP30 (Hay et al. 2014) did not affect ERα binding to native ERα-binding sites, as expected, as determined on multiple ERα enhancers (Fig. 5A, left; Supplemental Fig. S16A–D, left). In contrast, SGC-CBP30 reduced p300 recruitment to ERα-binding sites throughout the E2 treatment time course (Fig. 5A, middle; Supplemental Fig. S16A–D, middle), indicating that the p300 bromodomain is also required for p300 recruitment during enhancer priming. Interestingly, we also observed reduced recruitment of Mediator upon treatment with SGC-CBP30 (Fig. 5A, right; Supplemental Fig. S16A–D, right), suggesting a cooperative recruitment of p300 and Mediator to the ERα-binding sites.
Figure 5.
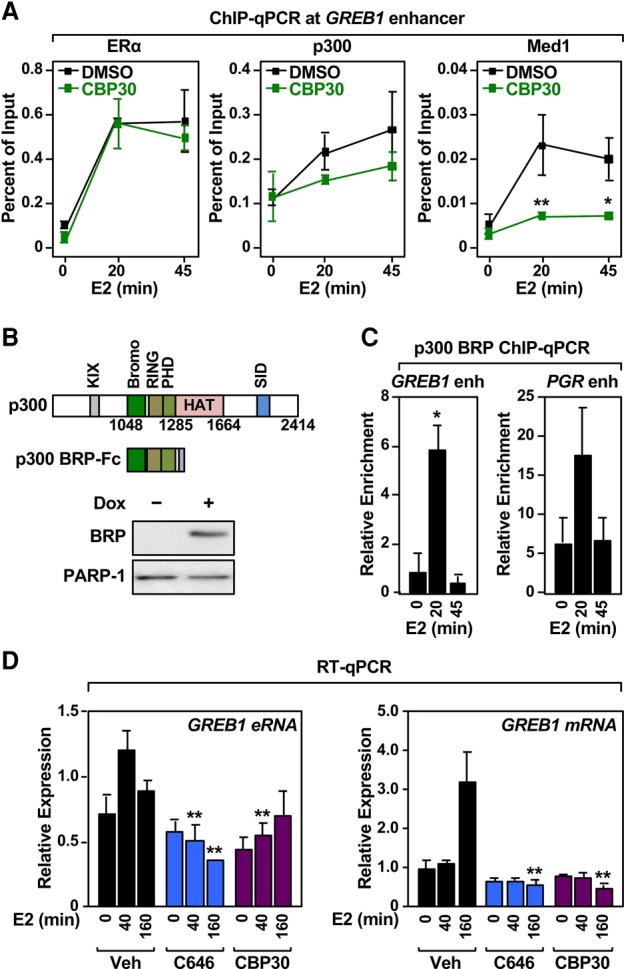
The p300 bromodomain is required for ERα enhancer priming. (A) The p300 bromodomain is required for p300 recruitment during enhancer priming. ChIP-qPCR assays for ERα, p300, and Med1 in MCF-7 cells treated with a time course of E2 in the presence of the p300/CBP bromodomain inhibitor SGC-CBP-30 (CBP30). Each point represents the mean ± SEM for at least three independent biological replicates. Asterisks indicate significant differences compared with the DMSO control at each time point. (*) P < 0.05; (**) P < 0.005, two-way ANOVA. (B) Ectopic expression of the p300 bromo-RING-PHD (BRP) cassette in MCF-7 cells. (Top) Schematics of p300 and the p300 BRP cassette. (KIX) CREB interaction domain; (Bromo) bromodomain; (RING) ring domain; (HAT) HAT catalytic domain; (SID) SRC interaction domain. (Bottom) Western blot showing Dox-dependent expression of the rabbit IgG Fc-fused p300-BRP cassette in MCF-7 cells. (C) The p300 bromodomain is recruited to ERα-binding sites during enhancer priming. ChIP-qPCR assays for the IgG Fc-fused p300-BRP cassette in MCF-7 cells treated with a time course of E2. Each bar represents the mean + SEM for at least three independent biological replicates. Asterisks indicate significant differences compared with 0 min of E2 treatment. P < 0.005, one-way ANOVA. (D) The p300 bromodomain and p300 acetyltransferase activity are required for E2-induced gene expression. RT-qPCR assays in MCF-7 cells treated with a time course of E2 in the presence of the p300 HAT inhibitor C646 or the bromodomain inhibitor SGC-CBP-30 (CBP30). Each bar represents the mean + SEM for at least three independent biological replicates. Asterisks indicate significant differences compared with the DMSO control at each time point. (**) P < 0.005, two-way ANOVA.
To further investigate the role of the p300 bromodomain in the recruitment of p300 during E2-dependent enhancer priming, we expressed a fragment of p300 that contains the bromodomain (BRP [bromo-RING-PHD]) (Delvecchio et al. 2013) fused to the Fc region of rabbit IgG (BRP-Fc) in MCF-7 cells (Fig. 5B). We performed ChIP using the Fc region for immunoprecipitation and examined the E2-dependent recruitment of BRP-Fc to native ERα-binding sites in MCF-7 cells. BRP-Fc was enriched at ERα enhancers at 20 min of E2 treatment but was depleted by 45 min (Fig. 5C; Supplemental Fig. S16E), consistent with the time course of p300 recruitment and SRC dependence determined in the experiments described above. In follow-up experiments in MCF-7 cells, we found that inhibition of both the p300 bromodomain (with SGC-CBP30) and the p300 acetyltransferase activity (with C646) significantly reduced E2-dependent gene expression (Fig. 5D; Supplemental Fig. S16F–I), demonstrating the critical role of bromodomain-dependent/SRC-independent recruitment of p300 as well as p300 acetyltransferase activity in ERα-mediated gene expression. Taken together, these studies revealed a cooperative recruitment of p300 and Mediator at ERα enhancers for enhancer priming prior to the formation of a mature and fully active ERα enhancer complex.
Forced recruitment of p300 to inactive ERα-binding sites increases Mediator recruitment and induces E2-dependent gene expression
The experiments in Figures 1–5 identified critical roles for p300 recruitment in two phases of enhancer formation (priming and maintenance) by at least three distinct mechanisms (Mediator-, bromodomain-, and SRC-dependent recruitment). To fully test and explore this hypothesis, we engineered an experimental system to examine the function of p300 at ERα enhancers independent of recruitment by other ERα coregulators. First, we deleted a part of α-helix 12 (Glu542 through His547) in the AF-2 domain of ERα to generate a ligand-binding- and DNA-binding competent but transcriptionally impaired ERα (ERαΔH12) (Brzozowski et al. 1997; Shiau et al. 1998). Next, we fused the p300/CBP-binding domain (PID [p300 interaction domain]) of SRC2 (Li and Chen 1998; Voegel et al. 1998; Sheppard et al. 2001) to ERαΔH12 to generate ERαΔH12-PID (Fig. 6A). Note that SRC2(PID) functions as a potent activation domain by recruiting p300/CBP (Kim et al. 2001; Acevedo and Kraus 2003). We expressed ERαWt, ERαΔH12, or ERαΔH12-PID in MDA-MB-231 cells using a doxycycline (Dox)-inducible system to generate 231/ERαWt, 231/ERαΔH12, and 231/ERαΔH12-PID cells, respectively (Fig. 6A).
Figure 6.

Forced recruitment of p300 to ERα-binding sites promotes Mediator recruitment, enhancer formation, and target gene expression. (A) Ectopic expression of 231/ERαWt, 231/ERαΔH12, and 231/ERαΔH12-PID. (Top) Schematics of ERαWt, ERαΔH12, and ERαΔH12-PID. (DBD) DNA-binding domain. (Bottom) Western blot showing Dox-dependent expression of 231/ERαWt, 231/ERαΔH12, and 231/ERαΔH12-PID. (B) The SRC2 PID is sufficient to recruit p300 to chromatin. ChIP-qPCR assays for ERα and p300 in MDA-MB-231 cell lines expressing the ERαs described in A with or without E2 treatment for 45 min. Each bar represents the mean + SEM for at least three independent biological replicates. Asterisks indicate significant differences compared with the vehicle control in each cell line. (*) P < 0.005, two-way ANOVA. (C) Forced recruitment of p300 to an inactive ERα-binding site restores Mediator recruitment and H3K27ac enrichment. ChIP-qPCR assays for Med1 and H3K27ac in the MDA-MB-231 cell lines expressing the ERαs described in A with or without E2 treatment for 45 min. Each bar represents the mean + SEM for at least three independent biological replicates. Asterisks indicate significant differences compared with the vehicle control in each cell line. (*) P < 0.05; (**) P < 0.0001, two-way ANOVA. (D) Forced recruitment of p300 to an inactive ERα-binding site restores enhancer–promoter chromatin looping. (Top) Browser tracks for ERα ChIP-seq and GRO-seq in 231/ERαWt cells after 45 min of E2 treatment, shown with the location of the 3C primers. (Bottom) 3C-qPCR assays showing chromatin looping from a distal ERα-binding site to the OTUB2 promoter in 231/ERαΔH12 or 231/ERαΔH12-PID cells. Each point represents the mean ± SEM for at least three independent biological replicates. Asterisks indicate significant differences compared with 231/ERαΔH12 cells at each genomic location in each condition. P < 0.0001, two-way ANOVA. (E) Forced recruitment of p300 to an inactive ERα-binding site restores E2-responsive eRNA production and gene expression. RT-qPCR assays in MDA-MB-231 cells expressing the ERαs described in A over a time course of E2 treatment. Each bar represents the mean + SEM for at least three independent biological replicates. Asterisks indicate significant differences compared with the vehicle control in each cell line. (*) P < 0.05, two-way ANOVA.
As expected, all three ERαs were similarly recruited to chromatin after E2 treatment (Fig. 6B, left; Supplemental Fig. S17A,B, left). p300 was robustly recruited in an E2-dependent manner by chromatin-bound ERαWt and ERαΔH12-PID, but exhibited impaired recruitment by ERαΔH12, at three different ERα enhancers (Fig. 6B, right; Supplemental Fig. S17A,B, middle left). Med1 recruitment and H3K27ac enrichment occurred effectively with ERαΔH12-PID but were impaired with ERαΔH12 (Fig. 6C; Supplemental Fig. S17A,B, right panels). Likewise, enhancer–promoter looping and target gene activation occurred effectively with ERαΔH12-PID but were impaired with ERαΔH12 (Fig. 6D,E; Supplemental Fig. S17C–F). Together, these results with forced recruitment of p300 to an otherwise inactive ERα-binding site demonstrate that p300 recruitment is sufficient for enhancer formation (e.g., Med1 recruitment, H3K27ac, and looping) and target gene activation.
The Mediator- and SRC-dependent functions of p300 link ERα enhancer activity to clinical outcomes in ER-positive breast cancer patients
Our results identified ordered and cooperative interactions among p300, Mediator, and SRCs leading to the formation, activation, and maintenance of ERα enhancers. To explore the biological outcomes of these events, we used the p300 bromodomain inhibitor SGC-CBP30, the p300 acetyltransferase inhibitor C646, and siRNAs targeting Med1 in MCF-7 proliferation assays. Each treatment alone effectively inhibited the growth of MCF-7 cells over a 6-d time course of E2 treatment (Fig. 7A; Supplemental Fig. S18A,B). Moreover, combination treatments with Med1 siRNAs and either p300 inhibitor were even more effective than the treatments alone (Fig. 7A; Supplemental Fig. S18A,B). These studies link the functions of Mediator and p300 in ERα-dependent transcription to downstream biological outcomes.
Figure 7.

p300, Mediator, and SRCs link ERα enhancer function to cell growth and clinical outcomes for ER-positive breast cancers. (A) Growth curve showing the combinatorial effects of p300 inhibition and Med1 depletion on E2-dependent MCF-7 cell proliferation. Proliferation was measured after siRNA-mediated Med1 depletion with or without the p300/CBP HAT inhibitor C646 in the presence of E2. Each point represents the mean ± SEM for at least three independent biological replicates. Points marked with different letters (a, b, and c) are significantly different from each other. P < 0.05, two-way ANOVA. (B) SRC2 and SRC3 are frequently amplified in ER-positive breast tumors. Bar graphs of somatic mutations and copy number variations identified for the SRC2 and SRC3 genes in ER-positive breast tumors based on data from The Cancer Genome Atlas (TCGA). (C) Amplifications of the SRC2 and SRC3 genes lead to overexpression of their cognate mRNAs in ER-positive breast tumors. Box plots showing SRC2 and SRC3 mRNA expression in ER-positive breast tumors binned based on copy number variations of SRC2 and SRC3 genes, respectively. Box plots marked with different letters (a, b, and c) are significantly different from each other. P < 0.005, Wilcoxon rank-sum test. (D) Kaplan-Meier plots for Luminal A ER-positive breast cancer patients using a set of genes (signature genes) whose expression is up-regulated in samples with SRC2 or SRC3 amplification compared with samples without amplification based on data from TCGA. The expression levels (high or low) of the signature genes determined in curated microarray data sets stratify patients into two groups. Their overall survival rates are shown in the plots. (E) A model for two-step ERα enhancer activation showing two distinct p300-dependent phases: (1) a “priming” phase with SRC-independent recruitment of p300 and (2) a “maintenance” phase with SRC-dependent recruitment of p300. See the text for details.
Our results using ERαLQ indicate an important role for SRCs in the maintenance of ERα enhancer activity. SRC3 is frequently amplified in ER-positive breast cancers (Anzick et al. 1997; Gojis et al. 2010). An increased dosage of SRCs is likely to support E2-mediated mitogenic growth of breast cancers by promoting ERα enhancer maintenance. Using data sets from The Cancer Genome Atlas (TCGA), we found that 15% and 5% of ER-positive breast tumors contain amplifications of SRC2 or SRC3, respectively (Fig. 7B). These gene amplifications correlate with the overexpression of the cognate mRNAs (Fig. 7C). Next, we examined the clinical outcomes of patients with ER-positive breast cancers with or without SRC amplification. In this analysis, the gene expression profiles for the patient samples with or without SRC amplification were compared to generate a list of genes more highly expressed in the group with SRC amplification relative to the group without SRC amplification, which we called the “SRC signature” (Supplemental Fig. S18C). The expression of each SRC signature gene was then used to segregate ER-positive luminal breast cancers into groups with “high” or “low” expression of the signature genes using curated microarray data with associated clinical outcome data that are independent of the TCGA data. The collective clinical outcomes stratified according to each SRC signature gene expression are represented in meta-Kaplan-Meier plots (Fig. 7D; Supplemental Fig. S18D; Mihaly et al. 2013; Pongor et al. 2015). Importantly, elevated expression of both the SRC2 and SRC3 signature genes correlates with unfavorable outcomes of patients with luminal breast cancers. Collectively, these cell growth and clinical data analyses link the Mediator- and SRC-dependent functions of p300 at ERα enhancers to clinical outcomes in ER-positive breast cancer patients.
Discussion
In the present study, we identified a critical functional interplay among p300, Mediator, and SRCs that recruits p300 and determines its activity throughout the time course of ERα enhancer formation and activation. Importantly, we identified two distinct mechanistic phases of ERα enhancer assembly and function, which are defined by the mode of p300 recruitment. Successful transition between these two phases (“coregulator switching”) is required for proper enhancer function. Collectively, our studies have revealed the detailed molecular and temporal mechanisms of signal-regulated enhancer assembly and activity that are likely to be applicable to a wide variety of signal-regulated enhancers. Furthermore, our results link p300, Mediator, and SRC function at ERα enhancers to hormone-dependent gene regulation in ER-positive breast cancers.
An ordered and cooperative assembly and function of ERα enhancers
Previous results have suggested a critical role for SRCs (which bind directly to ERα in a ligand-dependent manner) in recruiting p300 to ERα-binding sites. However, our results using a selective loss-of-function ERα mutant (i.e., L540Q) suggest a more intricate and varied set of mechanisms for recruiting p300 to ERα-binding sites in two distinct phases. In the first phase (0 to 20 min), p300 is recruited through a Mediator-dependent mechanism (perhaps through direct interactions) as well as the bromodomain of p300, which binds to acetylated histones like other bromodomains (Zeng and Zhou 2002). In the second phase, p300 is recruited though an SRC-dependent mechanism, which is also likely to occur through direct interactions. The former is required for initial enhancer formation and enhancer priming, while the latter is required for enhancer maturation and the maintenance of enhancer activity (Fig. 7E). We refer to the dynamic changes in the mode of p300 recruitment as “coregulator switching.” Failure to recruit p300 during either phase leads to abortive enhancer formation and a lack of target gene expression. These results suggest a critical role of SRCs in the later stages of ERα enhancer function but not in the initiation of enhancer formation.
A number of independent lines of investigation support the conclusions stated above. For example, siRNA-mediated knockdown of Med1, the ERα-interacting component of the Mediator complex, reduces the E2-dependent recruitment of p300 to ERα-binding sites (Fig. 4C). Furthermore, a fragment of p300 containing the acetyl-lysine-binding bromodomain but lacking the SRC-binding domain is recruited to ERα-binding sites within the first 20 min following E2 treatment (Fig. 5C). Conversely, the competitive p300 bromodomain inhibitor SGC-CBP-30 blocks p300 recruitment to ERα-binding sites (Fig. 5A).
Additional experiments using loss- or gain-of-function ERα mutants also support the conclusions stated above. For example, the selective loss-of-function ERα mutant ERαLQ, which recruits Mediator but not SRCs, supports enhancer formation in the first phase but is impaired in enhancer maturation and maintenance in the second phase (Figs. 1B, 3). Interestingly, the abortive enhancer formation with ERαLQ results in a dramatic reduction of enhancer transcription (Fig. 3B) but maintains a subset of active enhancer features, including enrichment of H3K27ac (Fig. 2D) and enhancer–promoter chromatin looping (Fig. 2B). In contrast, forced recruitment of p300 to an inactive ERα-binding site using the selective gain-of-function ERα mutant ERαΔH12-PID promotes enhancer activation, enhancer–promoter looping, and target gene transcription (Fig. 6). Interestingly, ERαΔH12-PID also promotes the recruitment of Mediator (Fig. 6C), while SGC-CBP-30 inhibits the recruitment of Mediator (Fig. 5A), illustrating a functional interplay between these two coregulators at enhancers, which has been demonstrated previously at promoters (Black et al. 2006).
Recruitment of p300 is necessary and sufficient for enhancer formation at ERα-binding sites
Since p300 and CBP were identified in the 1980s, they have been shown to function as key coregulators for many TFs through dual roles as scaffolding proteins for the recruitment of other coregulators and as enzymes for the modification of histones and other transcription-related proteins (Wang et al. 2013; Dancy and Cole 2015). Genome-wide analyses have shown that p300 and CBP are associated with active enhancers and, as such, are good markers of active enhancers (Heintzman et al. 2009; Visel et al. 2009). Our results with the p300 catalytic inhibitor C646 and the p300 bromodomain inhibitor SGC-CBP-30 indicate that p300 is required for enhancer formation at ERα-binding sites (Fig. 5D). Furthermore, our results with the selective gain-of-function ERα mutant ERαΔH12-PID, which recruits p300 to a transcriptionally impaired ERα, suggest that p300 recruitment is sufficient for enhancer formation at ERα-binding sites (Fig. 6). Although we cannot rule out cooperative effects with other coregulators that may be partially or fully recruited to ERαΔH12, our results are consistent with previous studies using the yeast Gal4 DNA-binding domain to recruit the CBP acetyltransferase domain to activate a reporter gene (Bannister and Kouzarides 1996). Collectively, our results indicate an essential role for p300 in ERα enhancer formation and function. In this regard, it makes sense that nature has devised and exploited multiple modes for p300 recruitment to TFs, such as ERα (i.e., via Mediator, SRCs, and the p300 bromodomain).
Successful transition between the two phases of ERα enhancer formation, reflected in the different modes of p300 recruitment, is required for proper enhancer function. Failure to transition leads to abortive enhancer formation and reduced E2-dependent gene activation. Experimentally, this can be demonstrated by inhibiting each of the modes of p300 recruitment using Med1 knockdown or a p300 bromodomain inhibitor in the first phase (Figs. 4, 5A,D) or the SRC-binding mutant ERαLQ in the second phase (Fig. 3). These results suggest that the enhancer complex is dynamic, with different protein–protein interaction surfaces used to accomplish distinct outcomes at specific times. This observation is consistent with a number of studies showing rapid and dynamic binding and exchange of coregulators at nuclear receptor-binding sites (Stenoien et al. 2001; Voss and Hager 2014).
As noted above, p300 and CBP have an intrinsic acetyltransferase activity that allows acetylation of lysine residues in substrate proteins, which include histones, TFs, and coregulators (Dancy and Cole 2015). In fact, p300 acetylates ERα, which can enhance the DNA-binding activity of ERα (Kim et al. 2006). Studies with the p300 catalytic inhibitor C646 indicate that p300 acetyltransferase activity is required for both phases of ERα assembly and function (Figs. 2E, 5D). Although the relevant substrates within the enhancer complex are, at present, unknown, it is possible that they may differ from one phase of enhancer activation to the next. In our assays, p300 recruitment and activity track with enhancer transcription, and impaired recruitment of p300 by ERαLQ correlates with reduced enhancer transcription (Fig. 3B,C). In this regard, Bose et al. (2017) have shown recently that noncoding RNAs, including eRNAs, can stimulate CBP (and presumably p300) histone acetyltransferase activity. It is interesting to speculate that p300-dependent enhancer transcription in the first phase may have a feed-forward effect to stimulate p300 acetyltransferase activity in the second phase through eRNA production.
p300, Mediator, and SRCs: links between ERα enhancer activity, breast cancer cell growth, and clinical outcomes in breast cancers
E2 signaling, which promotes p300, Mediator, and SRC recruitment; ERα enhancer formation; and target gene activation, has potent mitogenic effects on the proliferation of ER-positive breast cancer cells. In this regard, p300, Mediator, and SRCs have all been linked to human diseases, including cancers (Anzick et al. 1997; Gojis et al. 2010; Spaeth et al. 2011; Wang et al. 2013). In cell proliferation assays, we observed a dramatic effect of p300 inhibitors on the growth of ER-positive breast cancer cells, which was further enhanced by the knockdown of Med1 (Fig. 7A). These cell-based results mirror the molecular interplay between p300 and Mediator that we observed during ERα enhancer formation, providing a molecular link between ERα enhancer activity, E2-dependent gene expression, and breast cancer cell growth.
The genes encoding SRC2 and SRC3 are up-regulated in a subset of ER-positive luminal breast cancers (Fig. 7C; Anzick et al. 1997; Gojis et al. 2010). In addition, SRC2- and SRC3-dependent gene signatures track with clinical outcomes in breast cancer patients (i.e., lower expression and better outcomes) (Fig. 7D). These clinical results mirror the molecular interplay between p300 and SRC that we observed during ERα enhancer formation, providing yet another molecular link between ERα enhancer activity, E2-dependent gene expression, and breast cancer cell growth. Interestingly, amplification of SRCs in breast cancer cells may act to cause the aberrant recruitment of p300 to ERα-binding sites, which may drive spurious enhancer formation or activation. Given the role of SRCs in ERα enhancer maintenance described above, amplification of SRCs may promote sustained enhancer activation, resulting in prolonged mitogenic responses. Such an effect would justify the ongoing efforts to develop drugs that inhibit the interactions between ERα and SRCs (Rodriguez et al. 2004; Song et al. 2016), which can be a potent way of inhibiting SRC-, p300-, and Mediator-dependent transcription by ERα (Kim et al. 2001; Acevedo and Kraus 2003).
Materials and methods
Additional details for the Materials and Methods are in the Supplemental Material.
Cell lines, cell culture, and treatments
Parental MDA-MB-231 cells were obtained from American Type Culture Collection (ATCC). Parental MCF-7 cells were kindly provided by Dr. Benita Katzenellenbogen (University of Illinois at Urbana-Champaign, IL). MDA-MB-231 cells with constitutive expression of ERαWt or ERαLQ were prepared as described previously (Acevedo et al. 2004). MDA-MB-231 cells with Dox-inducible expression of ERαWt, ERαLQ, ERαΔH12, or ERαΔH12-SRC2(PID) were generated by lentivirus-mediated transduction using the pINDUCER20 vector. MCF-7 cells with simultaneous Dox-dependent shRNA-mediated knockdown of endogenous ERα and ectopic expression of ERα were prepared by sequential transduction of MCF-7 cells using lentiviruses generated from pTRIPZ-shRNA vectors and pINDUCER20-based vectors.
For experiments, the cells were treated with vehicle (DMSO) or 100 nM E2 (Sigma) for the specified amount of time. Where indicated, the cells were treated with vehicle (DMSO), 25 µM p300/CBP acetyltransferase inhibitor C646 (Sigma) (Bowers et al. 2010), or 50 µM p300/CBP bromodomain inhibitor SGC-CBP30 (Sigma) (Hay et al. 2014) for 30 min prior to E2 treatment unless noted otherwise.
siRNA-mediated knockdown
siRNA-mediated knockdown was performed using Lipofectamine RNAiMax reagent (Invitrogen) with siControl and siMed1 siRNAs (Sigma).
Analysis of mRNA and eRNA expression by RT-qPCR
RNA expression analysis by RT-qPCR was performed as described previously (Hah et al. 2013). One microgram of total RNA was reverse-transcribed using random hexamers and M-MLV reverse transcriptase. mRNA and eRNA expression was analyzed by qPCR with SYBR Green using a LightCycler 480 (Roche) and the primers listed in the Supplemental Material.
ChIP
ChIP was performed as described previously with some minor modifications (Hah et al. 2013). The chromatin-immunoprecipitated DNA was (1) analyzed by qPCR with SYBR Green using a LightCycler 480 (Roche) and the primers listed in the Supplemental Material or (2) subjected to ChIP-seq library preparation. Nonspecific background signals in all ChIP assays were determined using IgG or no antibody control.
ChIP-seq
ChIP-seq library preparation
ChIP-seq libraries were prepared from chromatin-immunoprecipitated DNA as described previously with some minor modifications (Luo et al. 2014). The quality of the libraries was assessed using a D1000 ScreenTape on a 2200 TapeStation (Agilent) and quantified using a Qubit dsDNA HS assay kit (Thermo Fisher). The libraries with unique adaptor barcodes were multiplexed and sequenced on an Illumina HiSeq 2000 (single-end, 50 base reads).
ChIP-seq data quality control and alignment
The quality of the ChIP-seq data sets was assessed using the FastQC tool. The ChIP-seq reads were aligned to the human reference genome (hg19) using Bowtie (version 0.12.7) (Langmead et al. 2009). Uniquely mapped reads were visualized on the University of California at Santa Cruz genome browser as bigWig files prepared using BEDTools (Quinlan and Hall 2010) and custom R scripts (available on request).
Peak calling
ERα peak calling was performed using MACS software (Zhang et al. 2008) using the default P-value and input condition as a control. Peaks for ERαWt and ERαLQ were rank-ordered separately by the number of read counts in a fixed 1-kb window (±500 base pairs [bp]) surrounding each ERα peak.
3C assays
3C assays were performed as described previously with some minor modifications (Dekker et al. 2002; Wang et al. 2009). The interaction frequencies were determined by qPCR assays with SYBR Green or TaqMan qPCR assays with the primers and probes listed in the Supplemental Material.
GRO-seq
Preparation of GRO-seq libraries
GRO-seq libraries were prepared as described previously with some minor modifications (Luo et al. 2014). Library quality was assessed as described above for the ChIP-seq libraries and then sequenced on an Illumina HiSeq 2000 (single-end, 50-bp reads) for a total of ∼47 million raw reads per biological replicate.
Quality control and alignment
GRO-seq data analyses were performed as described previously (Hah et al. 2013) using the groHMM software package available from Bioconductor (http://bioconductor.org/packages/release/bioc/html/groHMM.html) (Chae et al. 2015). The quality of the GRO-seq data sets was assessed using the FastQC tool. Trimmed GRO-seq reads were aligned to the human reference genome (hg19) and one complete copy of an rDNA repeat (GenBank ID U13369.1) using the BWA aligner (Li and Durbin 2010).
Data analyses
Differential gene expression between experimental conditions was determined using edgeR (Robinson et al. 2010). Various data analyses were performed using the groHMM software package (Chae et al. 2015) and custom R scripts (available on request).
Cell proliferation assays
Cells were collected every 2 d, fixed in 10% formaldehyde for 10 min, and stored at 4°C. After the final time point was collected, all samples were stained with 0.1% crystal violet in 75 mM phosphoric acid for 30 min. The crystal violet was extracted from the cells using 10% acetic acid and measured as absorbance at 562 nm.
Genomic data sets
The ChIP-seq and GRO-seq data sets were deposited in the NCBI's Gene Expression Omnibus (GEO) database under superseries accession number GSE95123 (subseries GSE95121 and GSE95122, respectively).
Supplementary Material
Acknowledgments
We thank members of the Kraus laboratory for providing critical feedback on this work and helpful comments on the manuscript, and O'Brian Mbakwe for assistance with cell growth assays. This work was supported by a grant from the National Institutes of Health/National Institute of Diabetes and Digestive and Kidney Diseases (DK058110), a grant from the Cancer Prevention and Research Institute of Texas (CPRIT; RP160319), and financial support from the Cecil H. and Ida Green Center for Reproductive Biology Sciences Endowment to W.L.K.
Footnotes
Supplemental material is available for this article.
Article published online ahead of print. Article and publication date are online at http://www.genesdev.org/cgi/doi/10.1101/gad.302182.117.
References
- Acevedo ML, Kraus WL. 2003. Mediator and p300/CBP–steroid receptor coactivator complexes have distinct roles, but function synergistically, during estrogen receptor α-dependent transcription with chromatin templates. Mol Cell Biol 23: 335–348. [DOI] [PMC free article] [PubMed] [Google Scholar]
- Acevedo ML, Lee KC, Stender JD, Katzenellenbogen BS, Kraus WL. 2004. Selective recognition of distinct classes of coactivators by a ligand-inducible activation domain. Mol Cell 13: 725–738. [DOI] [PubMed] [Google Scholar]
- Anzick SL, Kononen J, Walker RL, Azorsa DO, Tanner MM, Guan XY, Sauter G, Kallioniemi OP, Trent JM, Meltzer PS. 1997. AIB1, a steroid receptor coactivator amplified in breast and ovarian cancer. Science 277: 965–968. [DOI] [PubMed] [Google Scholar]
- Bannister AJ, Kouzarides T. 1996. The CBP co-activator is a histone acetyltransferase. Nature 384: 641–643. [DOI] [PubMed] [Google Scholar]
- Barbieri CE, Baca SC, Lawrence MS, Demichelis F, Blattner M, Theurillat JP, White TA, Stojanov P, Van Allen E, Stransky N, et al. 2012. Exome sequencing identifies recurrent SPOP, FOXA1 and MED12 mutations in prostate cancer. Nat Genet 44: 685–689. [DOI] [PMC free article] [PubMed] [Google Scholar]
- Black JC, Choi JE, Lombardo SR, Carey M. 2006. A mechanism for coordinating chromatin modification and preinitiation complex assembly. Mol Cell 23: 809–818. [DOI] [PubMed] [Google Scholar]
- Bose DA, Donahue G, Reinberg D, Shiekhattar R, Bonasio R, Berger SL. 2017. RNA binding to CBP stimulates histone acetylation and transcription. Cell 168: 135–149 e122. [DOI] [PMC free article] [PubMed] [Google Scholar]
- Bowers EM, Yan G, Mukherjee C, Orry A, Wang L, Holbert MA, Crump NT, Hazzalin CA, Liszczak G, Yuan H, et al. 2010. Virtual ligand screening of the p300/CBP histone acetyltransferase: identification of a selective small molecule inhibitor. Chem Biol 17: 471–482. [DOI] [PMC free article] [PubMed] [Google Scholar]
- Brzozowski AM, Pike AC, Dauter Z, Hubbard RE, Bonn T, Engstrom O, Ohman L, Greene GL, Gustafsson JA, Carlquist M. 1997. Molecular basis of agonism and antagonism in the oestrogen receptor. Nature 389: 753–758. [DOI] [PubMed] [Google Scholar]
- Burns KA, Korach KS. 2012. Estrogen receptors and human disease: an update. Arch Toxicol 86: 1491–1504. [DOI] [PMC free article] [PubMed] [Google Scholar]
- Chae M, Danko CG, Kraus WL. 2015. groHMM: a computational tool for identifying unannotated and cell type-specific transcription units from global run-on sequencing data. BMC Bioinformatics 16: 222. [DOI] [PMC free article] [PubMed] [Google Scholar]
- Chang MT, Asthana S, Gao SP, Lee BH, Chapman JS, Kandoth C, Gao J, Socci ND, Solit DB, Olshen AB, et al. 2016. Identifying recurrent mutations in cancer reveals widespread lineage diversity and mutational specificity. Nat Biotechnol 34: 155–163. [DOI] [PMC free article] [PubMed] [Google Scholar]
- Chen W, Roeder RG. 2011. Mediator-dependent nuclear receptor function. Semin Cell Dev Biol 22: 749–758. [DOI] [PMC free article] [PubMed] [Google Scholar]
- Core LJ, Waterfall JJ, Lis JT. 2008. Nascent RNA sequencing reveals widespread pausing and divergent initiation at human promoters. Science 322: 1845–1848. [DOI] [PMC free article] [PubMed] [Google Scholar]
- Dancy BM, Cole PA. 2015. Protein lysine acetylation by p300/CBP. Chem Rev 115: 2419–2452. [DOI] [PMC free article] [PubMed] [Google Scholar]
- Dasgupta S, Lonard DM, O'Malley BW. 2014. Nuclear receptor coactivators: master regulators of human health and disease. Annu Rev Med 65: 279–292. [DOI] [PMC free article] [PubMed] [Google Scholar]
- Dekker J, Rippe K, Dekker M, Kleckner N. 2002. Capturing chromosome conformation. Science 295: 1306–1311. [DOI] [PubMed] [Google Scholar]
- Delvecchio M, Gaucher J, Aguilar-Gurrieri C, Ortega E, Panne D. 2013. Structure of the p300 catalytic core and implications for chromatin targeting and HAT regulation. Nat Struct Mol Biol 20: 1040–1046. [DOI] [PubMed] [Google Scholar]
- De Santa F, Barozzi I, Mietton F, Ghisletti S, Polletti S, Tusi BK, Muller H, Ragoussis J, Wei CL, Natoli G. 2010. A large fraction of extragenic RNA pol II transcription sites overlap enhancers. PLoS Biol 8: e1000384. [DOI] [PMC free article] [PubMed] [Google Scholar]
- Gojis O, Rudraraju B, Gudi M, Hogben K, Sousha S, Coombes RC, Cleator S, Palmieri C. 2010. The role of SRC-3 in human breast cancer. Nat Rev Clin Oncol 7: 83–89. [DOI] [PubMed] [Google Scholar]
- Hah N, Danko CG, Core L, Waterfall JJ, Siepel A, Lis JT, Kraus WL. 2011. A rapid, extensive, and transient transcriptional response to estrogen signaling in breast cancer cells. Cell 145: 622–634. [DOI] [PMC free article] [PubMed] [Google Scholar]
- Hah N, Murakami S, Nagari A, Danko CG, Kraus WL. 2013. Enhancer transcripts mark active estrogen receptor binding sites. Genome Res 23: 1210–1223. [DOI] [PMC free article] [PubMed] [Google Scholar]
- Hay DA, Fedorov O, Martin S, Singleton DC, Tallant C, Wells C, Picaud S, Philpott M, Monteiro OP, Rogers CM, et al. 2014. Discovery and optimization of small-molecule ligands for the CBP/p300 bromodomains. J Am Chem Soc 136: 9308–9319. [DOI] [PMC free article] [PubMed] [Google Scholar]
- Heintzman ND, Hon GC, Hawkins RD, Kheradpour P, Stark A, Harp LF, Ye Z, Lee LK, Stuart RK, Ching CW, et al. 2009. Histone modifications at human enhancers reflect global cell-type-specific gene expression. Nature 459: 108–112. [DOI] [PMC free article] [PubMed] [Google Scholar]
- Heinz S, Romanoski CE, Benner C, Glass CK. 2015. The selection and function of cell type-specific enhancers. Nat Rev Mol Cell Biol 16: 144–154. [DOI] [PMC free article] [PubMed] [Google Scholar]
- Ince BA, Zhuang Y, Wrenn CK, Shapiro DJ, Katzenellenbogen BS. 1993. Powerful dominant negative mutants of the human estrogen receptor. J Biol Chem 268: 14026–14032. [PubMed] [Google Scholar]
- Jin Q, Yu LR, Wang L, Zhang Z, Kasper LH, Lee JE, Wang C, Brindle PK, Dent SY, Ge K. 2011. Distinct roles of GCN5/PCAF-mediated H3K9ac and CBP/p300-mediated H3K18/27ac in nuclear receptor transactivation. EMBO J 30: 249–262. [DOI] [PMC free article] [PubMed] [Google Scholar]
- Kandoth C, McLellan MD, Vandin F, Ye K, Niu B, Lu C, Xie M, Zhang Q, McMichael JF, Wyczalkowski MA, et al. 2013. Mutational landscape and significance across 12 major cancer types. Nature 502: 333–339. [DOI] [PMC free article] [PubMed] [Google Scholar]
- Kang YK, Guermah M, Yuan CX, Roeder RG. 2002. The TRAP/Mediator coactivator complex interacts directly with estrogen receptors α and β through the TRAP220 subunit and directly enhances estrogen receptor function in vitro. Proc Natl Acad Sci 99: 2642–2647. [DOI] [PMC free article] [PubMed] [Google Scholar]
- Kim TK, Shiekhattar R. 2015. Architectural and functional commonalities between enhancers and promoters. Cell 162: 948–959. [DOI] [PMC free article] [PubMed] [Google Scholar]
- Kim MY, Hsiao SJ, Kraus WL. 2001. A role for coactivators and histone acetylation in estrogen receptor α-mediated transcription initiation. EMBO J 20: 6084–6094. [DOI] [PMC free article] [PubMed] [Google Scholar]
- Kim MY, Woo EM, Chong YT, Homenko DR, Kraus WL. 2006. Acetylation of estrogen receptor α by p300 at lysines 266 and 268 enhances the deoxyribonucleic acid binding and transactivation activities of the receptor. Mol Endocrinol 20: 1479–1493. [DOI] [PMC free article] [PubMed] [Google Scholar]
- Kim TK, Hemberg M, Gray JM, Costa AM, Bear DM, Wu J, Harmin DA, Laptewicz M, Barbara-Haley K, Kuersten S, et al. 2010. Widespread transcription at neuronal activity-regulated enhancers. Nature 465: 182–187. [DOI] [PMC free article] [PubMed] [Google Scholar]
- Kulaeva OI, Nizovtseva EV, Polikanov YS, Ulianov SV, Studitsky VM. 2012. Distant activation of transcription: mechanisms of enhancer action. Mol Cell Biol 32: 4892–4897. [DOI] [PMC free article] [PubMed] [Google Scholar]
- Lai F, Orom UA, Cesaroni M, Beringer M, Taatjes DJ, Blobel GA, Shiekhattar R. 2013. Activating RNAs associate with Mediator to enhance chromatin architecture and transcription. Nature 494: 497–501. [DOI] [PMC free article] [PubMed] [Google Scholar]
- Langmead B, Trapnell C, Pop M, Salzberg SL. 2009. Ultrafast and memory-efficient alignment of short DNA sequences to the human genome. Genome Biol 10: R25. [DOI] [PMC free article] [PubMed] [Google Scholar]
- Li H, Chen JD. 1998. The receptor-associated coactivator 3 activates transcription through CREB-binding protein recruitment and autoregulation. J Biol Chem 273: 5948–5954. [DOI] [PubMed] [Google Scholar]
- Li H, Durbin R. 2010. Fast and accurate long-read alignment with Burrows-Wheeler transform. Bioinformatics 26: 589–595. [DOI] [PMC free article] [PubMed] [Google Scholar]
- Luo X, Chae M, Krishnakumar R, Danko CG, Kraus WL. 2014. Dynamic reorganization of the AC16 cardiomyocyte transcriptome in response to TNFα signaling revealed by integrated genomic analyses. BMC Genomics 15: 155. [DOI] [PMC free article] [PubMed] [Google Scholar]
- Malik S, Roeder RG. 2010. The metazoan Mediator co-activator complex as an integrative hub for transcriptional regulation. Nat Rev Genet 11: 761–772. [DOI] [PMC free article] [PubMed] [Google Scholar]
- Mihaly Z, Kormos M, Lanczky A, Dank M, Budczies J, Szasz MA, Gyorffy B. 2013. A meta-analysis of gene expression-based biomarkers predicting outcome after tamoxifen treatment in breast cancer. Breast Cancer Res Treat 140: 219–232. [DOI] [PubMed] [Google Scholar]
- Nilsson S, Makela S, Treuter E, Tujague M, Thomsen J, Andersson G, Enmark E, Pettersson K, Warner M, Gustafsson JA. 2001. Mechanisms of estrogen action. Physiol Rev 81: 1535–1565. [DOI] [PubMed] [Google Scholar]
- Ong CT, Corces VG. 2011. Enhancer function: new insights into the regulation of tissue-specific gene expression. Nat Rev Genet 12: 283–293. [DOI] [PMC free article] [PubMed] [Google Scholar]
- Pongor L, Kormos M, Hatzis C, Pusztai L, Szabo A, Gyorffy B. 2015. A genome-wide approach to link genotype to clinical outcome by utilizing next generation sequencing and gene chip data of 6,697 breast cancer patients. Genome Med 7: 104. [DOI] [PMC free article] [PubMed] [Google Scholar]
- Quinlan AR, Hall IM. 2010. BEDTools: a flexible suite of utilities for comparing genomic features. Bioinformatics 26: 841–842. [DOI] [PMC free article] [PubMed] [Google Scholar]
- Reiter F, Wienerroither S, Stark A. 2017. Combinatorial function of transcription factors and cofactors. Curr Opin Genet Dev 43: 73–81. [DOI] [PubMed] [Google Scholar]
- Robinson MD, McCarthy DJ, Smyth GK. 2010. edgeR: a Bioconductor package for differential expression analysis of digital gene expression data. Bioinformatics 26: 139–140. [DOI] [PMC free article] [PubMed] [Google Scholar]
- Rodriguez AL, Tamrazi A, Collins ML, Katzenellenbogen JA. 2004. Design, synthesis, and in vitro biological evaluation of small molecule inhibitors of estrogen receptor α coactivator binding. J Med Chem 47: 600–611. [DOI] [PubMed] [Google Scholar]
- Schodin DJ, Zhuang Y, Shapiro DJ, Katzenellenbogen BS. 1995. Analysis of mechanisms that determine dominant negative estrogen receptor effectiveness. J Biol Chem 270: 31163–31171. [DOI] [PubMed] [Google Scholar]
- Sheppard HM, Harries JC, Hussain S, Bevan C, Heery DM. 2001. Analysis of the steroid receptor coactivator 1 (SRC1)–CREB binding protein interaction interface and its importance for the function of SRC1. Mol Cell Biol 21: 39–50. [DOI] [PMC free article] [PubMed] [Google Scholar]
- Shiau AK, Barstad D, Loria PM, Cheng L, Kushner PJ, Agard DA, Greene GL. 1998. The structural basis of estrogen receptor/coactivator recognition and the antagonism of this interaction by tamoxifen. Cell 95: 927–937. [DOI] [PubMed] [Google Scholar]
- Shlyueva D, Stampfel G, Stark A. 2014. Transcriptional enhancers: from properties to genome-wide predictions. Nat Rev Genet 15: 272–286. [DOI] [PubMed] [Google Scholar]
- Song X, Chen J, Zhao M, Zhang C, Yu Y, Lonard DM, Chow DC, Palzkill T, Xu J, O'Malley BW, et al. 2016. Development of potent small-molecule inhibitors to drug the undruggable steroid receptor coactivator-3. Proc Natl Acad Sci 113: 4970–4975. [DOI] [PMC free article] [PubMed] [Google Scholar]
- Spaeth JM, Kim NH, Boyer TG. 2011. Mediator and human disease. Semin Cell Dev Biol 22: 776–787. [DOI] [PMC free article] [PubMed] [Google Scholar]
- Stenoien DL, Nye AC, Mancini MG, Patel K, Dutertre M, O'Malley BW, Smith CL, Belmont AS, Mancini MA. 2001. Ligand-mediated assembly and real-time cellular dynamics of estrogen receptor α–coactivator complexes in living cells. Mol Cell Biol 21: 4404–4412. [DOI] [PMC free article] [PubMed] [Google Scholar]
- Stumpf M, Waskow C, Krotschel M, van Essen D, Rodriguez P, Zhang X, Guyot B, Roeder RG, Borggrefe T. 2006. The mediator complex functions as a coactivator for GATA-1 in erythropoiesis via subunit Med1/TRAP220. Proc Natl Acad Sci 103: 18504–18509. [DOI] [PMC free article] [PubMed] [Google Scholar]
- Tang Z, Chen WY, Shimada M, Nguyen UT, Kim J, Sun XJ, Sengoku T, McGinty RK, Fernandez JP, Muir TW, et al. 2013. SET1 and p300 act synergistically, through coupled histone modifications, in transcriptional activation by p53. Cell 154: 297–310. [DOI] [PMC free article] [PubMed] [Google Scholar]
- Visel A, Blow MJ, Li Z, Zhang T, Akiyama JA, Holt A, Plajzer-Frick I, Shoukry M, Wright C, Chen F, et al. 2009. ChIP-seq accurately predicts tissue-specific activity of enhancers. Nature 457: 854–858. [DOI] [PMC free article] [PubMed] [Google Scholar]
- Voegel JJ, Heine MJ, Tini M, Vivat V, Chambon P, Gronemeyer H. 1998. The coactivator TIF2 contains three nuclear receptor-binding motifs and mediates transactivation through CBP binding-dependent and -independent pathways. EMBO J 17: 507–519. [DOI] [PMC free article] [PubMed] [Google Scholar]
- Voss TC, Hager GL. 2014. Dynamic regulation of transcriptional states by chromatin and transcription factors. Nat Rev Genet 15: 69–81. [DOI] [PMC free article] [PubMed] [Google Scholar]
- Wang Q, Li W, Zhang Y, Yuan X, Xu K, Yu J, Chen Z, Beroukhim R, Wang H, Lupien M, et al. 2009. Androgen receptor regulates a distinct transcription program in androgen-independent prostate cancer. Cell 138: 245–256. [DOI] [PMC free article] [PubMed] [Google Scholar]
- Wang D, Garcia-Bassets I, Benner C, Li W, Su X, Zhou Y, Qiu J, Liu W, Kaikkonen MU, Ohgi KA, et al. 2011. Reprogramming transcription by distinct classes of enhancers functionally defined by eRNA. Nature 474: 390–394. [DOI] [PMC free article] [PubMed] [Google Scholar]
- Wang F, Marshall CB, Ikura M. 2013. Transcriptional/epigenetic regulator CBP/p300 in tumorigenesis: structural and functional versatility in target recognition. Cell Mol Life Sci 70: 3989–4008. [DOI] [PMC free article] [PubMed] [Google Scholar]
- Yi P, Wang Z, Feng Q, Pintilie GD, Foulds CE, Lanz RB, Ludtke SJ, Schmid MF, Chiu W, O'Malley BW. 2015. Structure of a biologically active estrogen receptor-coactivator complex on DNA. Mol Cell 57: 1047–1058. [DOI] [PMC free article] [PubMed] [Google Scholar]
- Zeng L, Zhou MM. 2002. Bromodomain: an acetyl-lysine binding domain. FEBS Lett 513: 124–128. [DOI] [PubMed] [Google Scholar]
- Zhang Y, Liu T, Meyer CA, Eeckhoute J, Johnson DS, Bernstein BE, Nusbaum C, Myers RM, Brown M, Li W, et al. 2008. Model-based analysis of ChIP-seq (MACS). Genome Biol 9: R137. [DOI] [PMC free article] [PubMed] [Google Scholar]
Associated Data
This section collects any data citations, data availability statements, or supplementary materials included in this article.