

Abstract
MicroRNAs are short RNAs that serve as regulators of gene expression and are essential components of normal development as well as modulators of disease. MicroRNAs generally act cell-autonomously, and thus their localization to specific cell types is needed to guide our understanding of microRNA activity. Current tissue-level data have caused considerable confusion, and comprehensive cell-level data do not yet exist. Here, we establish the landscape of human cell-specific microRNA expression. This project evaluated 8 billion small RNA-seq reads from 46 primary cell types, 42 cancer or immortalized cell lines, and 26 tissues. It identified both specific and ubiquitous patterns of expression that strongly correlate with adjacent superenhancer activity. Analysis of unaligned RNA reads uncovered 207 unknown minor strand (passenger) microRNAs of known microRNA loci and 495 novel putative microRNA loci. Although cancer cell lines generally recapitulated the expression patterns of matched primary cells, their isomiR sequence families exhibited increased disorder, suggesting DROSHA- and DICER1-dependent microRNA processing variability. Cell-specific patterns of microRNA expression were used to de-convolute variable cellular composition of colon and adipose tissue samples, highlighting one use of these cell-specific microRNA expression data. Characterization of cellular microRNA expression across a wide variety of cell types provides a new understanding of this critical regulatory RNA species.
MicroRNAs are an established class of small regulatory RNAs that, within the RISC complex, bind mRNAs and repress protein production (Valencia-Sanchez et al. 2006). In this role, they control essential cell processes in health and disease (Ambros 2004; Mendell and Olson 2012). Despite all that is known about microRNA processing and function, the cellular localization of microRNAs is still widely underappreciated. An understanding of which cells express which microRNAs is useful as we move toward microRNA therapeutics (Janssen et al. 2013) and microRNA biomarkers (Mitchell et al. 2008). Knowing a microRNA's full localization pattern will maximize efficacy and minimize off-target effects of therapeutics and will better rationalize candidate biomarkers (Haider et al. 2014).
MicroRNA expression has been predominantly characterized in tissues, with no comprehensive cellular studies. Initial tissue studies sequenced individual clones or used array methods providing low-depth coverage of abundant microRNAs (Lagos-Quintana et al. 2002; Barad et al. 2004; Liu et al. 2004; Baskerville and Bartel 2005). The most thorough of these microRNA localization projects performed small RNA library sequencing (RNA-seq) on over 250 libraries from 26 organ systems. However, this nascent effort sequenced only ∼1200 reads per library (Landgraf et al. 2007). While providing valuable insights into the relationship of microRNA expression and disease (Lu et al. 2005), these and subsequent studies (Cheng et al. 2015; Ludwig et al. 2016) have not unraveled cellular microRNA expression. Because all tissues are composed of multiple, unique cell types, it is essential to understand from which cell the microRNA signal is obtained. Additionally, the anonymity of microRNA nomenclature, with sequential numerical naming, has not allowed an intrinsic understanding of which microRNAs are ubiquitous and which have cell-restricted patterns of expression (Witwer and Halushka 2016). This determination is fundamental to understanding the proper biologic and regulatory roles of microRNAs.
Small RNA-seq has become a robust method to fully characterize known microRNAs, capture complete isomiR families, and identify novel microRNAs. IsomiRs are related sequences with mostly 5′ and 3′ nucleotide modifications that collectively make up the totality of a given microRNA (Neilsen et al. 2012). The microRNA community has been forthright in depositing RNA-seq data into central public repositories. As a result, there is a significant amount of data that can be collectively analyzed. We combined new sequencing of 39 primary cell lines or isolated cells with hundreds of publicly available primary cell and immortalized/cancer cell line data sets, with all microRNA assignment performed by a single robust and high-throughput microRNA alignment method (Baras et al. 2015), to establish the most complete characterization of the human cellular microRNAome, including novel microRNA discovery and isomiR diversity. We additionally analyzed whole-tissue microRNA data to understand the extent to which cells obtained from ex vivo cultures could recapitulate a tissue signal and compared matched primary and cancer/immortalized cells to determine the extent of similarity in their expression patterns.
Results
Generation of a cellular microRNAome
Toward cataloging a high-quality complete cellular microRNAome, we generated new small RNA-seq data from 39 primary cells obtained by culture, flow cytometry, or centrifugation. We augmented this with Sequence Read Archive (SRA) small RNA-seq read data from 496 samples with >1 million microRNA reads. These were primary cell cultures, immortalized/cancer cell lines, or normal tissues (Fig. 1). All samples were processed through miRge (Baras et al. 2015). miRge uses modified microRNA libraries and multiple Bowtie steps for optimal alignments on multiplexed runs (Table 1; Fig. 2A). Overall, 2319 of 2546 known microRNAs (miRBase v21) had a minimum expression of 1 read per million microRNA reads (RPM) in at least one sample (Supplemental Table S1).
Figure 1.

A generalized overview of the 530 cells and tissues included in this study. (A) Representation of 46 main cell types. (B) Representation of 42 cancer or immortalized cell lines. (C) Representation of 26 tissues/organ types.
Table 1.
Overall sequencing data
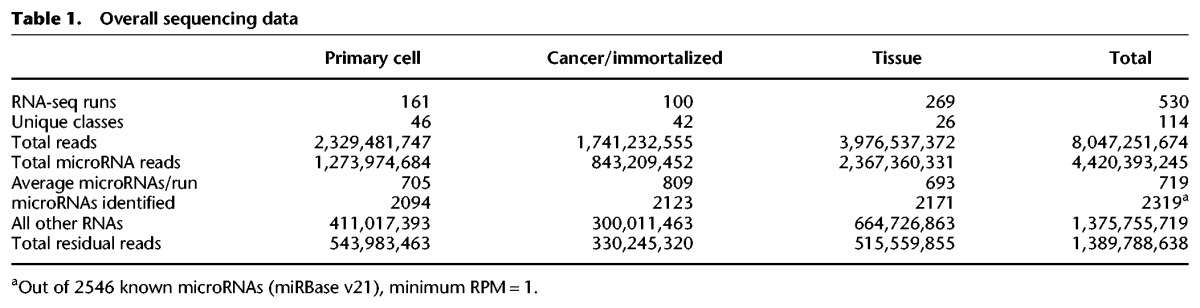
Figure 2.

Method and primary analysis of the cellular distribution of microRNAs. (A) Six hundred ninety-four total samples were processed through miRge, yielding 530 samples available for analysis and novel microRNA detection through miRDeep2 and miRanalyzer. (B) t-SNE distribution of 161 primary cells showing four main clusters (hematologic, epithelial, mesenchymal, and neural/stem cell) and subclustering by cell type. Cell types are color-coded, and round symbols indicate epithelial cells. (*) indicates an intestinal epithelial cell that was either contaminated or underwent mesenchymal transformation. (C) A selection of microRNAs that have unique expression to certain primary cell types. (*) indicates specificity for flow-sorted colonic epithelial (likely goblet) cells. (D) Across 334 microRNAs with >1000 RPM, both strands of a hairpin microRNA give rise to the dominant microRNA in fairly equal measures. (E) The presence of nearby superenhancers strongly correlates with high microRNA expression. (F) The individual cellular microRNA patterns can be used to de-convolute the cellular composition of tissue. (G) A representative hematoxylin & eosin (H&E) section of adipose with significant red blood cells (lower part of the panel) as an example of heterogeneous elements that can contribute microRNA expression (10× original magnification). (H) A H&E representative section of adipose with a small cluster of lymphocytes (lower part of the panel) that may be randomly sampled, modulating the tissue signal (10× original magnification).
The 161 primary cell RNA-seq data sets encompassed 46 main cell types, many from multiple anatomic locations (Fig. 1A; Supplemental Table S2). There were 100 cancer cell or immortalized cell line RNA-seq data sets from 42 separate cell lines (19 general cancer types) (Fig. 1B; Supplemental Table S3). The 269 small RNA-seq data sets from 26 normal tissues/organs aided in the normalization methods employed due to organ coverage from multiple separate studies (Fig. 1C; Supplemental Table S4). As much of this primary data was derived from different laboratories using different protocols, significant attention was given to potential confounding and batch effects.
We utilized the DEXUS algorithm (Klambauer et al. 2013) to identify discrete expression states for each microRNA. The resulting cell type-specific patterns of discretized microRNA expression across the 161 primary cell types (Supplemental Fig. S1) are inherently robust to batch effects. This method clustered cell types into hematologic, neural/embryonic stem cell (ESC), epithelial, and mesenchymal groups, identifying general patterns of microRNA expression. T-distributed stochastic neighbor embedding (t-SNE) clustering was then compared between uncorrected primary cell RPM data and primary cell data that underwent remove unwanted variation (RUV) normalization for five variables using the most abundant microRNAs (Risso et al. 2014). The use of RUV improved clustering of similar cell types from different experiments (Supplemental Fig. S2). We then identified 387 samples representing a cell type or tissue with RNA-seq data in more than one experiment. We used surrogate variable analysis (SVA) and 26 loosely described “biologic clusters” of tissues and cells to clearly demonstrate that, after adjusting for surrogate variables, similar tissue and cell types clustered together across experiments (Supplemental Fig. S3; Leek and Storey 2007). t-SNE was then performed separately for primary cells, cancer/immortalized cells, and tissues using RUV normalization (Fig. 2B; Supplemental Fig. S4). Akin to the DEXUS results, among primary cell types, microRNA expression patterns generated four major groups: hematologic, mesenchymal, neural/ESC, and epithelial. Strong clustering by biological group was observed for all samples, overcoming most technical concerns. We then moved to assess what microRNAs drove the formation of these different clusters.
Diverse microRNAs expression patterns
We assessed common, potentially functional microRNAs (Mullokandov et al. 2012) by their frequency of expression across the different normal cell classes (Supplemental Table S5). There were 320 microRNAs that had an RPM ≥1000 in any of the 46 normal cell types. Of these, 94 (29%) were present in only a single class of cells (Fig. 2C). Most of these are well-known associations (e.g., miR-144-3p and red blood cells or miR-1-3p with skeletal myocytes) that highlight the nonubiquitous nature of microRNA expression (Haider et al. 2014). Six microRNAs were present in all 46 cell types at this RPM threshold (miR-107, miR-103a-3p, miR-103b, miR-191-5p, miR-21-5p, and miR-92a-3p), and an additional nine microRNAs were present in all cells at a lower threshold of 100 RPM: miR-16-5p, miR-25-3p, miR-26a-5p, miR-26b-5p, miR-30d-5p, miR-101-3p, miR-128-3p, miR-140-3p, and miR-181a-5p (Supplemental Table S6). Among tissues containing a mixture of cell types, 377 microRNAs were present at an RPM ≥1000. Seven of these microRNAs (let-7a-5p, let-7c-5p, let-7b-5p, let-7f-5p, let-7g-5p, miR-26a-5p, and miR-30d-5p) were found in all tissues. Some well-known cell-specific microRNAs appear to be ubiquitous among tissues but merely reflect the presence of a certain cell type across tissues. miR-451a was abundantly present in 20 of 26 tissues but is from only one cell class (red blood cells). Likewise, miR-126-3p, abundant only in endothelial cells and platelets, was present in 21 tissues, and miR-150-5p, abundant in lymphocytes, was present in 11 tissues. We then determined microRNA abundance from the 5p or 3p arm and found the guide/“driver” (more abundant, thermodynamically stable) microRNA to be equally from either arm of the hairpin microRNA, suggesting no strand bias in microRNA selection (Fig. 2D). To augment this concept of cell-specific microRNAs, we investigated their relationships to adjacent superenhancers.
Superenhancers are dense genomic regions of transcription factor binding sites that have a multiplicative effect on increasing adjacent gene expression (Whyte et al. 2013; Suzuki et al. 2017). We examined the association between microRNA expression levels and the presence of a superenhancer within 40 kb of the microRNA loci in 11 primary cells and cancer cell lines, for which we had matching data. MicroRNA expression in the presence of a superenhancer was significantly increased compared to microRNA expression at sites not adjacent to a superenhancer (Wilcoxon rank-sum test, P < 2.2−16). This association was observed with and without batch effect adjustment and was generally consistent across samples. Importantly, cell-type restricted microRNAs showed active superenhancer activity matching those specific cells (Fig. 2E). These data further support the cell-type restricted microRNAs seen above and indicate that analyses of global tissue microRNA expression require an understanding of the source of each microRNA of interest, lest misinterpretations of the data result in spurious disease associations (Kent et al. 2014).
Taking advantage of cell-specific microRNAs, we determined the feasibility of using cellular microRNA expression data to de-convolute an overall tissue signal to discern the individual components. We investigated 15 white adipose samples from participants in the METSIM study (Civelek et al. 2013). We used CIBERSORT (Newman et al. 2015) to determine the composition of each tissue based on grouped microRNA signatures for mesenchymal cells, endothelial cells, blood, B/T lymphocytes, and dendritic cells (Fig. 2F). Surprisingly, the red blood cell component (blood) was a major and variable (18%–56%) part of each tissue, suggesting inconsistent and inadequate sample washing prior to RNA isolation (Fig. 2G). Lymphocytes were also variable (0%–5%) between samples (Fig. 2H), while endothelial cells were generally more consistent (4%–9%). We investigated a second group of colon tissues derived from patients with ulcerative colitis, Crohn's disease, or diverticulosis (Lin et al. 2016). This experiment showed a reduction in epithelium as a percent of all cell types among the ulcerative colitis samples (avg. 20%) compared to Crohn's disease (avg. 44%) and diverticulosis (avg. 61%). Inflammation was also most prominent in the ulcerative colitis samples (Supplemental Fig. S5). Altogether, these data demonstrate the importance and feasibility of solving for the cellular content of tissues to better understand the composition of the analyzed tissue.
Variable expression in cancer cell lines
Immortalized and cancer-derived cell lines are frequent surrogates for primary cells in understanding biologic pathways. However, the extent of differences in microRNA expression between these cell lines and primary cells is unknown. We analyzed fibroblasts and T lymphocytes, the only two cell types in which there exist sufficient numbers of primary and immortalized/cancer cell types to determine the extent of their microRNA similarities. An analysis of 12 primary and three immortalized fibroblast cell line microRNA signatures identified overall strong correlation (RUV-corrected, log2-normalized, pairwise R > 0.80–0.99), with the immortalized lines being slightly less correlated (Supplemental Fig. S6A). A global comparison of microRNA differences identified miR-1304-3p to be the most extreme outlier among fibroblasts (Supplemental Fig. S6B). Eight primary T lymphocyte samples and 14 T lymphocyte malignancy samples also revealed moderate to strong correlation but with separate primary and cancer-derived cell clustering (Supplemental Fig. S6C). There were more microRNAs that differed between primary and cancer-derived cells (Supplemental Fig. S6D), including miR-150-5p which was 64-fold higher in the primary T cells, as has been reported (He et al. 2014). miR-9-3p, 64-fold higher in the cancer-derived cells, has been previously reported as elevated in Hodgkin's lymphoma (Leucci et al. 2012) but not in these three cell types. Other markedly different, well-studied microRNAs include miR-363-3p, miR-146a-5p, miR-146b-5p, and miR-486-3p. We also ascertained how consistent the microRNA expression pattern of cancer cell lines would be after years of divergent growth in separate laboratories. A comparison of HeLa cells obtained from five sources had a range of expression correlation between 0.35 and 0.75, while fibroblasts from three separate batches but obtained from different organ systems had a correlation between 0.75 and 0.9 (Supplemental Fig. S7). These analyses suggest some key differences between immortalized/cancer cell lines and primary cells and highlight NIH concerns about the rigor and reproducibility of widely used cancer cell lines (http://grants.nih.gov/reproducibility/).
Novel human microRNAs
In light of the recent description of 3707 novel human microRNAs (Londin et al. 2015), we used the large breadth of our samples to determine if we could uncover additional novel microRNAs. We investigated 1.2 billion reads, unmapped by miRge, from 474 samples for putative novel microRNAs in miRDeep2 (Friedlander et al. 2012). miRDeep2 identified, and we assigned names (JHU_ID_ xxx) to, 25,218 putative “driver” (thermodynamically stable) and “passenger” (thermodynamically unstable and degraded) microRNAs from 21,338 loci, with the majority (18,480, 65%) being from individual samples and frequently (5662, 22%) identified from only a single read (Fig. 2A; Supplemental Table S7). A small percent (394, 0.7%) were identified in more than 50 samples. Additionally, 207 were the unassigned “passenger” 5p or 3p microRNAs from a known microRNA locus, and 15 were orthologous to a different species’ microRNA (primarily primate) (Supplemental Tables S8, S9). This number of new microRNAs seems impossibly high and likely mostly false positives and/or nonfunctional transcripts (Mullokandov et al. 2012). We further refined this list of novel microRNAs using complementary sources of information.
We began with the 2724 loci containing 4064 mature microRNAs that had ≥50 combined dominant microRNA reads. We then compared these samples to novel microRNAs detected on a filtered set by a second detection method, miRanalyzer (Hackenberg et al. 2011). This reduced the loci to 984. We then limited ourselves to the 652 microRNA loci that had both 5p and 3p sequences. Finally, we obtained 105 Argonaute CLIP-seq data sets and processed them through miRDeep2 to obtain 21,908 putative novel Ago-bound microRNAs. We compared these to the 652 microRNA loci to ultimately produce 495 highest confidence putative novel microRNAs (Fig. 3A; Supplemental Table S10).
Figure 3.

Some novel human microRNAs may still await characterization. (A) A nested Venn diagram was parsed down from 21,338 miRDeep2 identified novel microRNA loci to 2724 with ≥50 reads to 984 based on overlap with miRanalyzer-detected novel microRNAs to the 652 with both 5p and 3p mature microRNAs, and finally, with evidence of the RNA being Ago-bound, yielding 495 highest confidence novel microRNAs. (B) A histogram of PhyloP conservation scores averaged across the length of each mature microRNA. This collection of miRBase* v21 microRNAs has the miRGeneDB set removed. TJU novel microRNAs are from Londin et al. (2015). (C) Nine novel microRNAs were amplified that were predicted to be either cell-specific or ubiquitous. Most of these were lowly expressed. miR-21-5p was used as a control. (D) The predicted hairpin structure of novel microRNA JHU_ID_23828 is shown. (E) JHU_ID_23828 is located in the EGFL7 gene locus and shares a pri-miRNA with mir-126, an endothelial cell-enriched microRNA. (F) From the same sequencing batch, the average number of reads for JHU_ID_23828 among four endothelial cell types was 3673 and eight among 29 nonendothelial cell types ([*] P = 0.001, Mann-Whitney U test). (G) JHU_ID_23828 is present among primate species but is absent in lower mammals including Mus musculus.
To validate these putative novel microRNAs, we employed three complementary methods. First, we investigated the novel microRNAs based on a z-score generated by novoMiRank, which compared novel microRNAs to those in miRBase based on 24 features (Backes et al. 2016). We found the average z-score was right-shifted to 1.07 (indicating less similarity) for a subset of the 21,338 loci, while for the 495 highest confidence loci it was 0.90, indicating more consistency with miRBase microRNAs (Supplemental Fig. S8A,B; Backes et al. 2016).
Second, we used PhyloP (Pollard et al. 2010) to look for basewise conservation of nucleotides across 17 primates, shrew, mouse, and dog, reasoning that these putative novel microRNAs would have some conservation among primates, as recently reported (Hubisz et al. 2011; Londin et al. 2015). We compared the nucleotide conservation of all novel microRNAs against known microRNAs from miRBase v21. Although miRBase is accepted as the repository of all known microRNAs, there have been questions about the accuracy of this list, and a “high quality” subset of miRBase microRNAs can be obtained from miRGeneDB (Fromm et al. 2015). We observed that only these miRGeneDB microRNAs have a separate distribution of high conservation. The remaining miRBase microRNAs had modest conservation and were similarly distributed to both the putative novel microRNAs reported here and the 3707 novel microRNAs reported as TJU microRNAs (Fig. 3B; Londin et al. 2015).
Third, we investigated whether there was evidence that DICER1 could act upon these microRNAs. We obtained paired HCT116 wild-type and DICER1 knockout cell line RNA-seq data (Kim et al. 2016). DICER1 knockouts are known to significantly repress 3p driver microRNA levels while allowing for longer 5p microRNAs that are loaded into Ago and trimmed back from the 3p end (Hill et al. 2009). A test for the difference in proportions between wild-type and DICER1 knockout samples revealed the proportion in wild-type dropped from 0.151 to 0.047 in the DICER1 samples, representing a significant decrease (P < 2.2−16). This confirms that DICER1 is acting on some of these novel microRNAs. In summary, these analyses suggest that the 495 highest confidence putative microRNAs reported here are similar to other known microRNAs.
We then determined the characteristics of these putative novel microRNAs. The median number of samples sharing a given microRNA loci was 33 (range 3–293) (Supplemental Fig. S8C). About half, 264, were located within a gene locus. Thirty-four were also adjacent to a known microRNA. In comparison to the 3707 novel TJU microRNAs (Londin et al. 2015), only 257 (52%) were shared between both data sets. The median number of reads per “driver” microRNA in these 495 putative novel microRNAs was 282 (range 51–257,582). Total reads per microRNA did not correlate with the number of samples within which the microRNA was detected (R2 < 0.01) (Supplemental Fig. S9). Finally, we assessed the seed sequences (bases 2–7) of these putative novel microRNAs for their similarities to known microRNAs. There were 411 unique seed sequences among the driver novel microRNAs. Of these, 226 (55%) overlapped with a known microRNA seed sequence. This indicates the potential for more shared regulatory control of genes often in a more cell-specific manner.
We then validated nine novel microRNAs from six different cell types or tissue by PCR (Fig. 3C). As an example of potentially interesting novel microRNAs, JHU_ID_23828-3p was validated by PCR and is located in intron 8 of the EGFL7 gene, approximately 900 bp from mir-126 and within the same pri-miRNA transcript (Fig. 3D,E; Chang et al. 2015). Unsurprisingly, due to the specific high abundance of miR-126 in endothelial cells, JHU_ID_23828-3p was also significantly more abundant in four endothelial cell lines (avg. 3673 reads) than 30 other cell types (avg. eight reads; P = 0.001, Mann-Whitney U test) (Fig. 3F). Additionally, while miR-126 is highly conserved throughout chordates, JHU_ID_ 23828 is only conserved among primates (Fig. 3G).
Wide variation in the distribution of isomiRs
Due to the inexact cutting of DICER1 and DROSHA and nucleotide additions/modifications, a collection of mostly similar sequences (with most diversity on the 3′ end) make up the isomiR family of a microRNA (Morin et al. 2008; Neilsen et al. 2012). IsomiR families can be comprised of hundreds of different sequences, but most sequences that constitute an isomiR family are templated length variants of the canonical (consensus) sequence and additional nucleotides added to the 3′ end. We evaluated the isomiR distributions of 126 primary cell and 82 cancer/immortalized cell samples.
Technical factors, caused by the different chemistries of sequencing kits from different vendors, may modulate isomiR families, particularly in respect to nontemplate additions. We found that nontemplated adenine additions were more common in data obtained from runs performed on older Illumina sequencers (Genome Analyzer I, II, and IIx) compared to the HiSeq (1000, 2000, 2500) systems (P < 2.4−9, paired t-test). We determined that the main drivers of this difference were the changing methods of the Illumina sequencing library kits acting upon a small subset of microRNAs (Supplemental Fig. S10A; Baran-Gale et al. 2015). This was taken into consideration when making comparisons of nontemplated additions across samples. We evaluated both 3′ templated length variants ±4 bases from the reported canonical sequence (miRBase v21) and variations in the 5′ nucleotide starting location, which would affect the predicted seed sequence of the microRNA (Fig. 4A; Supplemental Table S11). The most abundant isomiR was widely variable between cells and often incongruent with the expected sequence. In primary cells, 556 microRNAs had reads sufficient for analysis. A comparison of reads, all with the same 5′ starting location, revealed the most abundant isomiR to always be the canonical sequence for only 182 (33%) microRNAs. There were 204 (37%) microRNAs in which the miRBase v21 canonical sequence was never the most abundant sequence (Fig. 4A). This includes miR-10a-5p, in which a 1-bp-shorter sequence was the dominant species in 111 of 112 samples, and miR-140-3p, in which the dominant species was 2 bp longer in 91 of 113 samples (Supplemental Table S11).
Figure 4.

IsomiRs are a challenge to characterizing microRNA levels. (A) Among primary cells, the most abundant (dominant) sequence for many microRNAs differs in length from the canonical “C” miRBase.org v21 sequence by up to 4 bases (C−4 to C+4). Between cell types, length diversity is also present, as evidenced by microRNAs that are not entirely of one length. Eighteen representative microRNAs from 556 in total. (B) The general features of microRNA length among cancer/immortalized cells are similar, but the microRNA processing in these cells skews toward randomness. See also Supplemental Figure 12. (C) miR-150-5p, a lymphocyte-specific microRNA, shows a diversity of nontemplated nucleotide addition at the +1 site on the 3′ end. Cytosine is the templated (genomic) nucleotide at this position and is not shown. (D) miR-151a-3p, a ubiquitous microRNA, has marked variation in the first nontemplated nucleotide addition. Cytosine is again the templated nucleotide at this position.
Across the primary cells, 84 microRNAs also had more abundant reads for template sequences that started proximal or distal to the canonical 5′ starting position (Supplemental Table S12), which is distinct from the 3′ changes reported in Figure 4A. This included miR-199b-3p (+1 shift), miR-181c-3p (+1 shift), and miR-302a-5p (+3 shift), all of which had highly abundant reads containing a completely different seed sequence than the one currently assigned, with strong implications for the targeting of genes (Tan et al. 2014). Although technical factors may be responsible for some variation between cell types, the data clearly demonstrate a need to revise our understanding of the appropriate canonical microRNA sequences for better reproducibility and computational target prediction (Mestdagh et al. 2014; Agarwal et al. 2015).
We then ascertained the nucleotide identity of the nontemplated 3′ addition at the +1 position from the most abundant canonical isomiR reported above. Across the 126 cell types, 56% of nontemplate additions were adenines, followed by 41% uracils, 1% guanines, and 3% cytosines (Neilsen et al. 2012). Between cell types, these values were highly variable, with additional nontemplated adenines ranging from 28% (iPSC neurons) to 82% (H9 differentiated cells) of all additional nucleotides. As this may be related to library preparation, as described, we investigated just the 32 different primary cells that we generated in a shared batch and observed a twofold range, from 31% (dermal neonatal fibroblast) to 69% (bronchial epithelium), of all +1 additions being adenines, suggesting a real biological phenomenon was present (Supplemental Fig. S10B).
Finally, we assessed what percentage of all reads from a given microRNA family were assigned to the most abundant sequence. On average, only 45% of all microRNA reads for each isomiR group were assigned to the most abundant isomiR sequence (Supplemental Fig. S11). This was quite variable and rarely >90%, suggesting methods that fail to acquire isomiRs significantly underestimate the presence of microRNAs in a variable fashion (Mestdagh et al. 2014).
We then investigated the isomiRs of 82 samples from 35 different cancer (or immortalized) cell types. Here, we found subtle differences in the canonical microRNAs relative to primary cells. Only 22% of microRNAs (versus 33% of primary cells) had the most abundant isomiR as the miRBase v21 canonical sequence in 100% of cells. The diversity of most abundant microRNA sequences between samples (as characterized by Shannon entropy) among cancer/immortalized cells was a ∼20% increase in disorder over primary cells (P < 0.005, Wilcoxon rank-sum test), suggesting increased DICER1 and DROSHA miscleavages (Fig. 4B; Supplemental Fig. S12; Supplemental Table S13). Nontemplated adenines (62%) and uracils (30%) were again the dominant 3′ modifications in immortalized/cancer cell samples but could vary widely between both primary and cancer/immortalized cells as a reflection of either biological differences or technical factors (Fig. 4C,D).
Discussion
Here, we provide the first comprehensive delineation of cell-specific expression patterns of human microRNAs. These ubiquitous and cell-specific patterns of microRNA expression, identified by RNA-seq data, are further supported by matching superenhancer data and highlight that there are many fewer ubiquitous microRNAs than currently believed. Of key importance is the specific expression patterns of certain microRNAs. Namely, miR-451a and miR-144 are exclusively expressed in red blood cells, yet, because blood is found in all tissues, they have been inappropriately assigned a variety of functions in epithelial and mesenchymal cells based on misinterpreted tissue-level data (Kent et al. 2014; Halushka 2016).
Having this encyclopedic knowledge of microRNA localization provides additional benefits. We provided two examples, using colon and adipose tissue, of how cell-specific patterns can de-convolute complex tissue expression patterns. As more data are added to this growing cellular microRNAome, we can effectively work to reduce expression heterogeneity in tissue samples across large studies (McCall et al. 2016). This will improve the interpretation of tissue microRNA expression levels, which, to date, has significantly muddied our understanding of microRNA localization and biologically relevant function (Kent et al. 2014).
This study also has implications for the measurement and manipulation of microRNA expression. By using cell, not tissue, data, we could observe cell-specific differences in the isomiR composition of microRNAs. For 205 common microRNAs, the most abundant sequence did not match the reported sequence in mirBase.org. This difference, which has previously been reported on a smaller scale (Morin et al. 2008), can have an important effect on PCR- and hybridization-based strategies that may target a secondarily abundant microRNA in the isomiR family, altering the reported expression level of a microRNA. This could explain some of the variability of microRNA expression across methods demonstrated by the miRQC project (particularly between RNA-seq and hybridization approaches) (Mestdagh et al. 2014) and impact the biologic activity of mimics and inhibitors relative to the true microRNA 5p end (Guo et al. 2014). We also uncovered isomiR differences at the +1 position related to different library preparation kits. Further, we found these differences were significant in only a small subset of microRNAs. This technical driver of isomiR type will challenge those groups working toward a standard isomiR nomenclature.
The identification of novel microRNAs from deep sequencing data sets appears fraught with challenges. It is likely that there are more microRNAs to be discovered in rare cell types and in developmental stages that have not been assessed. However, the risk of overinterpreting short RNAs as microRNAs is high. As we showed, using the popular tool miRDeep2 to find novel microRNAs, we could obtain 21,338 loci, which is ∼10× more than are present in miRBase v21! Using a number of validation steps, we reduced this number down to 495 highest confidence miRNAs, which is roughly one new microRNA per sample evaluated. Although we report them as “highest confidence” putative novel microRNAs, they are still not definitive microRNAs. Many are likely false positives and more proof of these RNA species acting as microRNAs must come from in vivo studies, which were beyond the scope of this project. We also likely lost some true positive microRNAs by retaining only those microRNAs with multiple sources of evidence. The PhyloP conservation data (Fig. 3B) show that, beyond the most ideal microRNAs identified in miRGeneDB, there is a lack of genetic conservation, with overlap in a large segment of miRBase microRNAs and the novel microRNAs reported here and in a prior large study (Londin et al. 2015). Either this suggests that much of miRBase is inaccurate or that, while conservation provides evidence for a microRNA to be authentic, it is not a requirement. Human-specific microRNAs may represent a class of underreported microRNAs. New methods, taking into account our collective knowledge of known microRNA structures and isomiR families, must be considered for the next generation of novel microRNA detection algorithms (Backes et al. 2016).
There are important limitations to this work. Because much of the data is taken from public sources, in which the RNA-seq has been performed across different platforms and with different sequencing methods, significant technical variation in microRNA expression is present. To counter this, we performed extensive normalization. Certain aspects of the data also helped with normalization, including 98% of sequencing runs being performed on an Illumina Genome Analyzer or HiSeq system and >74% of libraries being generated using an Illumina sequencing kit. Our approach to batch-effect adjustment and between-sample normalization resulted in clustering by cell or tissue type even when those samples came from multiple different experiments performed in different laboratories. Our data matched certain “ground truths” about specific microRNA expression in certain cell types, including miR-192 in epithelial cells, miR-126 in endothelial cells and platelets, and miR-9 in brain (McCall et al. 2011a; Haider et al. 2014; Kent et al. 2014). As well, another recent paper investigating microRNA RNA-seq across multiple laboratories found relative quantification to be “remarkably accurate and reproducible” (Giraldez et al. 2017), consistent with our work. Despite this, technical factors certainly drive some of the variation and clustering in these samples. In addition, some of these cell types have few to no replicates, and it will be important to continue adding data for these cells. It is also unknown the extent to which microRNA expression patterns of cultured cells match cells in vivo. Finally, we are only moving toward a complete cellular microRNAome, as many cell types (hepatocytes, neutrophils, pneumocytes) were not available for this study.
These microRNA expression patterns from 42 cell types are the first step toward a complete understanding of microRNA expression across all cells and establishing a human cell atlas. Our data also demonstrate general consistencies, but not without some concerning differences, between primary cells and immortalized/cancer cell lines. This work brings a new realization to the importance of cellular microRNA localization and enhances our understanding of this powerful regulatory RNA species.
Methods
Cell isolation and sequencing methods
Twenty-nine cell types were obtained from Lonza and cultured according to the manufacturer's specifications for no more than six passages (Supplemental Table S14). Primary coronary endothelial cells, smooth muscle cells, and fibroblasts from a 29-yr-old man were isolated and cultured in ECM or SMC media (ScienCell), and primary aortic endothelial cells were isolated and cultured from a 10-yr-old girl as described (McCall et al. 2011a). Red blood cells were isolated from whole blood by centrifugation at 900g for 10 min at room temperature and then pipetted and collected. Colonic epithelial cells were obtained by flow sorting (BD FACSAria II) of EpCAM+ cells through a modification of the protocol of Dalerba et al. (2007). T lymphocytes were obtained by flow sorting of a homogenized spleen sample for CD3+ cells. Cortical neurons were grown from iPSCs using the methods described (Xu et al. 2016). RNAs were isolated with the miRNeasy kit (Qiagen) according to the manufacturer's protocol. RNA integrity was assessed using Agilent BioAnalyzer, and the RNA concentrations were measured using a NanoDrop 2000 UV-Vis spectrophotometer. Small RNA libraries were prepared using the Illumina TruSeq Small RNA Library Preparation kit according to the manufacturer's protocol or purified using a Pippin Prep with a 3% Agarose Gel Cassette (Sage Science) and a size selection of 122–157 bp. Multiplexed sequencing was performed as single-read 50 bp, using rapid run mode and v2 chemistry on HiSeq 2000 or HiSeq 2500 systems (Illumina) at either the Genome Technology Center at the NYU School of Medicine or the Next Generation Sequencing Center at the Johns Hopkins University School of Medicine.
Differentiation of hES cells into dopamine neurons
H1 human embryonic stem cells (Wi Cell) were cultured using standard protocols on inactivated mouse embryonic fibroblasts. Differentiation of hES cells to dopamine neurons was done as described (Kriks et al. 2011). Single-cell hES cells were cultured on matrigel-coated plates at a density of 40,000 cells/cm2 in SRM media containing growth factors and small molecules, including FGF8 (100 ng/mL), SHH C25II (100 ng/mL), LDN-193189 (100 nM), SB431542 (10 µM), CHIR99021 (3 µM), and Purmorphamine (2 µM) for the first 5 d. Over the next 6 d, cells were maintained in neurobasal medium containing B27 minus vitamin A, N2 supplement along with LDN193189 and CHIR99021. In the final stage, they were made into a single-cell suspension and seeded at a density of 400,000/cm2 on polyornithine- and laminin-coated plates in a neurobasal media containing B27 minus vitamin A, BDNF (20 ng/mL), GDNF (20 ng/mL), TGFB1 (1 ng/mL), ascorbic acid (0.2 mM), cAMP (0.5 mM), and DAPT (10 µM) until maturation (∼60 d).
Publicly available RNA-seq data
Sequence Read Archive and Array Express were searched for the terms “human” and “microRNA” or “miRNA,” and the records were evaluated for any human primary cell type, cancer cell line, transformed/immortalized cell line, or normal human tissue. These generally represented the “control” materials in experiments. In total, 655 SRA files were downloaded and converted into FASTQ files using fastq-dump of the SRA Toolkit. Sequencing was performed on Illumina systems (Genome Analyzer I, II, IIx, HiSeq 1000, HiSeq 2000, HiSeq 2500, MiSeq) and AB SOLiD Systems. Solexa colorspace data were converted to standard FASTQ format using SOLiD2Std.pl. Data searches and collection ended on Feb. 18, 2016. Additional RNA-seq data were obtained from project PRJNA352864 for a de-convolution study. The cell line H1264, which is a lung carcinoma cell line, has been reported as being cross-contaminated with H157, which is a separate human lung carcinoma cell line (ICLAC.org). However, in the context of the way data from this cell line were used, that distinction is of no consequence here.
microRNA annotation via miRge
miRge was used as described (Baras et al. 2015). Briefly, miRge removes sequence adapters and performs quality control through CutAdapt (Chen et al. 2014). Then, reads are collapsed together and undergo a five-step alignment to customized RNA libraries, utilizing Bowtie and designed to optimally capture microRNAs and their isomiRs (Langmead et al. 2009). For microRNAs with high sequence similarity (e.g., hsa-let-7a-5 and hsa-let-7c-5p), miRge reports them together (e.g., hsa-let-7a-5p/7c-5p). The generally used command line for miRge was perl miRge.pl –adapter illumina –species human –CPU 8 –SampleFiles a.fastq,b.fastq… In all, 694 RNA-seq FASTQ files were run in batches or individually. Prior to the run, the presence and type of adapter was noted for each FASTQ file. A variety of sequencing methods resulted in a range of adapters used. For some FASTQ files, adapters were removed using the stand-alone version of CutAdapt. A consensus adapter sequence could not be determined for 45 samples, and the sequences were trimmed to 21 bp using the CutAdapt –u command (e.g., $ cutadapt <FILE>.fastq -u -14 -o <FILE>_cut.fastq for a 35-bp read length). These samples were excluded from isomiR analyses. The 159 samples that had less than 1 million microRNA reads were excluded and are not represented in the data. We also removed five tissue samples (SRR1635903-8) with extreme technical skewing of microRNA reads (>60% of all reads were microRNA let-7b-5p).
DEXUS analysis
The DEXUS algorithm was used to fit a mixture of five negative binomial distributions to the RNA-seq counts from all cell-type samples (dexus R/BioC package version 1.14.0) (Klambauer et al. 2013). We then selected microRNAs that had at least one highly expressed distribution (highest mean > 50,000). The most likely distribution from which each microRNA/sample value came (called responsibilities in the dexus package) was used as a discretized measure of expression. Distributions with a mean less than 2500 were merged into a background/unexpressed distribution. This type of expression discretization has been shown to greatly reduce batch effects when combining data across studies and technologies (McCall et al. 2011b, 2014).
Remove unwanted variation normalization of microRNA samples
The remove unwanted variation algorithm (Risso et al. 2014) using replicate samples (RUVSeq R/BioC package version 1.8.0) was used to estimate five latent factors separately for combined primary cell and cancer cell line data and tissue data. Replicate samples were defined using biologically based clusters of tissues and cells. We verified the ability of the five estimated latent factors to capture and adjust for batch effects by examining biological clusters comprised of multiple experiments. The RUV-normalized data clustered by biological cluster and not experimental batch.
Surrogate variable analysis to address batch effects in microRNA samples
The surrogate variable analysis method (Leek and Storey 2007) was used to identify, estimate, and adjust for latent sources of variation, e.g., batch effects, after accounting for biological differences between tissues and cell types.
t-stochastic neighbor embedding
t-SNE was performed using the Rtsne package (version 0.11) in R on RPM-corrected cell data and RUV-normalized data for primary cells, cancer/immortalized cells, and tissue samples with perplexity set at 10 after evaluations of perplexity values of 1–40 for each (van der Maaten and Hinton 2008). All RUV data were normalized to summed counts and log2-transformed.
Determining the ubiquity of microRNAs
All 162 primary cell runs were collapsed into their 46 unique cell types, keeping the maximum RPM value for each microRNA. This method was replicated for the 26 tissue types. The frequency of a microRNA being >100 RPM across each common cell type was determined in a histogram.
Calculation of 5p, 3p dominance
The sum of each microRNA's RPM value across all 162 primary cell runs was generated. microRNAs that had fewer than 1000 summed RPMs were excluded. Equivalent levels represent the reads for 5p and 3p being within 10% of each other.
Superenhancer analysis
Superenhancer genomic location data were obtained from the dbSUPER website (Khan and Zhang 2016) for 11 cells (primary or cancer/immortalized) in which there were matched RNA-seq data. As microRNA RPM data can be variable between samples, the specific samples used were SRR5127214, SRR5127200, SRR1264358, SRR1575597, SRR1200888, SRR5127213, SRR020286, SRR5127233, SRR873410, SRR1055962, and SRR5127217. The distance between 939 microRNA loci (hg19) and all superenhancers was determined and only those of distance <40 kb to a microRNA loci were evaluated. The RPM (log2) of the mature microRNA strand was obtained for each genomic microRNA loci. Because some microRNAs are expressed from multiple genomic locations (e.g., let-7a-1, let-7a-2, and let-7a-3 on Chromosomes 9, 11, and 22) and there is no way to distinguish the genomic source of the mature microRNA, we assigned the mature microRNA expression value (let-7a-5p) to all sites. We caution that the activity of these superenhancers on adjacent genes and microRNAs is generally unknown, and these reported correlations are not proof of activity of the superenhancer on the microRNA.
CIBERSORT analysis
The CIBERSORT (Newman et al. 2015) web application, cibersort.stanford.edu, was used to create a signature gene matrix using the following parameters: a maximum condition number of 20, q value threshold of 0.5, and between five and 50 signature genes per cell type. This signature gene matrix was then used to estimate the composition of tissue samples from a study of inflammatory bowel disease (Lin et al. 2016) and the METSIM study (Civelek et al. 2013).
Immortalized/cancer vs. normal cells
RUV-corrected microRNA data were plotted using the pheatmap function in R. A H7 ESC sample was used as an outgroup for each correlation. A MAplot was generated for the average of 12 primary fibroblast cell cultures vs. three immortalized fibroblast cell cultures. A separate MAplot was generated for eight primary T cell cultures vs. 14 T cell leukemias/lymphomas.
Novel microRNA discovery—miRDeep2
All reads of length 18–25 bp that were initially unmapped were collected using a python script from each appropriate run (479 files). Samples that were trimmed to 21 bp in the initial miRge run were excluded. The SRA was searched for all instances of Argonaut (Ago)-precipitated RNA, identifying 105 reads from 19 tissues and cells (Supplemental Table S15). This includes 43 reads used in Londin et al. (2015). All reads of length 18–25 bp were also taken from the ∼1.7 billion unmapped Ago CLIP-seq reads. Of note, distinguishing linker sequences in this data set was not necessarily feasible, and 54% of reads were adjusted by CutAdapt to only 21- or 22-bp lengths using the command described above, likely resulting in an overidentification of Ago-bound microRNAs. Both the 479 standard small microRNA RNA-seq unmapped samples and the 108 Ago reads were processed in miRDeep2 for novel microRNA detection and aligned to the human genome (GRCh38/hg38). microRNA locations were compared to known repeat elements using the RepeatMasker track from the UCSC Genome Browser.
Novel microRNA discovery—miRanalyzer
All reads of length 18–25 bp were taken from the unmapped miRge files as above. Using a python script, reads were clustered together based on their alignment to the human genome. Clusters were removed if they (1) were <10 total reads; (2) were <3 unique reads; (3) were >30 nt in total length; (4) overlapped a repeat element; (5) had a poly(A) tract ≥ 5 in the 5′ end; and (6) had a poly(T) tract ≥5 in the 3′ end. Remaining reads were processed by miRanalzyer for novel microRNA detection run locally (Hackenberg et al. 2011).
NovoMiRank
A subset of the 21,338 initial microRNA loci and all 495 best putative novel microRNA loci were evaluated using novoMiRank. The calculated z-scores of these novel microRNAs were compared to the z-score values of all miRBase versions (Backes et al. 2016).
PhyloP
Basewise conservation scores across microRNAs were calculated from PhyloP data downloaded from http://hgdownload.cse.ucsc.edu/goldenPath/hg38/phyloP20way/ (Tyner et al. 2017) using the PHAST package (Hubisz et al. 2011). This species set contained information on 17 primates, tree shrew, mouse, and dog. For each microRNA, the mean of PhyloP values across the entire mature microRNA was calculated. This was performed for all miRBase, TJU novel microRNAs (Londin et al. 2015) and 495 novel microRNAs in this study.
DICER1-modulated novel microRNAs
SRA samples from BioProject PRJNA312310 were obtained and processed through miRge. All 495 novel microRNAs were compared to the unmapped reads file, and the total number of reads were counted per sample and based upon the 3p or 5p status of the driver microRNA.
Pri-microRNA localization
pri-miRNA localization was performed using the UCSC tracks generated by Chang et al. (2015).
Comments on novel microRNA localization
For many novel putative microRNAs, the sequence reads overlapped, with several bases of extension/difference between samples. Thus, the exact chromosome location of each novel microRNA is from a single sample of the collection and may not reflect the best absolute location on GRCh38/hg38. The microRNAs designated as .5p/.3p were named as such, as each of these microRNA loci was identified in more than one sample, with two different pre-miRNA structures designating the sequence to the 5p or 3p arm. There were no “passenger” reads to distinguish the correct structure, so either location remains plausible.
Novel microRNA seed region analysis
The seed region (bases 2–7) was identified on each purported novel microRNA. The novel microRNA driver strand seed region was compared to all seed regions of microRNAs in miRBase v21.
Amplification of novel microRNAs
Amplification of novel PCRs was based on the stem–loop method of reverse transcriptase (RT) followed by PCR amplification of the microRNA as performed (Londin et al. 2015). miR-21-5p, a ubiquitous and abundant microRNA, was used as a positive control for all RNA sources. All RT primers, PCR primers, and PCR conditions are provided in Supplemental Table S16.
IsomiR analysis
A Perl script was generated that took the mapped.csv file and counted the reads for each microRNA's canonical microRNA sequence (from miRBase v21), length variants from −4 to +4 bp around the canonical sequence, additional canonical sequences, and the number of reads for nontemplated (nongenomic) nucleotide additions (A,G,C,U) to the maximal count canonical length variant. Only microRNAs with 1000+ total reads and >10% of reads that were canonical length variants were evaluated. One hundred twenty-six primary cell samples (15,897 microRNA reads) and 82 cancer cell samples from 35 unique cancer (or immortalized) cell types had appropriate data for analysis. The nomenclature C−4, C−3, C−2, C−1, C, C+1, C+2, C+3, C+4 indicate the length of the dominant templated microRNA species relative to the canonical (C) sequence.
Nontemplated nucleotide addition correlations
The library preparation method and sequencing machine type were obtained from the Sequence Read Archive site, referenced manuscript, or postulated from the adapter sequence for each sample. Some library data were incomplete or unknown, and some sequencer data were inconsistent. We divided the samples into those that were prepared by any Illumina library system (v1, v1.5, DGE, TruSeq) versus any other method, including NEBNext or “homebrew” protocols. The vast majority of samples (>80%) used an Illumina system. We also divided the samples by whether they were sequenced on an older Genome Analyzer system (I, II, IIx) or a newer HiSeq system (1000, 2000, 2500). All microRNAs with sufficient reads obtained for both library method types (n = 272) or sequencer types (n = 267) were analyzed for the percent of nontemplated adenines or uracils added at the +1 position. A paired t-test for means was determined for the two comparisons.
Entropy analysis
The distribution of the lengths of microRNA species detected from a given microRNA family (locus) was characterized relative to the length of the canonical sequence as (≤−4, −3, −2, −1, 0, 1, 2, 3, ≥4). The degree of disorder in the cell line culture samples was characterized relative to the median Shannon entropy of the primary cell culture samples; this was used as the reference point in the calculation of percent maximal information loss (relative and normalized entropy calculation).
Data access
The sequencing data from this study have been submitted to the NCBI BioProject database (https://www.ncbi.nlm.nih.gov/bioproject) under accession number PRJNA358331 (SRA accession numbers SRR5127200-36 and SRR5139121). All custom scripts from this study are available as Supplemental Material. All read information has been submitted to Bioconductor and is available at: https://github.com/mccallm/microRNAome or https://bioconductor.org/packages/devel/data/experiment/html/microRNAome.html and as Supplemental Material. All RPM data from primary and cancer cells have been submitted to the UCSC Genome Browser (https://genome.ucsc.edu/cgi-bin/hgHubConnect) as regular tracks and barChart tracks for primary cells and cancer/immortalized cells under the titles “Human cellular microRNAome” and “Human cellular microRNAome barChart.”
Supplementary Material
Acknowledgments
The authors thank C. Porter and L. Blosser for their work in isolating colonic epithelium; Gourav Dey for illustrations; Srikanth Manda for cell culture and bioinformatics; both Josh Hertel and Tai C. Huang for RNA isolation; Bastian Fromm, Dongwon Lee, and Ashish Kapoor for helpful conversations; and Adriana Heguy and the NYUMC Genome Technology Center. M.K.H. was supported by the American Heart Association [13GRNT16420015]. The NYUMC Genome Technology Center is partially supported by the National Institutes of Health (NIH) Cancer Center Support Grant, P30CA016087, at the Laura and Isaac Perlmutter Cancer Center. A.P. was supported by NCI's Clinical Proteomic Tumor Analysis Consortium initiative (NIH Grants U24CA160036 and U24CA210985). P.L-R. was supported by the National Fund for Scientific and Technological Development, FONDECYT 1151008, Government of Chile. M.N.M. was supported by NIH Grants R00HG006853, R01GM083084, and UL1TR002001. This work was supported by grants from MSCRFII-0429 and MSCRFII-0125 to V.L.D., 2013-MSCRF-0054 to J.X., 2014-MSCRF-0665 to M.K., and NIH/NINDS NS67525, NS37388 to T.M.D. and V.L.D. T.M.D. is the Leonard and Madlyn Abramson Professor in Neurodegenerative Diseases.
Author contributions: M.K.H., A.P., and K.H.B. conceived the project. M.S.K., P.L-R., T.M.D., J.X., M.K., and V.L.D. generated cell data. A.H.P., C.J.M., A.S.B., Y.L., D.E.A., A.Z.R., and M.N.M. performed computational analysis. M.A. validated novel microRNAs, and M.K.H. and M.N.M. wrote the paper.
Footnotes
[Supplemental material is available for this article.]
Article published online before print. Article, supplemental material, and publication date are at http://www.genome.org/cgi/doi/10.1101/gr.222067.117.
References
- Agarwal V, Bell GW, Nam JW, Bartel DP. 2015. Predicting effective microRNA target sites in mammalian mRNAs. eLife 4: e05005. [DOI] [PMC free article] [PubMed] [Google Scholar]
- Ambros V. 2004. The functions of animal microRNAs. Nature 431: 350–355. [DOI] [PubMed] [Google Scholar]
- Backes C, Meder B, Hart M, Ludwig N, Leidinger P, Vogel B, Galata V, Roth P, Menegatti J, Grasser F, et al. 2016. Prioritizing and selecting likely novel miRNAs from NGS data. Nucleic Acids Res 44: e53. [DOI] [PMC free article] [PubMed] [Google Scholar]
- Barad O, Meiri E, Avniel A, Aharonov R, Barzilai A, Bentwich I, Einav U, Gilad S, Hurban P, Karov Y, et al. 2004. MicroRNA expression detected by oligonucleotide microarrays: system establishment and expression profiling in human tissues. Genome Res 14: 2486–2494. [DOI] [PMC free article] [PubMed] [Google Scholar]
- Baran-Gale J, Kurtz CL, Erdos MR, Sison C, Young A, Fannin EE, Chines PS, Sethupathy P. 2015. Addressing bias in small RNA library preparation for sequencing: a new protocol recovers microRNAs that evade capture by current methods. Front Genet 6: 352. [DOI] [PMC free article] [PubMed] [Google Scholar]
- Baras AS, Mitchell CJ, Myers JR, Gupta S, Weng LC, Ashton JM, Cornish TC, Pandey A, Halushka MK. 2015. miRge - A multiplexed method of processing small RNA-seq data to determine microRNA entropy. PLoS One 10: e0143066. [DOI] [PMC free article] [PubMed] [Google Scholar]
- Baskerville S, Bartel DP. 2005. Microarray profiling of microRNAs reveals frequent coexpression with neighboring miRNAs and host genes. RNA 11: 241–247. [DOI] [PMC free article] [PubMed] [Google Scholar]
- Chang TC, Pertea M, Lee S, Salzberg SL, Mendell JT. 2015. Genome-wide annotation of microRNA primary transcript structures reveals novel regulatory mechanisms. Genome Res 25: 1401–1409. [DOI] [PMC free article] [PubMed] [Google Scholar]
- Chen C, Khaleel SS, Huang H, Wu CH. 2014. Software for pre-processing Illumina next-generation sequencing short read sequences. Source Code Biol Med 9: 8. [DOI] [PMC free article] [PubMed] [Google Scholar]
- Cheng WC, Chung IF, Tsai CF, Huang TS, Chen CY, Wang SC, Chang TY, Sun HJ, Chao JY, Cheng CC, et al. 2015. YM500v2: a small RNA sequencing (smRNA-seq) database for human cancer miRNome research. Nucleic Acids Res 43: D862–D867. [DOI] [PMC free article] [PubMed] [Google Scholar]
- Civelek M, Hagopian R, Pan C, Che N, Yang WP, Kayne PS, Saleem NK, Cederberg H, Kuusisto J, Gargalovic PS, et al. 2013. Genetic regulation of human adipose microRNA expression and its consequences for metabolic traits. Hum Mol Genet 22: 3023–3037. [DOI] [PMC free article] [PubMed] [Google Scholar]
- Dalerba P, Dylla SJ, Park IK, Liu R, Wang X, Cho RW, Hoey T, Gurney A, Huang EH, Simeone DM, et al. 2007. Phenotypic characterization of human colorectal cancer stem cells. Proc Natl Acad Sci 104: 10158–10163. [DOI] [PMC free article] [PubMed] [Google Scholar]
- Friedlander MR, Mackowiak SD, Li N, Chen W, Rajewsky N. 2012. miRDeep2 accurately identifies known and hundreds of novel microRNA genes in seven animal clades. Nucleic Acids Res 40: 37–52. [DOI] [PMC free article] [PubMed] [Google Scholar]
- Fromm B, Billipp T, Peck LE, Johansen M, Tarver JE, King BL, Newcomb JM, Sempere LF, Flatmark K, Hovig E, et al. 2015. A uniform system for the annotation of vertebrate microRNA genes and the evolution of the human microRNAome. Annu Rev Genet 49: 213–242. [DOI] [PMC free article] [PubMed] [Google Scholar]
- Giraldez MD, Spengler RM, Etheridge A, Godoy PM, Barczak AJ, Srinivasan S, De Hoff PL, Tanriverdi K, Courtright A, Lu S, et al. 2017. Accuracy, reproducibility and bias of next generation sequencing for quantitative small RNA profiling: a multiple protocol study across multiple laboratories. bioRxiv doi: https://doi.org/10.1101/113050.
- Guo L, Zhao Y, Yang S, Zhang H, Chen F. 2014. A genome-wide screen for non-template nucleotides and isomiR repertoires in miRNAs indicates dynamic and versatile microRNAome. Mol Biol Rep 41: 6649–6658. [DOI] [PubMed] [Google Scholar]
- Hackenberg M, Rodriguez-Ezpeleta N, Aransay AM. 2011. miRanalyzer: an update on the detection and analysis of microRNAs in high-throughput sequencing experiments. Nucleic Acids Res 39: W132–W138. [DOI] [PMC free article] [PubMed] [Google Scholar]
- Haider BA, Baras AS, McCall MN, Hertel JA, Cornish TC, Halushka MK. 2014. A critical evaluation of microRNA biomarkers in non-neoplastic disease. PLoS One 9: e89565. [DOI] [PMC free article] [PubMed] [Google Scholar]
- Halushka MK. 2016. MicroRNA-144 is unlikely to play a role in bronchiolitis obliterans syndrome. J Heart Lung Transplant 35: 543. [DOI] [PubMed] [Google Scholar]
- He Y, Jiang X, Chen J. 2014. The role of miR-150 in normal and malignant hematopoiesis. Oncogene 33: 3887–3893. [DOI] [PubMed] [Google Scholar]
- Hill DA, Ivanovich J, Priest JR, Gurnett CA, Dehner LP, Desruisseau D, Jarzembowski JA, Wikenheiser-Brokamp KA, Suarez BK, Whelan AJ, et al. 2009. DICER1 mutations in familial pleuropulmonary blastoma. Science 325: 965. [DOI] [PMC free article] [PubMed] [Google Scholar]
- Hubisz MJ, Pollard KS, Siepel A. 2011. PHAST and RPHAST: phylogenetic analysis with space/time models. Brief Bioinform 12: 41–51. [DOI] [PMC free article] [PubMed] [Google Scholar]
- Janssen HL, Reesink HW, Lawitz EJ, Zeuzem S, Rodriguez-Torres M, Patel K, van der Meer AJ, Patick AK, Chen A, Zhou Y, et al. 2013. Treatment of HCV infection by targeting microRNA. N Engl J Med 368: 1685–1694. [DOI] [PubMed] [Google Scholar]
- Kent OA, McCall MN, Cornish TC, Halushka MK. 2014. Lessons from miR-143/145: the importance of cell-type localization of miRNAs. Nucleic Acids Res 42: 7528–7538. [DOI] [PMC free article] [PubMed] [Google Scholar]
- Khan A, Zhang X. 2016. dbSUPER: a database of super-enhancers in mouse and human genome. Nucleic Acids Res 44: D164–D171. [DOI] [PMC free article] [PubMed] [Google Scholar]
- Kim YK, Kim B, Kim VN. 2016. Re-evaluation of the roles of DROSHA, Exportin 5, and DICER in microRNA biogenesis. Proc Natl Acad Sci 113: E1881–E1889. [DOI] [PMC free article] [PubMed] [Google Scholar]
- Klambauer G, Unterthiner T, Hochreiter S. 2013. DEXUS: identifying differential expression in RNA-Seq studies with unknown conditions. Nucleic Acids Res 41: e198. [DOI] [PMC free article] [PubMed] [Google Scholar]
- Kriks S, Shim JW, Piao J, Ganat YM, Wakeman DR, Xie Z, Carrillo-Reid L, Auyeung G, Antonacci C, Buch A, et al. 2011. Dopamine neurons derived from human ES cells efficiently engraft in animal models of Parkinson's disease. Nature 480: 547–551. [DOI] [PMC free article] [PubMed] [Google Scholar]
- Lagos-Quintana M, Rauhut R, Yalcin A, Meyer J, Lendeckel W, Tuschl T. 2002. Identification of tissue-specific microRNAs from mouse. Curr Biol 12: 735–739. [DOI] [PubMed] [Google Scholar]
- Landgraf P, Rusu M, Sheridan R, Sewer A, Iovino N, Aravin A, Pfeffer S, Rice A, Kamphorst AO, Landthaler M, et al. 2007. A mammalian microRNA expression atlas based on small RNA library sequencing. Cell 129: 1401–1414. [DOI] [PMC free article] [PubMed] [Google Scholar]
- Langmead B, Trapnell C, Pop M, Salzberg SL. 2009. Ultrafast and memory-efficient alignment of short DNA sequences to the human genome. Genome Biol 10: R25. [DOI] [PMC free article] [PubMed] [Google Scholar]
- Leek JT, Storey JD. 2007. Capturing heterogeneity in gene expression studies by surrogate variable analysis. PLoS Genet 3: 1724–1735. [DOI] [PMC free article] [PubMed] [Google Scholar]
- Leucci E, Zriwil A, Gregersen LH, Jensen KT, Obad S, Bellan C, Leoncini L, Kauppinen S, Lund AH. 2012. Inhibition of miR-9 de-represses HuR and DICER1 and impairs Hodgkin lymphoma tumour outgrowth in vivo. Oncogene 31: 5081–5089. [DOI] [PubMed] [Google Scholar]
- Lin J, Zhang X, Zhao Z, Welker NC, Li Y, Liu Y, Bronner MP. 2016. Novel microRNA signature to differentiate ulcerative colitis from Crohn disease: a genome-wide study using next generation sequencing. MicroRNA 5: 222–229. [DOI] [PubMed] [Google Scholar]
- Liu CG, Calin GA, Meloon B, Gamliel N, Sevignani C, Ferracin M, Dumitru CD, Shimizu M, Zupo S, Dono M, et al. 2004. An oligonucleotide microchip for genome-wide microRNA profiling in human and mouse tissues. Proc Natl Acad Sci 101: 9740–9744. [DOI] [PMC free article] [PubMed] [Google Scholar]
- Londin E, Loher P, Telonis AG, Quann K, Clark P, Jing Y, Hatzimichael E, Kirino Y, Honda S, Lally M, et al. 2015. Analysis of 13 cell types reveals evidence for the expression of numerous novel primate- and tissue-specific microRNAs. Proc Natl Acad Sci 112: E1106–E1115. [DOI] [PMC free article] [PubMed] [Google Scholar]
- Lu J, Getz G, Miska EA, Alvarez-Saavedra E, Lamb J, Peck D, Sweet-Cordero A, Ebert BL, Mak RH, Ferrando AA, et al. 2005. MicroRNA expression profiles classify human cancers. Nature 435: 834–838. [DOI] [PubMed] [Google Scholar]
- Ludwig N, Leidinger P, Becker K, Backes C, Fehlmann T, Pallasch C, Rheinheimer S, Meder B, Stahler C, Meese E, et al. 2016. Distribution of miRNA expression across human tissues. Nucleic Acids Res 44: 3865–3877. [DOI] [PMC free article] [PubMed] [Google Scholar]
- McCall MN, Kent OA, Yu J, Fox-Talbot K, Zaiman AL, Halushka MK. 2011a. MicroRNA profiling of diverse endothelial cell types. BMC Med Genomics 4: 78. [DOI] [PMC free article] [PubMed] [Google Scholar]
- McCall MN, Uppal K, Jaffee HA, Zilliox MJ, Irizarry RA. 2011b. The Gene Expression Barcode: leveraging public data repositories to begin cataloging the human and murine transcriptomes. Nucleic Acids Res 39: D1011–D1015. [DOI] [PMC free article] [PubMed] [Google Scholar]
- McCall MN, Jaffee HA, Zelisko SJ, Sinha N, Hooiveld G, Irizarry RA, Zilliox MJ. 2014. The Gene Expression Barcode 3.0: improved data processing and mining tools. Nucleic Acids Res 42: D938–D943. [DOI] [PMC free article] [PubMed] [Google Scholar]
- McCall MN, Illei PB, Halushka MK. 2016. Complex sources of variation in tissue expression data: analysis of the GTEx lung transcriptome. Am J Hum Genet 99: 624–635. [DOI] [PMC free article] [PubMed] [Google Scholar]
- Mendell JT, Olson EN. 2012. MicroRNAs in stress signaling and human disease. Cell 148: 1172–1187. [DOI] [PMC free article] [PubMed] [Google Scholar]
- Mestdagh P, Hartmann N, Baeriswyl L, Andreasen D, Bernard N, Chen C, Cheo D, D'Andrade P, DeMayo M, Dennis L, et al. 2014. Evaluation of quantitative miRNA expression platforms in the microRNA quality control (miRQC) study. Nat Methods 11: 809–815. [DOI] [PubMed] [Google Scholar]
- Mitchell PS, Parkin RK, Kroh EM, Fritz BR, Wyman SK, Pogosova-Agadjanyan EL, Peterson A, Noteboom J, O'Briant KC, Allen A, et al. 2008. Circulating microRNAs as stable blood-based markers for cancer detection. Proc Natl Acad Sci 105: 10513–10518. [DOI] [PMC free article] [PubMed] [Google Scholar]
- Morin RD, O'Connor MD, Griffith M, Kuchenbauer F, Delaney A, Prabhu AL, Zhao Y, McDonald H, Zeng T, Hirst M, et al. 2008. Application of massively parallel sequencing to microRNA profiling and discovery in human embryonic stem cells. Genome Res 18: 610–621. [DOI] [PMC free article] [PubMed] [Google Scholar]
- Mullokandov G, Baccarini A, Ruzo A, Jayaprakash AD, Tung N, Israelow B, Evans MJ, Sachidanandam R, Brown BD. 2012. High-throughput assessment of microRNA activity and function using microRNA sensor and decoy libraries. Nat Methods 9: 840–846. [DOI] [PMC free article] [PubMed] [Google Scholar]
- Neilsen CT, Goodall GJ, Bracken CP. 2012. IsomiRs—the overlooked repertoire in the dynamic microRNAome. Trends Genet 28: 544–549. [DOI] [PubMed] [Google Scholar]
- Newman AM, Liu CL, Green MR, Gentles AJ, Feng W, Xu Y, Hoang CD, Diehn M, Alizadeh AA. 2015. Robust enumeration of cell subsets from tissue expression profiles. Nat Methods 12: 453–457. [DOI] [PMC free article] [PubMed] [Google Scholar]
- Pollard KS, Hubisz MJ, Rosenbloom KR, Siepel A. 2010. Detection of nonneutral substitution rates on mammalian phylogenies. Genome Res 20: 110–121. [DOI] [PMC free article] [PubMed] [Google Scholar]
- Risso D, Ngai J, Speed TP, Dudoit S. 2014. Normalization of RNA-seq data using factor analysis of control genes or samples. Nat Biotechnol 32: 896–902. [DOI] [PMC free article] [PubMed] [Google Scholar]
- Suzuki HI, Young RA, Sharp PA. 2017. Super-enhancer-mediated RNA processing revealed by integrative microRNA network analysis. Cell 168: 1000–1014.e15. [DOI] [PMC free article] [PubMed] [Google Scholar]
- Tan GC, Chan E, Molnar A, Sarkar R, Alexieva D, Isa IM, Robinson S, Zhang S, Ellis P, Langford CF, et al. 2014. 5′ isomiR variation is of functional and evolutionary importance. Nucleic Acids Res 42: 9424–9435. [DOI] [PMC free article] [PubMed] [Google Scholar]
- Tyner C, Barber GP, Casper J, Clawson H, Diekhans M, Eisenhart C, Fischer CM, Gibson D, Gonzalez JN, Guruvadoo L, et al. 2017. The UCSC Genome Browser database: 2017 update. Nucleic Acids Res 45: D626–D634. [DOI] [PMC free article] [PubMed] [Google Scholar]
- Valencia-Sanchez MA, Liu J, Hannon GJ, Parker R. 2006. Control of translation and mRNA degradation by miRNAs and siRNAs. Genes Dev 20: 515–524. [DOI] [PubMed] [Google Scholar]
- van der Maaten L, Hinton G. 2008. Visualizing data using t-SNE. Mach Learn Res 9: 2579–2605. [Google Scholar]
- Whyte WA, Orlando DA, Hnisz D, Abraham BJ, Lin CY, Kagey MH, Rahl PB, Lee TI, Young RA. 2013. Master transcription factors and mediator establish super-enhancers at key cell identity genes. Cell 153: 307–319. [DOI] [PMC free article] [PubMed] [Google Scholar]
- Witwer KW, Halushka MK. 2016. Toward the promise of microRNAs—Enhancing reproducibility and rigor in microRNA research. RNA Biol 13: 1103–1116. [DOI] [PMC free article] [PubMed] [Google Scholar]
- Xu JC, Fan J, Wang X, Eacker SM, Kam TI, Chen L, Yin X, Zhu J, Chi Z, Jiang H, et al. 2016. Cultured networks of excitatory projection neurons and inhibitory interneurons for studying human cortical neurotoxicity. Sci Transl Med 8: 333ra48. [DOI] [PMC free article] [PubMed] [Google Scholar]
Associated Data
This section collects any data citations, data availability statements, or supplementary materials included in this article.