


Abstract
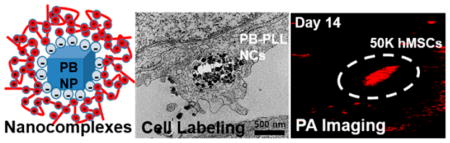
Acoustic imaging is affordable and accessible without ionizing radiation. Photoacoustic imaging increases the contrast of traditional ultrasound and can offer good spatial resolution when used at high frequencies with excellent temporal resolution. Prussian blue nanoparticles (PBNPs) are an emerging photoacoustic contrast agent with strong optical absorption in the near-infrared region. In this study, we developed a simple and efficient method to label human mesenchymal stem cells (hMSCs) with PBNPs and imaged them with photoacoustic imaging. First, PBNPs were synthesized by the reaction of FeCl3 with K4[Fe(CN)6] in the presence of citric acid and complexed with the cationic transfection agent poly-l-lysine (PLL). The PLL-coated PBNPs (PB-PLL nanocomplexes) have a maximum absorption peak at 715 nm and could efficiently label hMSCs. Cellular uptake of these nanocomplexes was studied using bright field, fluorescence, and transmission electron microscopy. The labeled stem cells were successfully differentiated into two downstream lineages of adipocytes and osteocytes, and they showed positive expression for surface markers of CD73, CD90, and CD105. No changes in viability or proliferation of the labeled cells were observed, and the secretome cytokine analysis indicated that the expression levels of 12 different proteins were not dysregulated by PBNP labeling. The optical properties of PBNPs were preserved postlabeling, suitable for the sensitive and quantitative detection of implanted cells. Labeled hMSCs exhibited strong photoacoustic contrast in vitro and in vivo when imaged at 730 nm, and the detection limit was 200 cells/µL in vivo. The photoacoustic signal increased as a function of cell concentration, indicating that the number of labeled cells can be quantified during and after cell transplantations. In hybrid ultrasound/photoacoustic imaging, this approach offers real-time and image-guided cellular injection even through an intact skull for brain intraparenchymal injections. Our labeling and imaging technique allowed the detection and monitoring of 5 × 10⁴ mesenchymal stem cells in living mice over a period of 14 days.
Keywords: cell tracking, molecular imaging, mesenchymal stem cell, Prussian blue nanoparticles, photoacoustic, contrast agent
Graphical abstract
Stem cell imaging is indispensable for monitoring and supporting regenerative medicine.1–3 Imaging can determine the location and quantity of cells, and realtime imaging can ensure that cells are properly delivered to the target tissues upon implantation. Furthermore, the long-term fate and distribution patterns of implanted cells including anoikis-induced apoptosis can be monitored after implantation via cell tracking.4,5 Magnetic resonance imaging (MRI) has long been the gold standard for stem cell tracking due to its excellent spatial resolution, soft tissue contrast, and low detection limits.6–9 However, MRI has a relatively poor temporal resolution of minutes, which prevents its widespread utility in imaging of cell implantation. While micro-computed tomography (CT) imaging has good temporal resolution, it also has limited sensitivity and poor soft tissue contrast, which hampers its broad use in stem cell tracking applications.10–12 Optical imaging also has good temporal resolution but is difficult to use clinically due to optical scatter that limits penetration depth.13
Photoacoustic imaging has recently been introduced to the field to overcome these limitations.14–17 It is based on the photoacoustic effect: the generation of ultrasound by the heat dissipations from pulsed light incident. It is noninvasive and quantitative and has fast scan times. Its spatial (50–150 µm) and temporal resolution (100 ms) are excellent. Photoacoustic imaging can also be coupled with B-mode ultrasound for anatomical information in real time during cell transplantation events.18–20
Exogenous contrast agents are often necessary to generate stem-cell-specific signal.21–24 Nanoscale near-infrared (NIR) absorbers have been used as contrast agents to discriminate stem cells from endogenous tissues.25,26 These exogenous contrast agents must first be loaded into the cell,27–29 and ex vivo labeling can be achieved by using viral/nonviral reagent-based transfection methods30,31 or an instrument-based electro-poration method.32–34 This is a critical step; one must attain a sufficient amount of contrast agent to achieve high signal to background, but without inducing toxicity or perturbing the cells’ pluripotency.
Examples of photoacoustic stem cell imaging include silicacoated gold nanorods (GNRs) for human mesenchymal stem cells (hMSCs)14 or gold nanocages to track stem cell homing to tumors.35 Single-walled carbon nanotubes (SWNTs)36 have also been demonstrated for multimodal (Raman/MRI/photoacoustic) in vivo tracking of cells. Here, the conjugation of protamine on the PEGylated SWNTs could significantly increase the uptake of nanotubes by hMSCs.37 However, these contrast agents may cause long-term toxicity depending on the formulation and surface chemistry,38,39 and this could hamper clinical translation. Gold nanoparticles can also deform under photoacoustic irradiation, leading to a blue-shift in the optical absorption and poor optical stability.40–42
Prussian blue nanoparticles (PBNPs) are an emerging photoacoustic contrast agent with strong optical absorption in the NIR region.43–46 PBNPs are an ideal stem cell imaging agent because they are small (<100 nm) and have excellent colloidal stability and biocompatibility47 with strong photoacoustic signal.43,48 The synthesis is very simple and highly reproducible.49,50 They show superior chemical- and photostability. Above all, PBNPs are suitable for their potential clinical applications because PB is already used in the clinic as a treatment for radiation exposure.51 Furthermore, PBNPs could easily be coated with poly-l-lysine (PLL) to reduce their negative charge and facilitate cell internalization. In this study, we developed a simple and efficient method to label hMSCs with PBNPs and then used them as a contrast agent for photoacoustic stem cell imaging. We demonstrate improved photoacoustic contrast and lower detection limits that will facilitate sensitive and long-term photoacoustic stem cell tracking in vivo.
RESULTS AND DISCUSSION
Synthesis and Characterization of Nanocomplexes
PBNPs were synthesized by simply mixing the aqueous solutions of FeCl3 and K4[Fe(CN)6] in the presence of citric acid. The product has a solid-state structure where two different iron species of Fe2+ and Fe3+ are linked by a CN− bridge.52 Citric acid was used not only to mediate the nucleation between FeCl3 and K4[Fe(CN)6] but also to prevent agglomeration as a surface capping agent. The synthesis is very reproducible and scalable (up to 0.2 g).
Transmission electron microscopy (TEM) images (Figure 1A and Figure S1A) show that the as-synthesized PBNPs are uniform and cubic shaped with an average size of 50–60 nm. The size of the PBNPs can be easily controlled by the amounts of citric acid (Figure S1); however, we used the 50–60 nm nanoparticles because they were more monodisperse (Figure S1). The X-ray diffraction (XRD) data (Figure 1B) showed that the particles have typical diffraction peaks with indices of (200), (220), (400), (420), (422), (440), (600), (620), (640), and (642), which correspond to the face-centered cubic PB lattice (space group Fm3m).52 The presence of elemental iron in the PBNPs was confirmed by energy-dispersive X-ray (EDX) spectroscopy (Figure S2). The mean hydrodynamic diameter (by dynamic light scattering, DLS) of the PBNPs in DI water was 83.36 nm with a polydispersity index (PDI) of 0.11 (black trace line in Figure 1D).
Figure 1. Physical and spectral characterization of the nanoparticles.

(A) TEM images of PBNPs. Scale bar is 100 nm. (B) X-ray diffraction patterns of PBNPs with characteristic peaks assigned to the (200), (220), (400), (420), (422), (440), (600), (620), (640), and (642) planes of face-centered-cubic lattice Prussian blue (JCPDS 73-0687). (C) Schematic representation of PB-PLL nanocomplexes. Negatively charged, citrate-stabilized PBNPs are electrostatically complexed with positively charged PLL. (D) Dynamic light scattering measurements of PBNPs and PB-PLL nanocomplexes. Hydrodynamic diameters of PBNPs (black trace line) and PB-PLL nanocomplexes (red trace line) were 83.36 nm (PDI: 0.11) and 133.8 nm (PDI: 0.14), respectively. Data are presented as relative intensity measurements. (E) UV/visible absorbance measurements of PBNPs (black trace line) and PB-PLL nanocomplexes (red trace line). (F) Plot of the photoacoustic amplitude with increasing concentrations of the solution of PB-PLL nanocomplexs (0, 31.3, 62.5, 125, 250, 500, 1000 µg/mL). The inset shows the corresponding photoacoustic images for the plot. Error bars represent the standard deviation.
The PBNPs capped with citric acid had a highly negative zeta potential of −39.9 ± 7.07 mV, which leads to a very limited cellular uptake due to the repulsion of the particles by the negatively charged cell membranes.53 Therefore, for efficient cell labeling, we complexed these PBNPs with the cationic transfection agent poly-l-lysine (Figure 1C). This macro-molecule has been successfully applied to stem cell labeling with iron oxide nanoparticles for MRI54,55 or gold nanoparticle for micro-CT imaging.56 We chose PBNPs (size of 50–60 nm) and PLL (MW = 30 000–70 000) for the complete PLL coverage of the particle surface55,56 (Figure S3). Homogeneous PLL-coated PBNPs (PB-PLL nanocomplexes) were formed, and the adsorbed amount of PLL was 270 µg of PLL per mg of PBNPs, and their average hydrodynamic diameter was 133.8 nm (PDI: 0.14) with a zeta potential of +33.9 ± 5.87 mV (red trace line in Figure 1D). After PLL complexation, the surface charges of the PBNPs became very positive. The mean diameter and PDI of PBNPs increased upon PLL coating, and the DLS measurement displayed a symmetrical distribution without aggregation (Figure 1D). The PB-PLL nanocomplexes have excellent colloidal stability in aqueous media and maintain hydrodynamic diameters of 130–150 nm for over one month.
The UV-vis absorption spectrum of PBNPs shows a broad and intense absorption at 650–900 nm and a maximal peak of absorbance at 715 nm (Figure 1E). The strong NIR light absorption can be attributed to the intermetallic charge-transfer band from Fe2+ to Fe3+ in PBNPs.57,58 This band was not affected by PLL complexation. When the photoacoustic signal was measured as a function of wavelength (680–950 nm), both PBNPs and PB-PLL nanocomplexes (1 mg/mL) show the highest photoacoustic signal at 730 nm (Figure S4B). These nanocomplexes were diluted from 1 mg/mL to 10 µg/mL and imaged with pulsed laser excitation at 730 nm. They showed strong photoacoustic contrast, and the intensity increased linearly with particle concentration (R2 = 0.98) (Figure 1F). Furthermore, there was no decrease in photoacoustic signal of intensity in the nanocomplexes after repetitive exposure to laser pulses (6.5 × 10³ pulse). In contrast, GNRs (15 × 50 nm, TEM images in Figure S4A) showed a 38% decrease in photoacoustic signal (Figure S4C).
Intracellular Labeling of Nanocomplexes
Next, we investigated the cellular uptake of the PB-PLL nanocomplexes with bright field, fluorescence, and transmission electron microscopy. The hMSCs were labeled by incubation with PB-PLL nanocomplexes (50 µg/mL) for 6 h (see below for labeling concentration optimization), thoroughly washed to remove unbound free particles, and imaged. The hMSCs were efficiently labeled when PLL was complexed to the particles as seen by the blue color in the images (Figure 2A). The PBNPs were successfully located on both the periphery and interior of the labeled cells similar to Prussian blue stained, iron-labeled stem cells.30,54 In contrast, there was hardly any uptake of PBNPs without PLL (Figure 2B). We also used FITC-conjugated PB-PLL nanocomplexes,56,59 and the green signal in the fluorescence microscopy images (Figure 2C) corresponds to FITC-conjugated PB-PLL nanocomplexes. Despite the lowered surface charges of FITC-conjugated complexes (+8.63 ± 3.83 mV), particles were still successfully internalized, and the signal was highest on the perinuclear regions.
Figure 2. Microcopy analysis to confirm cell labeling.

(A) Bright field microscopy images of hMSCs incubated with PB-PLL nanocomplexes. Scale bar is 100 µm. (B) Bright field microscopy images of hMSCs incubated with naked, citrate-stabilized PBNPs. Scale bar is 100 µm. (C) Fluorescence microscopy images of labeled hMSCs (green: PB-PLL (FITC) nanocomplexes; blue: DAPI-stained nuclei). Scale bar is 50 µm. (D) TEM images of labeled hMSCs. The intracellularly labeled PB-PLL nanocomplexes are indicated by blue arrows in the images. Neu indicates nucleus. Scale bar is 500 nm.
When the labeled cells were imaged by TEM (Figure 2D), PBNPs with a diameter range of 50–60 nm are obvious as electron-dense, dark solid cubes in the labeled cells confined to the endosome. This further confirms that the intracellular uptake of PBNPs is assisted by the cationic PLL. To confirm that the mechanism of uptake was energy-dependent endocytosis, we also conducted controlled experiments at reduced temperature or with an endocytosis inhibitor and found reduced internalization of the nanoparticles (Figure S5).60–62 We also evaluated the materials with mouse mesenchymal stem cells (mMSCs) and again saw this characteristic perinuclear, endosomal distribution of PBNPs (Figure S6). Finally, we used inductively coupled plasma optical emission spectroscopy (ICP-OES) to measure iron levels in the cells and confirm labeling. The iron levels were 88-fold higher in cells labeled with PBNP-PLL (53 pg/cell) than citrate-capped PBNPs (0.6 pg/cell), and the number of labeled particles was calculated to be 40 800 PB-PLL per cell. Knowing that we started with 1.8 mL of 50 µg/mL (90 µg of PBNPs added), the 100 000 cells with 53 pg/cell result in an overall labeling efficiency of 6%.
Cytotoxicity and Functional Characterization of Labeled hMSCs
We next evaluated the viability/proliferation and cytokine expression with a metabolic 3-(4,5-dimethylthiazol-2-yl)-5-(3-carboxymethoxyphenyl)-2-(4-sulfophenyl)-2H-tetrazolium salt (MTS) assay and cytokine assay, respectively. The MTS assay showed no cytotoxic effects of the nanocomplexes even when using 4-fold higher concentrations than required for labeling (up to 200 µg/mL). No significant differences in viability were seen between unlabeled and labeled cells (p > 0.05, two-tailed t test) (Figure 3A). Furthermore, there was no difference in the growth rate between unlabeled and labeled cells with our labeling protocol (incubation with PB-PLL nanocomplexes (50 µg/mL) for 6 h). The doubling time for both cells was 4 days (Figure 3B).
Figure 3. Assessment of cell viability after labeling.

(A) An MTS assay showed no decrease in metabolic activity upon labeling. The hMSCs were incubated overnight with increasing PB-PLL concentrations (0, 6.3, 12.5, 25, 50, 100, and 200 µg/mL) (“pos” indicates cytotoxic positive control; 20 mM CTAB; **, p < 0.01). (B) Growth rate of unlabeled and labeled hMSCs over time. hMSCs were prelabeled by incubation with PB-PLL nanocomplexes (50 µg/mL) for 6 h. (C) Secretome analysis of labeled hMSCs. Cytokine expression levels in cell culture media from labeled hMSCs were analyzed for 12 different proteins, and their concentrations are shown as the fold changes versus unlabeled hMSCs (BDNF: brain-derived neurotrophic factor, TIMP-1: tissue inhibitor of metalloproteinases 1, B2M: beta-2-microglobulin, RANTES: T-cell-specific protein, MMP-3: matrix metalloproteinase-3, MCP-1: monocyte chemotactic protein 1, VEGF: vascular endothelial growth factor, VCAM-1: vascular cell adhesion molecule-1, A2Macro: alpha-2-macroglobulin, IL-4: interleukin-4, IL-6: interleukin-6, IL-8: interleukin-8).
PLL is known to induce some cytotoxicy.29,63 Thus, we wanted to study the toxicity of the PBNP-PLL product independent of PLL. We observed some reduced viability at high concentrations of PLL only (no PBNP) (>400 µg/mL) (Figure S7). However, these concentrations are much higher than the concentrations on our nanoparticles, and there is almost no free PLL in our product because the PBNP and PLL formed a tight complex.
We also evaluated cytokine secretion from labeled hMSCs because this can explain nanoparticle immunotoxicity.64 Secretome analysis of 12 proteins including inflammatory cytokines of IL-6, IL-8, and MCP-165 indicated that cytokine concentrations from the labeled cells were within 1-fold (50–200%) of unlabeled cells (Figure 3C). We next used CD73, CD90, and CD105 as MSC marker proteins with flow cytometry (FACS).66,67 FACS analysis showed that the labeled hMSCs still express these three stem cell surface markers regardless of labeling (Figure S8). Furthermore, a cell migration assay demonstrated that PB labeling did not affect the migration capacity of hMSCs (Figure S9).
Next, the pluripotency of labeled and unlabeled hMSCs was investigated. Multipotent stem cells can migrate to the injured site to replace damaged tissues,68 and it is important that the contrast agent does not interfere with the cells’ differentiation capacity. Figure 4 shows that labeled hMSCs can be successfully differentiated into adipocytes and osteocytes (Figure 4B,C) similar to unlabeled hMSCs (Figure 4E,F). Fatty lipid deposits were stained red by Oil-Red-O staining on adipogenic differentiations (Figure 4B,E), and black calcium deposits were detected by von-Kossa staining on osteogenic differentiations (Figure 4C,F). There was no difference in the degree of differentiation between these two groups, and unintentional differentiation did not occur due to the presence of the PBNPs (Figure 4A). Interestingly, the efficient PLL-based labeling enabled particle retention for over 3 weeks, as indicated by the bluish color on unstained images (arrows in Figure 4A). Some PBNPs were also colocalized with oil droplets during the adipogenic differentiations (arrows in Figure 4B). These results suggest that this efficient labeling approach technique offers long-term retention of the contrast agent even after several cell division cycles.
Figure 4. Stability of labeling and impact on pluripotency.

Differentiation (A–C) of labeled hMSCs and (D–F) unlabeled hMSCs. Images were obtained 3 weeks after particle labeling. Oil-Red-O staining for adipocytes (B, E) and von-Kossa staining for osteocytes (C, F). As shown in arrows in A and B, PB-PLL nanocomplexes were retained in the labeled cells even after 3 weeks of incubation. Scale bar is 100 µm.
In Vitro Imaging of Labeled hMSCs
To further validate this labeling strategy, we incubated different amounts of nanocomplexes (0, 25, 50, and 100 µg/mL) with fixed cell numbers (100 × 103 cells) and collected photoacoustic data on the cells. Figure 5A shows that photoacoustic signal increased as a function of NP concentration (Figure 5B). To confirm that the increase in photoacoustic signal was due to the nanoparticles, we independently measured the iron concentration with ICP-OES and noted a linear correlation between the intracellular iron concentration and the photoacoustic signal (R2 = 0.98; Figure 5A,C). However, in an additional experiment with fewer hMSCs (40 × 103 cells, only 40% confluent in six-well plate) incubated with the same amount of nanocomplexes (0, 12.5, 25, 50, and 100 µg/mL), the increase in photoacoustic signal with higher labeling concentrations began to plateau above 50 µg/mL; therefore, we used 50 µg/mL for all subsequent experiments (Figure S10). Next, we imaged different numbers of cells labeled with the same NP concentration (50 µg/mL) (5 × 10³ to 200 × 103 cells). Figure S11 shows that the labeled hMSCs exhibited linear behavior from 10 × 103 to 200 × 103 cells (R2 = 0.96). The detection limit was 100 cells/µL in vitro.
Figure 5. Labeling conditions and validation.

(A) Photoacoustic images of a 1% agarose suspension of 100 × 103 hMSCs labeled with different concentrations of PB-PLL nanocomplexes (0, 25, 50, and 100 µg/mL) for 6 h. (B) Photoacoustic intensity shows a linear dependence with different concentrations of PB-PLL nanocomplexes used for the labeling. (C) Signal vs quantification of intracellular Fe concentration as determined by ICP-OES relative to photoacoustic signal.
We also monitored the temporal stability of labeling via photoacoustic imaging and showed that the nanocomplexes were retained and produced contrast for at least 2 weeks (Figure 4A and Figure S12). The optical properties of PBNPs were preserved postlabeling, and the same broad shoulder of photoacoustic spectra was seen (Figure S12C) as in the freshly prepared PBNPs (Figure 1E and Figure S4). The results confirm the superiority of this contrast agent for quantitative imaging regardless of their conformational packing states after cell labeling. This is in contrast to GNRs, which can have weaker signal due to plasmonic coupling when entrapped in subcellular vesicles or poor signal stability (Figure S4), which are not appropriate for sensitive and quantitative detections of injected cells.14,15
In Vivo Imaging of Labeled hMSCs
To confirm in vivo utility, 0.4 million unlabeled or labeled hMSCs in 50% Matrigel/phosphate-buffered saline (PBS) (60 µL) were injected subcutaneously into nude mice (n = 3) and imaged. The photoacoustic signal from labeled hMSCs (white dashed circle, bottom image of Figure 6A) was 200-fold higher (p < 0.01) than that for an equivalent number of unlabeled cells (white dashed circle, top image of Figure 6A). In mice with unlabeled cells, no photoacoustic signals could be detected. To demonstrate the potential of quantitative cell tracking of PB-labeled hMSCs in vivo, different numbers of labeled hMSCs (100 × 103, 50 × 103, 25 × 103, and 13 × 103) were injected subcutaneously and imaged. Figure 6B shows the linear correlation between photoacoustic intensity and number of implanted hMSCs. These quantitative plots cover a wide range of cell numbers from 10 × 103 to 100 × 103 cells, and the detection limit was 200 cells/µL in vivo. This value is significantly lower than that previously reported for silicacoated GNRs14 (1300 cells/µL) or gold nanocages,35 which highlights the sensitivity of the PB-PLL contrast agents.
Figure 6. In vivo imaging.

(A) B-mode ultrasound (gray scale) and photoacoustic (red) images of subcutaneously injected unlabeled hMSCs (top) and labeled hMSCs (bottom) into nude mice. Here, 400 × 103 cells in 50% Matrigel/PBS (60 µL) were injected subcutaneously and imaged. Scale bar is 3 mm. (B) Linear plot of photoacoustic signal intensity versus number of labeled hMSCs (13, 25, 50, and 100 × 103 cells) in vivo. The inset shows the corresponding photoacoustic images for the plot. Error bars represent the standard deviation. (C) Longitudinal photoacoustic imaging of transplanted cells in vivo. 50 × 103 labeled cells were injected subcutaneously and imaged serially at day 1, 3, 5, 7, 10, and 14. The strong photoacoustic contrast was still visible 14 days after injection. Scale bar is 3 mm. (D) Spectral analysis from the 50 × 103 injected cells and the background host tissues at day 14. The photoacoustic spectral properties of injected cells were preserved and remain discernible from the surrounding tissues.
To investigate the feasibility of PB-PLL nancomplexes for long-term in vivo cell tracking, implanted and labeled hMSCs were serially monitored with photoacoustic imaging for 2 weeks. Due to the dilution of contrast during the cell divisions, the photoacoustic signal with 13 × 103 labeled hMSCs disappeared 7 days after injection (Figure S13). However, with higher numbers of cells (50 × 103), there was sustained photoacoustic contrast for 2 weeks (Figure 6C). The spectral properties and photoacoustic sensitivity was also preserved for 14 days after injection (Figure 6D) similar to colloidal PBNPs (Figure S4B) or in vitro cell phantoms (Figure S12C). This indicates that the cells have a sufficient amount particles for sensitive and longitudinal detection and monitoring of implanted cells in vivo. This longitudinal tracking can evaluate the long-term safety and efficacy of cell therapy.69
A substantial challenge for stem cell imaging is real-time imaging of cellular injection with anatomical features. Photoacoustic imaging can provide real-time, image-guided stem cell information in addition to anatomical information from B-mode ultrasound imaging. To show this and understand the impact of depth on our photoacoustic signal, we performed brain intraparenchymal injections, a common route for intracerebral cell delivery.70 In particular, clinical trials of therapeutic stem cell transplantation have now been performed in stroke patients,71,72 and it is critically important to establish a safe and efficient stem cell delivery to the sites of ischemic brain damages.
Figure 7 shows photoacoustic and B-mode ultrasound images of a mouse brain before, during, and after injection of 50 × 103 unlabeled (Figure 7A,C,E) or labeled stem cells (Figure 7B,D,F). A video of real-time injection of PB-labeled hMSCs is presented in the Supporting Information, Supplementary Movie SM 1. Figure 7 clearly shows the anatomical structures of the mouse brain including the skull and ear via B-mode images and confirms that we can do photoacoustic imaging of PBNP-labeled stem cells through an intact skull.73 This could be used to see the ischemic site and can guide injection.74,75
Figure 7. Deep tissue imaging.

B-mode ultrasound (gray scale) and photoacoustic (red) images of 50 × 103 unlabeled (A, C, E) and labeled hMSCs (B, D, F) injected into a murine brain. Images were taken preinjection (A, B), after needle insertion (C, D), and postinjection of the cells (E, F). The significant photoacoustic signal increase (980%) pre- and postinjection of the labeled cells at the injection site (white dashed circle) is shown in F relative to B. In contrast, no photoacoustic signals were detected postinjection of unlabeled cells (white dashed circle) in E. Scale bar is 3 mm. Real-time injection imaging of labeled hMSCs (50 × 103) is shown in the Supporting Information, Supplementary Movie SM 1.
Photoacoustic imaging can then precisely monitor the cells. The photoacoustic contrast was obvious from the needle (Figure 7C,D) and the labeled cells (Figure 7F). The white dashed circle is the injection site of labeled stem cells with 50 × 103 labeled hMSCs; there was a 980% increase in the photoacoustic signal (p < 0.01) pre- and postinjection (in Figure 7F relative to Figure 7B). While there was some B-mode ultrasound signal from both labeled and unlabeled cells, this signal could be influenced by air bubbles or other changes to the tissue resulting in nonspecific signal. Only the PBNP-labeled cells showed strong photoacoustic signal, which unambiguously confirmed the presence of the cells. No photoacoustic signal was detected from unlabeled cells (Figure 7E). We also performed a 3D reconstruction of photoacoustic images pre- and postinjection to the mouse brain (Figure S14). The labeled hMSCs are obvious (dashed yellow circle in Figure S14B). This technique allows a better understanding of the accuracy of injection and the fate of transplanted cells with 3D anatomical visualizations.
CONCLUSIONS
This study describes a sensitive photoacoustic contrast agent for imaging stem cells. We successfully prepared PB-PLL nanocomplexes as a biocompatible and efficient photoacoustic contrast agent that can be used for labeling and tracking of hMSCs. The preparation of nanocomplexes is very simple, and they are efficient for quantitative cell labeling. The PBNP labeling did not affect cell viability and stem cell differentiations. Labeled hMSCs exhibited strong photoacoustic contrast upon implantation, resulting in a linear behavior with the detection limit of 200 cells/µL in vivo. The sensitive and durable photoacoustic contrast from the labeled particles allowed the noninvasive, long-term visualization of the engrafted hMSCs in living animals with monitoring and detection limits of 50 × 103 cells for 14 days. We believe this strategy can contribute to the stem cell therapy field as an efficient tool for real-time and sensitive stem cell imaging.
MATERIALS AND METHODS
Materials
Iron(III) chloride hexahydrate (FeCl3·6H2O, Catal. #44944), potassium hexacyanoferrate(II) trihydrate (K4[Fe(CN)6]· 3H2O, Catal. #P9387), citric acid (Catal. #251275), poly-l-lysine hydrobromide (MW = 30 000–70 000, Catal. #P2636), fluorescein isothiocyanate (FITC, Catal. #F7250), cetyltrimethylammonium bromide (CTAB, 95%, Catal. #6269), sodium borohydride (Catal. #71320), gold(III) chloride hydrate (Catal. #50790), silver nitrate (≥99.0%, Catal. #209139), L-ascorbic acid (Catal. #A7506), and dynasore hydrate (Catal. #D7693) were purchased from Sigma-Aldrich Chemicals (Atlanta, GA, USA). PBS, fetal bovine serum (FBS), and agarose (Catal. #16500) were purchased from Invitrogen (Carlsbad, CA, USA). Trypsin/ethylenediamine tetra-acetic acid (EDTA), stem cell growth media (PT-3001), adipogenic induction/ maintenance media, and osteogenic induction medium were purchased from Lonza (Walkersville, MD, USA). The MTS was purchased from Promega (Madison, WI, USA). All chemicals were of analytical grade and used without further purification. All aqueous solutions were prepared with deionized (18 MΩ) water.
Preparation of PB-PLL(FITC) Nancomplexes
PBNPs were synthesized by the reaction of an aqueous FeCl3 solution (20 mL, 1 mM) with an aqueous K4[Fe(CN)6] solution (20 mL, 1 mM) in the presence of citric acid (100 mg) under vigorous stirring at 60 °C. Transparent blue nanoparticle dispersions were immediately formed with a resulting pH of 2.5–3.0. After 5 min, the reaction mixture solutions were cooled to room temperature. After washing with an equal volume of acetone two times by centrifugation (12 000 rpm, 20 min), the pellets of PB nanoparticles were redispersed in distilled water by sonication. Next, we coated the nanoparticles with PLL to form the PB-PLL nanocomplexes. One mL of PLL solution (1 mg/ mL) was added to the as-prepared PBNPs (2 mg/mL) in a 50 mL conical tube and stirred overnight. The next day, these were washed with distilled water three times by centrifugation (12 000 rpm, 20 min), the pellets were finally dispersed in 2 mL of distilled water. For FITC conjugation to enable fluorescence imaging, FITC (0.5 mg/mL) in DMSO was added to nanoparticle suspensions in the tubes. This was stirred for an additional 3 h (protected from light), washed three times with distilled water by centrifugation (12 000 rpm, 20 min) to remove unreacted FITC, and redispersed into 2 mL of distilled water.
Preparation of Gold Nanorods
GNRs were synthesized following the seed-mediated growth method. 14,41 First, the gold seed solution was prepared by the addition of 0.6 mL of ice-cold 0.01 M NaBH4 to an aqueous solution of 5 mL of 0.2 M CTAB and 5 mL of 0.005 M gold chloride. Next, the growth solution was prepared with 250 mL of 0.2 M CTAB, 250 mL of 0.001 M AuCl3, 12 mL of 4 mM AgNO3, and 3.5 mL of 0.089 M ascorbic acid. Next, 0.6 mL of seed solution was added to the growth solution, and the solution became purple to brownish over 20–60 min. This mixture reacted for 6 h and was then washed three times with distilled water by centrifugation (12 000 rpm, 20 min) to remove extra CTAB.
Characterization of PB-PLL Nanocomplexes
TEM imaging used a FEI Tecnai Spirit G2 BioTWIN microscope operating at an accelerating voltage of 80 kV. TEM specimens were prepared by placing a small amount of nanoparticle suspension in 2-propanol onto carbon-coated Cu grids with air drying. Powder XRD patterns were collected on a Bruker D8 Advance diffractometer operating at 40 kV and 40 mA using Cu Kα radiation (λ = 1.5418 Å) with a scan speed of 0.1 s, a step size of 0.04° in 2θ, and a 2θ range of 10–75°. The EDX spectral data were acquired with a Philips XL30 ESEM instrument operating at 20 keV. ICP-OES (PerkinElmer Optima 3000DV) was used to quantify the Fe. DLS (Zetasizer ZS 90, Malvern Instruments) was used to determine the hydrodynamic size and zeta potentials of nanoparticles (PBNPs or PB-PLL nanocomplexes). The UV-vis spectra were measured with a microplate reader (SpectraMax; Molecular Devices).
Cell Culture, Labeling, and Proliferation Assays
The hMSCs (Lonza, PT-2501) were seeded at 5000 cells/cm2 in growth media (Dulbecco’s modified Eagle’s medium (DMEM) supplemented with 10% FBS, 1% Glutamax, and 1% penicillin-streptomycin, Lonza, PT-3001) and grown to 80–85% confluency in a T75 flask. These cells were labeled with PB-PLL nanocomplexes in fresh culture media (50 µg/mL) for 6 h. After washing with sterile PBS three times to ensure all free particles were removed, cells were trypsinized using 0.25% trypsin/EDTA. Detached cells were collected by centrifugation at 300g for 5 min, resuspended, and counted by hemocytometer. For all experiments, cells from passages 4–8 were used.
Microscopy
Cellular uptake of the nanocomplexes was studied using bright field, fluorescence, and transmission electron microscopy. Labeled hMSCs were cultured in six-well plates (Falcon #303046, nonpyrogenic). Cells were washed with PBS, fixed with 4% paraformaldehyde (PFA), and imaged with a fluorescence microscope (Keyence BZ-9000, Germany). Hoechst 33342 (NucBlue Live ReadyProbes Reagent, Thermo Fisher Scientific) was used for nuclear staining. TEM images of labeled cells were acquired using a Tecnai TEM. Labeled hMSCs cultured in six-well plates were fixed with 4% PFA, postfixed with 1% osmium tetroxide, dehydrated with ethanol/ propylene oxide, and finally embedded in epoxy resin for 3 days. Sections were cut using a Leica UCT ultramicrotome (Buffalo Grove, IL, USA). After counterstaining with uranyl acetate (1% in DI) and lead citrate, ultrathin sections were mounted on copper grids and observed under a microscope.
Toxicity Assays and Cell Migration Assays
The viability of labeled hMSCs was measured using the CellTiter 96 AQueous One Solution cell proliferation assay (MTS, Promega) performed in triplicate. The hMSCs (5 × 10³ cells per each well) were seeded into a 96-well cell culture plate and grown overnight. Various concentrations of PB-PLL complexes (0, 6.25 12.5, 25, 50, 100, and 200 µg/mL) were added and incubated overnight. Cells were then washed with PBS followed by treatment with 100 µL of culture media and 20 µL of assay reagent in each well. The samples were incubated for 2 h, and the absorbance at 490 nm was then recorded using a microplate reader (Victor3, PerkinElmer, Waltham, MA, USA). For secretome analysis, labeled and unlabeled cells were cultured in a six-well plate for 2 days. Culture media from labeled and unlabeled cells was then allowed to stand for 24 h and studied with a bead-based assay (Luminex) by a commercial operator (Rules-Based Medicine). For FACS analysis, labeled and unlabeled hMSCs (400 × 103 cells, respectively) were resuspended in PBS and incubated with 1 µL of monoclonal antibody specific for mesenchymal stem cells (CD73-PE/CD90-FITC/CD105-APC) and run for the flow cytometry analysis by FACSCalibur (BD Biosciences, San Jose, CA, USA) with FlowJo software (Becton Dickinson and Company). Migration assays were performed in six-well plates (70–80% confluent hMSCs). After labeling with PB-PLL nanocomplexes (50 µg/mL) for 6 h, a portion of the cells was scraped with a pipet tip. That area was monitored repeatedly with a Leica light microscope.
In Vitro Cell Differentiation
Labeled (50 µg/mL) and unlabeled (control) hMSCs were induced to differentiate into two downstream cell lineages of adipocytes or osteocytes. After cells reached confluence in a six-well plate, cells were cultured in adipogenic induction medium (10% FBS/DMEM containing 1 µM dexamethasone, 0.5 mM isobutylmethylxanthine, 10 µM insulin, Lonza) or in osteogenic induction medium (10% FBS/DMEM containing 10 nM dexamethasone, 50 µM ascorbic acid, 10 mM β-glicerophosphate, Lonza). After 3 weeks of incubation with a medium change every 2–3 days, the cells were washed with PBS, fixed with 4% PFA, and stained with Oil-red-O (Sigma-Aldrich, St. Louis, MO, USA) for adipocytes or a von Kossa staining kit for osteocytes (Fisher Sci., Waltham, MA, USA). The induced labeled vacuoles and calcium deposits were imaged with bright field microscopy (Keyence BZ-9000, Germany).
Measurement of Intracellular Iron Content
After imaging, the labeled cell suspensions were assayed to quantify iron contents using ICP-OES analysis (PerkinElmer Optima 3000DV). Labeled cells were transferred to 10% aqua regia in water and sonicated in a bath sonicator to dissolve PBNPs. A standard curve was obtained using an iron standard (Catal. #43149, Sigma-Aldrich), and the intracellular nanoparticle concentration was calculated using the total iron amount divided by the number of cells.
Photoacoustic Imaging of Labeled Cells in Vitro
All in vitro imaging was performed in 1% agarose phantoms. Agarose was added to distilled water at 1% and heated at 60 °C until use. The agarose solution was then mixed with labeled cell solutions at a one-to-one ratio. For the first set of experiments, 100 × 103 cells were incubated with different concentrations of particles (0, 25, 50, and 100 µg/mL), and the labeled cells were suspended in 50 µL of PBS and 50 µL of 1% agarose. A blank control was made with 0.5% agarose solution. Photoacoustic imaging was performed using a Visualsonics LAZR photoacoustic scanner (Vevo LAZR) with transducers (LZ 400) having a center frequency of 30 MHz and pulsed laser excitation at 730 nm. Next, different numbers of labeled cells (200 × 103, 100 × 103, 50 × 103, 25 × 103, 12.5 × 10³, and 6.3 × 10³) were suspended in 50 µL of PBS, and 50 µL of 1% agarose was added and thoroughly vortexed. The final cell concentrations were 2000, 1000, 500, 250, 125, and 63 cells/µL in 0.5% agarose, respectively. A blank control was made with 0.5% agarose solution.
Photoacoustic Imaging of Labeled Cells in Vivo
All animal studies were performed in accordance with the Institutional Animal Care and Use Committee (IACUC) at the University of California, San Diego (UCSD). Male nude mice (20 g) (n = 3) were anesthetized with 1–2% isoflurane and positioned underneath the transducer with coupling media. Then, 0.4 million of unlabeled or labeled hMSCs in 50% matrigel/PBS (60 µL) were injected subcutaneously with a 28.5 gauge catheter and imaged using the same Visualsonics LAZR photoacoustic scanner. Different numbers of labeled hMSCs (100 × 103, 50 × 103, 25 × 103, and 12.5 × 10³) suspended in 50% matrigel/ PBS (60 µL) were injected subcutaneously and imaged. For brain intraparenchymal injections, 50 × 103 of unlabeled or labeled cells were suspended in 20 µL of PBS and then injected. Images were obtained via 3-D mode with a 30 MHz transducer and pulsed laser excitation at 730 nm.
Data Quantification and Statistical Analysis
The photo-acoustic imaging data were analyzed using ImageJ. First, raw data images from the photoacoustic scanner were converted to 8-bit images. Second, a region of interest (ROI) was drawn over the area containing the transplanted cells or background via an ROI manager. The mean gray values of the same size of ROI were measured from at least three different fields of views (FOVs) per sample. Finally, photoacoustic intensities at each samples were calculated as mean and standard deviation for each FOV.
Mean values, standard deviations, and p-values were calculated in Mcrosoft Excel 2016. All error bars represent the standard deviations. A two-tailed Student’s t test was used to determine statistical significance, and p-values of <0.05 were considered to be significant. The detection limit was calculated as three standard deviations above the mean of the blank signals.
Supplementary Material
Acknowledgments
T.K. would like to thank P. Castillo for ICP-OES analysis. J.V.J. acknowledges funding from the NIH R00 HL117048 and DP2 HL137187 and infrastructure from S10 OD021821. This work was performed in part at the San Diego Nanotechnology Infrastructure (SDNI) of UCSD, a member of the National Nanotechnology Coordinated Infrastructure, which is supported by the National Science Foundation (Grant ECCS-1542148).
Footnotes
ASSOCIATED CONTENT
The authors declare no competing financial interest.
References
- 1.Naumova AV, Modo M, Moore A, Murry CE, Frank J. A Clinical Imaging in Regenerative Medicine. Nat. Biotechnol. 2014;32:804–818. doi: 10.1038/nbt.2993. [DOI] [PMC free article] [PubMed] [Google Scholar]
- 2.Gu E, Chen WY, Gu J, Burridge P, Wu JC. Molecular Imaging of Stem Cells: Tracking Survival, Biodistribution, Tumorigenicity, and Immunogenicity. Theranostics. 2012;2:335–345. doi: 10.7150/thno.3666. [DOI] [PMC free article] [PubMed] [Google Scholar]
- 3.Wang JX, Jokerst JV. Stem Cell Imaging: Tools to Improve Cell Delivery and Viability. Stem Cells Int. 2016;2016:9240625. doi: 10.1155/2016/9240652. [DOI] [PMC free article] [PubMed] [Google Scholar]
- 4.Kircher MF, Gambhir SS, Grimm J. Noninvasive Cell-Tracking Methods. Nat. Rev. Clin. Oncol. 2011;8:677–688. doi: 10.1038/nrclinonc.2011.141. [DOI] [PubMed] [Google Scholar]
- 5.Nguyen PK, Riegler J, Wu JC. Stem Cell Imaging: From Bench to Bedside. Cell Stem Cell. 2014;14:431–444. doi: 10.1016/j.stem.2014.03.009. [DOI] [PMC free article] [PubMed] [Google Scholar]
- 6.Bulte JWM, Zhang SC, van Gelderen P, Herynek V, Jordan EK, Duncan ID, Frank JA. Neurotransplantation of Magnetically Labeled Oligodendrocyte Progenitors: Magnetic Resonance Tracking of Cell Migration and Myelination. Proc. Natl. Acad. Sci. U. S. A. 1999;96:15256–15261. doi: 10.1073/pnas.96.26.15256. [DOI] [PMC free article] [PubMed] [Google Scholar]
- 7.Bulte JWM, Douglas T, Witwer B, Zhang SC, Strable E, Lewis BK, Zywicke H, Miller B, van Gelderen P, Moskowitz BM, Duncan ID, Frank JA. Magnetodendrimers Allow Endosomal Magnetic Labeling and In Vivo Tracking of Stem Cells. Nat. Biotechnol. 2001;19:1141–1147. doi: 10.1038/nbt1201-1141. [DOI] [PubMed] [Google Scholar]
- 8.Daldrup-Link HE, Rudelius M, Piontek G, Metz S, Brauer R, Debus G, Corot C, Schlegel J, Link TM, Peschel C, Rummeny EJ, Oostendorp RAJ. Migration of Iron Oxide-Labeled Human Hematopoietic Progenitor Cells in a Mouse Model: In Vivo Monitoring with 1.5-T MR Imaging Equipment. Radiology. 2005;234:197–205. doi: 10.1148/radiol.2341031236. [DOI] [PubMed] [Google Scholar]
- 9.Duan XH, Wang Y, Zhang F, Lu LJ, Cao MH, Lin BL, Zhang X, Mao JJ, Shuai XT, Shen J. Superparamagnetic Iron Oxide-Loaded Cationic Polymersomes for Cellular MR Imaging of Therapeutic Stem Cells in Stroke. J. Biomed. Nanotechnol. 2016;12:2112–2124. doi: 10.1166/jbn.2016.2321. [DOI] [PubMed] [Google Scholar]
- 10.Meir R, Betzer O, Motiei M, Kronfeld N, Brodie C, Popovtzer R. Design Principles for Noninvasive, Longitudinal and Quantitative Cell Tracking with Nanoparticle-Based CT Imaging. Nanomedicine. 2017;13:421–429. doi: 10.1016/j.nano.2016.09.013. [DOI] [PubMed] [Google Scholar]
- 11.Wan DQ, Chen DX, Li K, Qu Y, Sun K, Tao K, Dai KR, Ai ST. Gold Nanoparticles as a Potential Cellular Probe for Tracking of Stem Cells in Bone Regeneration Using Dual-Energy Computed Tomography. ACS Appl. Mater. Interfaces. 2016;8:32241–32249. doi: 10.1021/acsami.6b11856. [DOI] [PubMed] [Google Scholar]
- 12.Chhour P, Naha PC, O’Neill SM, Litt HI, Reilly MP, Ferrari VA, Cormode DP. Labeling Monocytes with Gold Nanoparticles to Track Their Recruitment in Atherosclerosis with Computed Tomography. Biomaterials. 2016;87:93–103. doi: 10.1016/j.biomaterials.2016.02.009. [DOI] [PMC free article] [PubMed] [Google Scholar]
- 13.Ntziachristos V. Going Deeper Than Microscopy: The Optical Imaging Frontier in Biology. Nat. Methods. 2010;7:603–614. doi: 10.1038/nmeth.1483. [DOI] [PubMed] [Google Scholar]
- 14.Jokerst JV, Thangaraj M, Kempen PJ, Sinclair R, Gambhir SS. Photoacoustic Imaging of Mesenchymal Stem Cells in Living Mice via Silica-Coated Gold Nanorods. ACS Nano. 2012;6:5920–5930. doi: 10.1021/nn302042y. [DOI] [PMC free article] [PubMed] [Google Scholar]
- 15.Comenge J, Fragueiro O, Sharkey J, Taylor A, Held M, Burton NC, Park BK, Wilm B, Murray P, Brust M, Levy R. Preventing Plasmon Coupling between Gold Nanorods Improves the Sensitivity of Photoacoustic Detection of Labeled Stem Cells in Vivo. ACS Nano. 2016;10:7106–7116. doi: 10.1021/acsnano.6b03246. [DOI] [PubMed] [Google Scholar]
- 16.Nam SY, Ricles LM, Suggs LJ, Emelianov SY. In Vivo Ultrasound and Photoacoustic Monitoring of Mesenchymal Stem Cells Labeled with Gold Nanotracers. PLoS One. 2012;7:e37267. doi: 10.1371/journal.pone.0037267. [DOI] [PMC free article] [PubMed] [Google Scholar]
- 17.Chen PJ, Kang YD, Lin CH, Chen SY, Hsieh CH, Chen YY, Chiang CW, Lee W, Hsu CY, Liao LD, Fan CT, Li ML, Shyu WC. Multitheragnostic Multi-GNRs Crystal-Seeded Magnetic Nanoseaurchin for Enhanced In Vivo Mesenchymal-Stem-Cell Homing, Multimodal Imaging, and Stroke Therapy. Adv. Mater. 2015;27:6488–6495. doi: 10.1002/adma.201502784. [DOI] [PubMed] [Google Scholar]
- 18.Hartanto J, Jokerst JV. Nanoparticles for Ultrasound-Guided Imaging of Cell Implantation. In: Bulte JWM, Modo MMJ, editors. Design and Applications of Nanoparticles in Biomedical Imaging. Springer International Publishing; 2017. pp. 299–314. [Google Scholar]
- 19.Jokerst JV, Khademi C, Gambhir SS. Intracellular Aggregation of Multimodal Silica Nanoparticles for Ultrasound-Guided Stem Cell Implantation. Sci. Transl. Med. 2013;5:177ra35. doi: 10.1126/scitranslmed.3005228. [DOI] [PMC free article] [PubMed] [Google Scholar]
- 20.Kim J, Park S, Jung Y, Chang S, Park J, Zhang Y, Lovell JF, Kim C. Programmable Real-time Clinical Photoacoustic and Ultrasound Imaging System. Sci. Rep. 2016;6:35137. doi: 10.1038/srep35137. [DOI] [PMC free article] [PubMed] [Google Scholar]
- 21.Nie LM, Chen XY. Structural and Functional Photoacoustic Molecular Tomography Aided by Emerging Contrast Agents. Chem. Soc. Rev. 2014;43:7132–7170. doi: 10.1039/c4cs00086b. [DOI] [PMC free article] [PubMed] [Google Scholar]
- 22.Weber J, Beard PC, Bohndiek SE. Contrast Agents for Molecular Photoacoustic Imaging. Nat. Methods. 2016;13:639–650. doi: 10.1038/nmeth.3929. [DOI] [PubMed] [Google Scholar]
- 23.Lemaster JE, Jokerst JV. What is New in Nanoparticle-Based Photoacoustic Imaging? WIREs Nanomed. Nanobiotechnol. 2017;9:e1404. doi: 10.1002/wnan.1404. [DOI] [PMC free article] [PubMed] [Google Scholar]
- 24.Wang JX, Chen F, Arconada-Alvarez SJ, Hartanto J, Yap LP, Park R, Wang F, Vorobyova I, Dagliyan G, Conti PS, Jokerst JV. A Nanoscale Tool for Photoacoustic-Based Measurements of Clotting Time and Therapeutic Drug Monitoring of Heparin. Nano Lett. 2016;16:6265–6271. doi: 10.1021/acs.nanolett.6b02557. [DOI] [PMC free article] [PubMed] [Google Scholar]
- 25.Wang YW, Xie XY, Wang XD, Ku G, Gill KL, O’Neal DP, Stoica G, Wang LV. Photoacoustic Tomography of a Nanoshell Contrast Agent in the In Vivo Rat Brain. Nano Lett. 2004;4:1689–1692. [Google Scholar]
- 26.Kim C, Favazza C, Wang LHV. In Vivo Photoacoustic Tomography of Chemicals: High-Resolution Functional and Molecular Optical Imaging at New Depths. Chem. Rev. 2010;110:2756–2782. doi: 10.1021/cr900266s. [DOI] [PMC free article] [PubMed] [Google Scholar]
- 27.Bhirde A, Xie J, Swierczewska M, Chen XY. Nanoparticles for Cell Labeling. Nanoscale. 2011;3:142–153. doi: 10.1039/c0nr00493f. [DOI] [PMC free article] [PubMed] [Google Scholar]
- 28.Lu CW, Hung Y, Hsiao JK, Yao M, Chung TH, Lin YS, Wu SH, Hsu SC, Liu HM, Mou CY, Yang CS, Huang DM, Chen YC. Bifunctional Magnetic Silica Nanoparticles for Highly Efficient Human Stem Cell Labeling. Nano Lett. 2007;7:149–154. doi: 10.1021/nl0624263. [DOI] [PubMed] [Google Scholar]
- 29.Neoh KG, Kang ET. Surface Modification of Magnetic Nanoparticles for Stem Cell Labeling. Soft Matter. 2012;8:2057–2069. [Google Scholar]
- 30.Frank JA, Miller BR, Arbab AS, Zywicke HA, Jordan EK, Lewis BK, Bryant LH, Bulte JWM. Clinically Applicable Labeling of Mammalian and Stem Cells by Combining; Super-paramagnetic Iron Oxides and Transfection Agents. Radiology. 2003;228:480–487. doi: 10.1148/radiol.2281020638. [DOI] [PubMed] [Google Scholar]
- 31.Seo Y, Satoh K, Morita H, Takamata A, Watanabe K, Ogino T, Hasebe T, Murakami M. Mn-Citrate and Mn-HIDA: Intermediate-Affinity Chelates for Manganese-Enhanced MRI. Contrast Media Mol. Imaging. 2013;8:140–146. doi: 10.1002/cmmi.1510. [DOI] [PubMed] [Google Scholar]
- 32.Kim T, Momin E, Choi J, Yuan K, Zaidi H, Kim J, Park M, Lee N, McMahon MT, Quinones-Hinojosa A, Bulte JWM, Hyeon T, Gilad AA. Mesoporous Silica-Coated Hollow Manganese Oxide Nanoparticles as Positive T1 Contrast Agents for Labeling and MRI Tracking of Adipose-Derived Mesenchyrnal Stem Cells. J. Am. Chem. Soc. 2011;133:2955–2961. doi: 10.1021/ja1084095. [DOI] [PMC free article] [PubMed] [Google Scholar]
- 33.Derfus AM, Chan WCW, Bhatia SN. Intracellular Delivery of Quantum Dots for Live Cell Labeling and Organelle Tracking. Adv. Mater. 2004;16:961–966. [Google Scholar]
- 34.Slotkin JR, Chakrabarti L, Dai HN, Carney RSE, Hirata T, Bregman BS, Gallicano GI, Corbin JG, Haydar TF. In Vivo Quantum Dot Labeling of Mammalian Stem and Progenitor Cells. Dev. Dyn. 2007;236:3393–3401. doi: 10.1002/dvdy.21235. [DOI] [PMC free article] [PubMed] [Google Scholar]
- 35.Zhang YS, Wang Y, Wang LD, Wang YC, Cai X, Zhang C, Wang LHV, Xia YN. Labeling Human Mesenchymal Stem Cells with Gold Nanocages for In Vitro and In Vivo Tracking by Two-Photon Microscopy and Photoacoustic Microscopy. Theranostics. 2013;3:532–543. doi: 10.7150/thno.5369. [DOI] [PMC free article] [PubMed] [Google Scholar]
- 36.Bhattacharya K, Sacchetti C, El-Sayed R, Fornara A, Kotchey GP, Gaugler JA, Star A, Bottini M, Fadeel B. Enzymatic ‘Stripping’ and Degradation of PEGylated Carbon Nanotubes. Nanoscale. 2014;6:14686–14690. doi: 10.1039/c4nr03604b. [DOI] [PubMed] [Google Scholar]
- 37.Wang C, Ma X, Ye S, Cheng L, Yang K, Guo L, Li C, Li Y, Liu Z. Protamine Functionalized Single-Walled Carbon Nanotubes for Stem Cell Labeling and In Vivo Raman/Magnetic Resonance/ Photoacoustic Triple-Modal Imaging. Adv. Funct. Mater. 2012;22:2363–2375. [Google Scholar]
- 38.Alkilany AM, Murphy CJ. Toxicity and Cellular Uptake of Gold Nanoparticles: What We Have Learned So Far? J. Nanopart. Res. 2010;12:2313–2333. doi: 10.1007/s11051-010-9911-8. [DOI] [PMC free article] [PubMed] [Google Scholar]
- 39.Liu Y, Zhao YL, Sun BY, Chen CY. Understanding the Toxicity of Carbon Nanotubes. Acc. Chem. Res. 2013;46:702–713. doi: 10.1021/ar300028m. [DOI] [PubMed] [Google Scholar]
- 40.Link S, Burda C, Nikoobakht B, El-Sayed MA. Laser-Induced Shape Changes of Colloidal Gold Nanorods Using Femtosecond and Nanosecond Laser Pulses. J. Phys. Chem. B. 2000;104:6152–6163. [Google Scholar]
- 41.Pu KY, Shuhendler AJ, Jokerst JV, Mei JG, Gambhir SS, Bao ZN, Rao JH. Semiconducting Polymer Nanoparticles as Photoacoustic Molecular Imaging Probes in Living Mice. Nat. Nanotechnol. 2014;9:233–239. doi: 10.1038/nnano.2013.302. [DOI] [PMC free article] [PubMed] [Google Scholar]
- 42.Ho IT, Sessler JL, Gambhir SS, Jokerst JV. Parts Per Billion Detection of Uranium with a Porphyrinoid-Containing Nanoparticle and In Vivo Photoacoustic Imaging. Analyst. 2015;140:3731–3737. doi: 10.1039/c5an00207a. [DOI] [PMC free article] [PubMed] [Google Scholar]
- 43.Liang XL, Deng ZJ, Jing LJ, Li XD, Dai ZF, Li CH, Huang MM. Prussian Blue Nanoparticles Operate as a Contrast Agent for Enhanced Photoacoustic Imaging. Chem. Commun. 2013;49:11029–11031. doi: 10.1039/c3cc42510j. [DOI] [PubMed] [Google Scholar]
- 44.Long J, Guari Y, Guerin C, Larionova J. Prussian Blue Type Nanoparticles for Biomedical Applications. Dalton Trans. 2016;45:17581–17587. doi: 10.1039/c6dt01299j. [DOI] [PubMed] [Google Scholar]
- 45.Peng JR, Dong ML, Ran B, Li WT, Hao Y, Yang Q, Tan LW, Shi K, Qian ZY. “One-for-AII”-Type, Biodegradable Prussian Blue/Manganese Dioxide Hybrid Nanocrystal for Trimodal Imaging-Guided Photothermal Therapy and Oxygen Regulation of Breast Cancer. ACS Appl. Mater. Interfaces. 2017;9:13875–13886. doi: 10.1021/acsami.7b01365. [DOI] [PubMed] [Google Scholar]
- 46.Cook JR, Dumani DS, Kubelick KP, Luci J, Emelianov SY. Prussian blue Nanocubes: Multi-Functional Nanoparticles for Multimodal Imaging and Image-Guided Therapy (Conference Presentation) In: Oraevsky AA, Wang LV, editors. Photons Plus Ultrasound: Imaging and Sensing. Vol. 10064 SPIE Proceedings; 2017. [Google Scholar]
- 47.Pearce J. Studies of Any Toxicological Effects of Prussian Blue Compounds in Mammals - A Review. Food Chem. Toxicol. 1994;32:577–582. doi: 10.1016/0278-6915(94)90116-3. [DOI] [PubMed] [Google Scholar]
- 48.Jing LJ, Liang XL, Deng ZJ, Feng SS, Li XD, Huang MM, Li CH, Dai ZF. Prussian Blue Coated Gold Nanoparticles for Simultaneous Photoacoustic/CT Bimodal Imaging and Photothermal Ablation of Cancer. Biomaterials. 2014;35:5814–5821. doi: 10.1016/j.biomaterials.2014.04.005. [DOI] [PubMed] [Google Scholar]
- 49.Shokouhimehr M, Soehnlen ES, Hao JH, Griswold M, Flask C, Fan XD, Basilion JP, Basu S, Huang SPD. Dual Purpose Prussian Blue Nanoparticles for Cellular Imaging and Drug Delivery: A New Generation of T1-Weighted MRI Contrast and Small Molecule Delivery Agents. J. Mater. Chem. 2010;20:5251–5259. [Google Scholar]
- 50.Ming H, Torad NLK, Chiang YD, Wu KCW, Yamauchi Y. Size- and Shape-Controlled Synthesis of Prussian Blue Nanoparticles by a Polyvinylpyrrolidone-Assisted Crystallization Process. CrystEngComm. 2012;14:3387–3396. [Google Scholar]
- 51.Altagracia-Martinez M, Kravzov J, Martínez N, Ríos C, Lopez N. Prussian Blue as an Antidote for Radioactive Thallium and Cesium Poisoning. Orphan Drugs: Res. Rev. 2012;13:13–21. [Google Scholar]
- 52.Buser HJ, Schwarzenbach D, Petter W, Ludi A. Crystal Structure of Prussain Blue: Fe4[Fe(CN)6]3.xH2O. Inorg. Chem. 1977;16:2704–2710. [Google Scholar]
- 53.Zhdanov RI, Podobed OV, Vlassov VV. Cationic Lipid-DNA Complexes-Lipoplexes for Gene Transfer and Therapy. Bioelectrochemistry. 2002;58:53–64. doi: 10.1016/s1567-5394(02)00132-9. [DOI] [PubMed] [Google Scholar]
- 54.Kim HS, Oh SY, Joo HJ, Son KR, Song IC, Moon WK. The Effects of Clinically Used MRI Contrast Agents on The Biological Properties of Human Mesenchymal Stem Cells. NMR Biomed. 2010;23:514–522. doi: 10.1002/nbm.1487. [DOI] [PubMed] [Google Scholar]
- 55.Babic M, Horak D, Trchova M, Jendelova P, Glogarova K, Lesny P, Herynek V, Hajek M, Sykova E. Poly(L-lysine)-Modified Iron Oxide Nanoparticles for Stem Cell Labeling. Bioconjugate Chem. 2008;19:740–750. doi: 10.1021/bc700410z. [DOI] [PubMed] [Google Scholar]
- 56.Kim T, Lee N, Arifin DR, Shats I, Janowski M, Walczak P, Hyeon T, Bulte JWM. In Vivo Micro-CT Imaging of Human Mesenchymal Stem Cells Labeled with Gold-Poly-l-Lysine nanocomplexes. Adv. Funct. Mater. 2017;27:1604213. doi: 10.1002/adfm.201604213. [DOI] [PMC free article] [PubMed] [Google Scholar]
- 57.Pyrasch M, Tieke B. Electro- and Photoresponsive Films of Prussian Blue Prepared Upon Multiple Sequential Adsorption. Langmuir. 2001;17:7706–7709. [Google Scholar]
- 58.Zhao W, Xu JJ, Shi CG, Chen HY. Multilayer Membranes via Layer-By-Layer Deposition of Organic Polymer Protected Prussian Blue Nanoparticles and Glucose Oxidase for Glucose Biosensing. Langmuir. 2005;21:9630–9634. doi: 10.1021/la051370+. [DOI] [PubMed] [Google Scholar]
- 59.Singh HD, Wang GL, Uludag H, Unsworth LD. Poly-L-lysine-Coated Albumin Nanoparticles: Stability, Mechanism for Increasing In Vitro Enzymatic Resilience, and SiRNA Release Characteristics. Acta Biomater. 2010;6:4277–4284. doi: 10.1016/j.actbio.2010.06.017. [DOI] [PubMed] [Google Scholar]
- 60.Gratton SEA, Ropp PA, Pohlhaus PD, Luft JC, Madden VJ, Napier ME, DeSimone JM. The Effect of Particle Design on Cellular Internalization Pathways. Proc. Natl. Acad. Sci. U. S. A. 2008;105:11613–11618. doi: 10.1073/pnas.0801763105. [DOI] [PMC free article] [PubMed] [Google Scholar]
- 61.Smith PJ, Giroud M, Wiggins HL, Gower F, Thorley JA, Stolpe B, Mazzolini J, Dyson RJ, Rappoport JZ. Cellular Entry of Nanoparticles via Serum Sensitive Clathrin-Mediated Endocytosis, and Plasma Membrane Permeabilization. Int. J. Nanomed. 2012;7:2045–2055. doi: 10.2147/IJN.S29334. [DOI] [PMC free article] [PubMed] [Google Scholar]
- 62.Luhmann T, Rimann M, Bitterman AG, Hall H. Cellular Uptake and Intracellular Pathways of PLL-g-PEG-DNA Nanoparticles. Bioconjugate Chem. 2008;19:1907–1916. doi: 10.1021/bc800206r. [DOI] [PubMed] [Google Scholar]
- 63.Arbab AS, Bashaw LA, Miller BR, Jordan EK, Bulte JWM, Frank JA. Intracytoplasmic Tagging of Cells with Ferumoxides and Transfection Agent for Cellular Magnetic Reisonance Imaging after Cell Transplantation: Methods and Techniques. Transplantation. 2003;76:1123–1130. doi: 10.1097/01.TP.0000089237.39220.83. [DOI] [PubMed] [Google Scholar]
- 64.Elsabahy M, Wooley KL. Cytokines as Biomarkers of Nanoparticle Immunotoxicity. Chem. Soc. Rev. 2013;42:5552–5576. doi: 10.1039/c3cs60064e. [DOI] [PMC free article] [PubMed] [Google Scholar]
- 65.Murray AR, Kisin E, Inman A, Young SH, Muhammed M, Burks T, Uheida A, Tkach A, Waltz M, Castranova V, Fadeel B, Kagan VE, Riviere JE, Monteiro-Riviere N, Shvedova AA. Oxidative Stress and Dermal Toxicity of Iron Oxide Nanoparticles In Vitro. Cell Biochem. Biophys. 2013;67:461–476. doi: 10.1007/s12013-012-9367-9. [DOI] [PubMed] [Google Scholar]
- 66.Dominici M, Le Blanc K, Mueller I, Slaper-Cortenbach I, Marini FC, Krause DS, Deans RJ, Keating A, Prockop DJ, Horwitz EM. Minimal Criteria for Defining Multipotent Mesenchymal Stromal Cells. Cytotherapy. 2006;8:315–317. doi: 10.1080/14653240600855905. [DOI] [PubMed] [Google Scholar]
- 67.Ramos TL, Sanchez-Abarca LI, Muntion S, Preciado S, Puig N, Lopez-Ruano G, Hernandez-Hernandez A, Redondo A, Ortega R, Rodriguez C, Sanchez-Guijo F, del Canizo C. MSC Surface Markers (CD44, CD73, and CD90) Can Identify Human MSC-Derived Extracellular Vesicles by Conventional Flow Cytometry. Cell Commun. Signaling. 2016;14 doi: 10.1186/s12964-015-0124-8. [DOI] [PMC free article] [PubMed] [Google Scholar]
- 68.Stappenbeck TS, Miyoshi H. The Role of Stromal Stem Cells in Tissue Regeneration and Wound Repair. Science. 2009;324:1666–1669. doi: 10.1126/science.1172687. [DOI] [PubMed] [Google Scholar]
- 69.Bulte JWM. In Vivo MRI Cell Tracking: Clinical Studies. AJR, Am. J. Roentgenol. 2009;193:314–325. doi: 10.2214/AJR.09.3107. [DOI] [PMC free article] [PubMed] [Google Scholar]
- 70.Kondziolka D, Steinberg GK, Wechsler L, Meltzer CC, Elder E, Gebel J, DeCesare S, Jovin T, Zafonte R, Lebowitz J, Flickinger JC, Tong D, Marks MP, Jamieson C, Luu D, Bell-Stephens T, Teraoka J. Neurotransplantation for Patients with Subcortical Motor Stroke: a Phase 2 Randomized Trial. J. Neurosurg. 2005;103:38–45. doi: 10.3171/jns.2005.103.1.0038. [DOI] [PubMed] [Google Scholar]
- 71.Kondziolka D, Wechsler L, Goldstein S, Meltzer C, Thulborn KR, Gebel J, Jannetta P, DeCesare S, Elder EM, McGrogan M, Reitman MA, Bynum L. Transplantation of Cultured Human Neuronal Cells for Patients with Stroke. Neurology. 2000;55:565–569. doi: 10.1212/wnl.55.4.565. [DOI] [PubMed] [Google Scholar]
- 72.de Freitas GR, Mendonca MLF, Bezerra DC, Silva SA, Falcao CH, Gonzales CS, Moreira RC, Haddad AF, Tuche FA, Santos DP, Andre C, Mesquita CT, Oliveira AA, Elia V, Dohmann HJ, Borojevic R, Mendez-Otero R, Dohmann H. Safety and Feasibility of Intra-Arterial Autologous Bone Marrow Mononuclear Cell Transplantation in Acute Ischemic Stroke. Stroke. 2006;37:624–625. [Google Scholar]
- 73.Xia J, Wang LV. Photoacoustic Tomography of the Brain. In: Madsen SJ, editor. Optical Methods and Instrumentation in Brain Imaging and Therapy. Springer; New York: 2013. pp. 137–156. [Google Scholar]
- 74.Deng ZL, Wang Z, Yang XQ, Luo QM, Gong H. In Vivo Imaging of Hemodynamics and Oxygen Metabolism in Acute Focal Cerebral Ischemic Rats with Laser Speckle Imaging and Functional Photoacoustic Microscopy. J. Biomed. Opt. 2012;17:081415. doi: 10.1117/1.JBO.17.8.081415. [DOI] [PubMed] [Google Scholar]
- 75.Hu S, Gonzales E, Soetikno B, Gong EH, Yan P, Maslov K, Lee JM, Wang LHV. Optical-Resolution Photoacoustic Microscopy of Ischemic Stroke. In: Oraevsky AA, Wang LV, editors. Photons Plus Ultrasound: Imaging and Sensing. Vol. 7899 SPIE Proceedings; 2011. [Google Scholar]
Associated Data
This section collects any data citations, data availability statements, or supplementary materials included in this article.