
Figure 1.
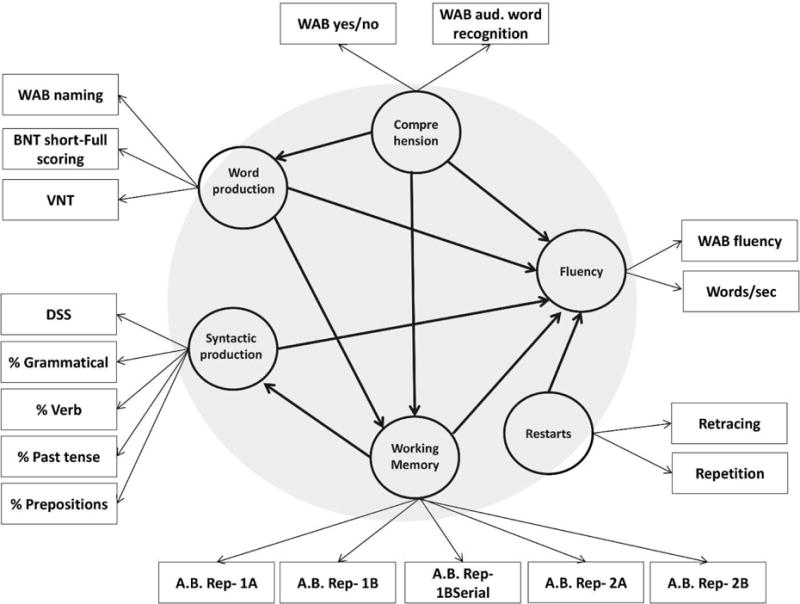
The architecture of the fluency pls-pm model. The circles show latent variables, and the rectangles the manifest variables (see also Table 2). The large gray circle represents the inner model. The direction of the arrows indicates which variable exerts an influence over the other variables. Note that the latent variables in the model are all reflective.