
Figure 2.
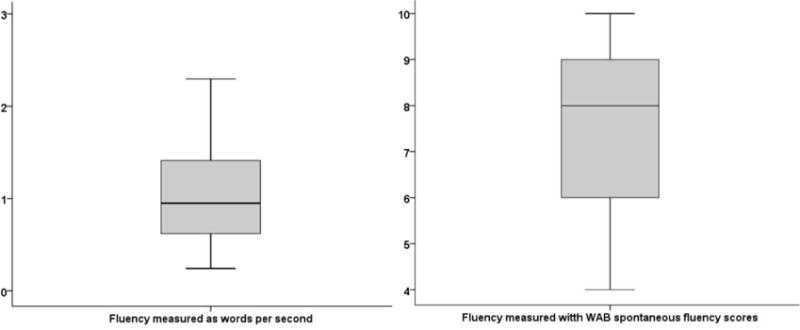
Box plots for the two measures of fluency in the participants (N = 112). The left panel shows fluency measured as words/second. Right panel shows fluency measured as WAB-R spontaneous fluency scores.
Official websites use .gov
A
.gov website belongs to an official
government organization in the United States.
Secure .gov websites use HTTPS
A lock (
) or https:// means you've safely
connected to the .gov website. Share sensitive
information only on official, secure websites.
Box plots for the two measures of fluency in the participants (N = 112). The left panel shows fluency measured as words/second. Right panel shows fluency measured as WAB-R spontaneous fluency scores.