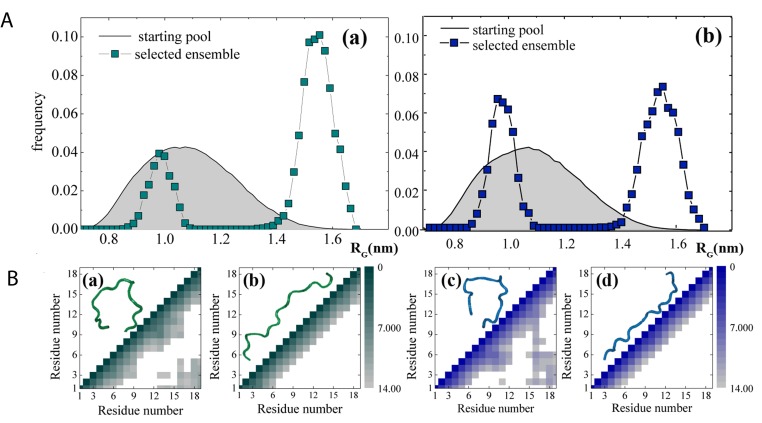
Figure 8. Ensembles of structures populated by NH2htau in aqueous solution differ from those by its reverse sequence.
A. EOM starting pool of conformations (gray shaded curves) and selected ensembles (filled square) for NH2htau (a) and its reverse counterpart (b). B. contact maps (Cα–Cα distance between all pairs of residues) of four highly probable conformations, namely: a highly probable NH2htau/reverse sequence conformation extracted from the peak at low RG values (a-c) and high RG value (b-d). Distances between different residues are expressed in Å (a cut-off distance at 14 Å was used). In the figure insets, a snapshot of the corresponding configuration is reported.

