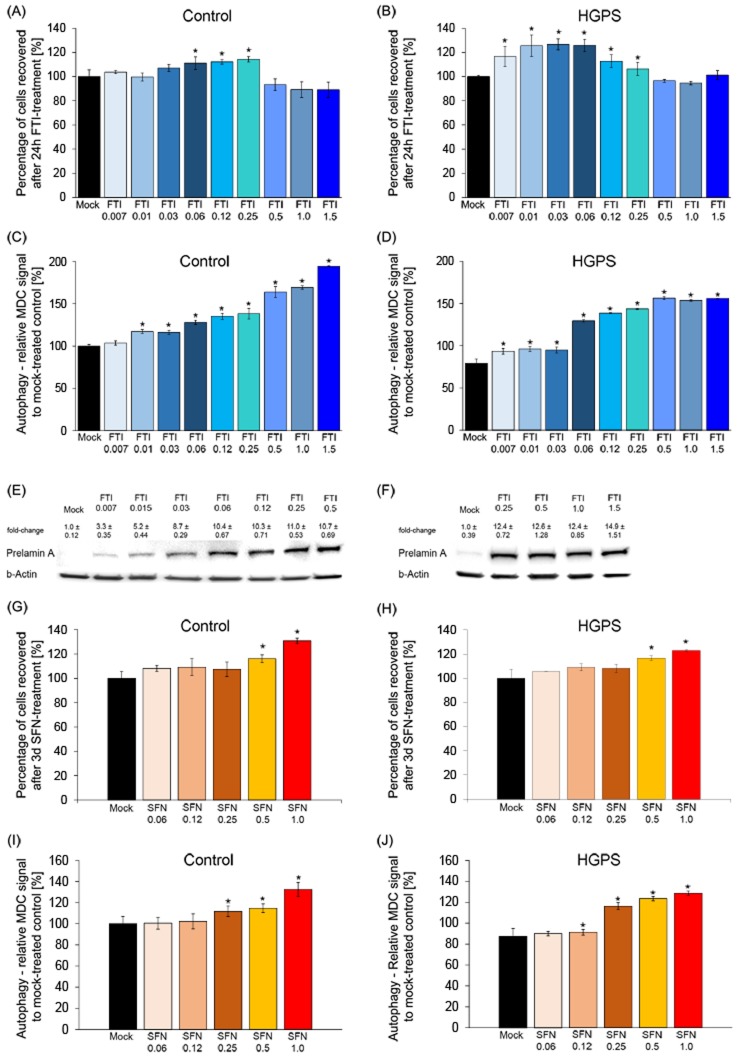
Figure 2. Defining the minimal FTI and SFN doses effective in HGPS cells.
A. Control cells were mock-treated (vehicle, DMSO) or treated for 24 hours with different concentrations of FTI, as indicated. The percentage of cells recovered after drug treatment was calculated relative to mock-treated cells. Data are expressed as the mean ± S.D. (*p-value ≤ 0.05; n = 5). B. HGPS cells were treated and analyzed as stated in (A). C. and D. Autophagy activity was measured as described in the Methods section for control and HGPS cells, as indicated. Cells were treated with different concentrations of FTI for 24 hours as indicated. The percentage of activity was calculated relative to mock-treated cells. Data are expressed as the mean ± S.D. (*p-value ≤ 0.05; n = 5). E. and F. Western blot of HGPS cells mock-treated or treated with different concentrations of FTI for 24 hours. Blot was probed with an anti-prelamin A antibody and b-Actin. Numbers above each band indicate the fold-change ± S.D. of prelamin A accumulation relative to mock-treated control. G. and H. Control and HGPS cells were mock-treated or treated with different concentrations of SFN daily for 3 days as indicated. The percentage of cells recovered after drug treatment was calculated relative to mock-treated cells and presented as the mean± S.D. (*p-value ≤ 0.05; n = 5). I. and J. The same cells and culture conditions as in (G and H) were used to measure the levels of autophagy in control (G) and HGPS (H) cells. Autophagy activity was determined using monodansylcadaverine (MDC). Data are expressed as the mean ± S.D. relative to mock-treated cells (*p-value ≤ 0.05; n = 5).

