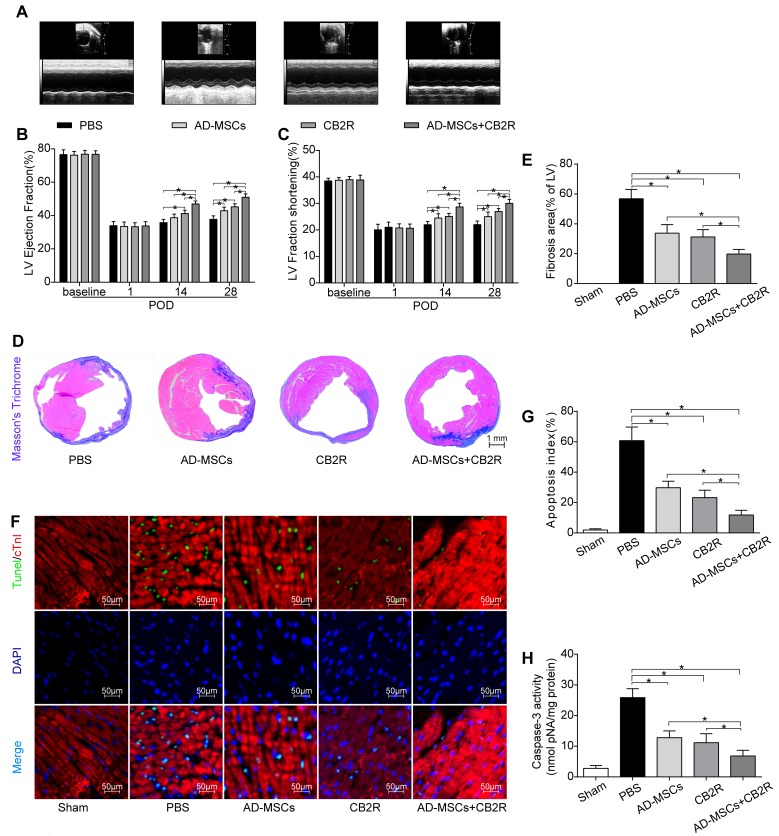
Figure 2. Effects of AD-MSCs and CB2 agonist treatment on post-MI cardiac function, cardiac fibrosis and apoptosis.
A. Representative M-mode images by echocardiography on POD28. Left ventricle ejection fraction B. and fractional shortening C. were calculated by M-mode echocardiography on baseline, POD 1, 14, and 28(n = 6). *P < 0.05 between indicated groups. D., E. Myocardial fibrosis was determined by Masson’s trichrome staining (n = 6-8, bar = 1 mm). F. Representative TUNEL graphs depicting myocardial apoptosis on POD3. TUNEL-positive cells (green fluorescence), cTnI (red fluorescence), and DAPI-positive nuclei (blue fluorescence), bar = 50μm; G. Graphs summarize apoptosis index calculated by the number of TUNEL-positive nuclei per 100 nuclei from five randomly selected fields and H. Myocardial caspase-3 activity (n = 6-8) was measured. *P < 0.05 between indicated groups.

