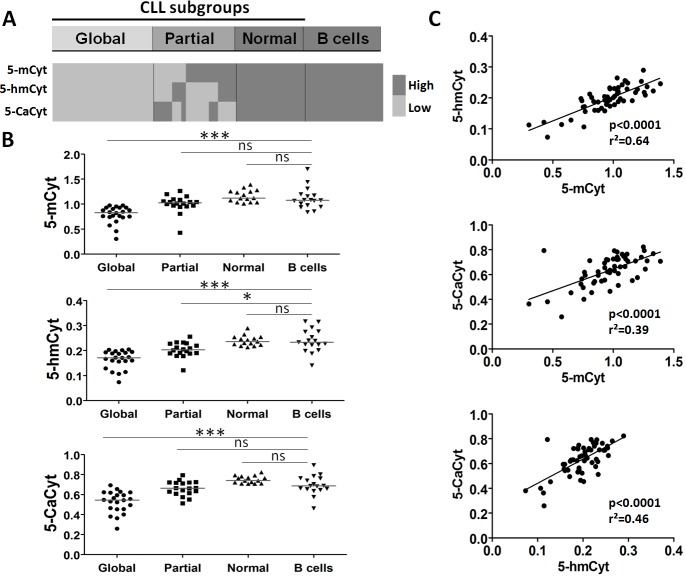
Figure 2. Analysis of cytosine (5-Cyt) derivatives in chronic lymphocytic leukemia (CLL) B cells defines distinct subgroups.
(A) The graphical representation indicates the presence of three subgroups by comparing CLL B cells and control B cells with high and low levels of global 5-methylcytosine (5-mCyt), 5-hydroxymethylcytosine (5-hmCyt), and 5-carboxylcytosine (5-CaCyt) as determined in Figure 1. The 3 subgroups: global deficiency in all 5-Cyt derivatives (global, n = 22), partial deficiency in 1 or 2 of the 5-Cyt derivatives (partial, n = 18), and 5-Cyt derivative normal content (normal, n=15) similar to healthy control B cells (B cells, n = 17). (B) 5-Cyt derivative levels according to the 3 CLL subgroups and control B cells. The median value is indicated (line), and statistical differences of the comparison with control B cells are indicated as follows: (***) P < 0.001; (**) 0.001 < P < 0.01; (*) 0.01< P < 0.05; ns, not significant. (C) Linear regression analysis between 5-mCyt, 5-hmCyt and 5-CaCyt. The P and r2 values are indicated.

