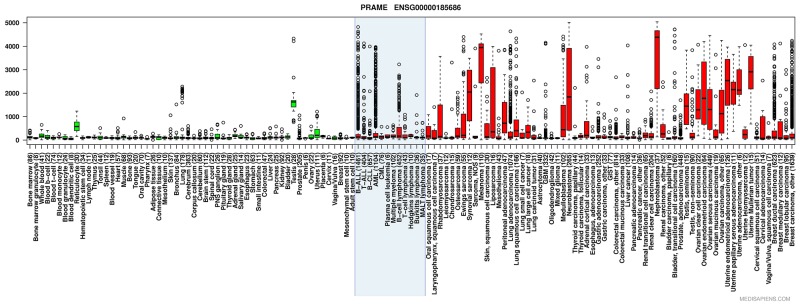
Figure 1. Anatomical and disease specific PRAME expression in various types of normal and malignant tissues.
Box plot with whiskers describing relative PRAME expression in healthy (green boxes) and malignant (red boxes) tissues. Boxes include values between the upper and lower quartile, with whiskers extending to 1.5 times the interquartile ranges. Outliers are marked as hollow circles. The blue shaded box entails hematological tumors. (Tissue boxplot from http://ist.medisapiens.com/).

