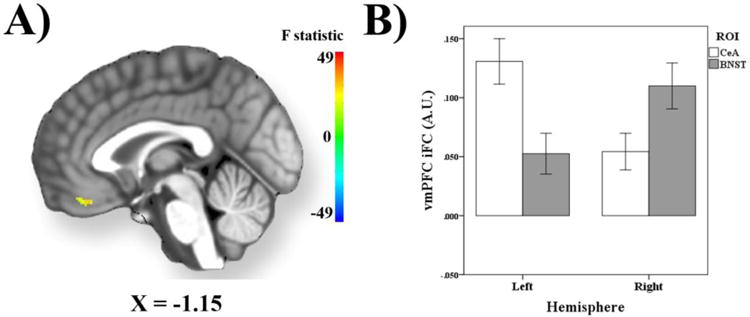
Figure 4.

Seed ROI x Hemisphere Effects within Ventromedial Prefrontal Cortex. (A) Statistical image depicting results within the ventromedial prefrontal cortex (vmPFC) that exhibit a significant interaction between seed ROI (CeA vs. BNST) and hemisphere (left vs. right). (B) Bar graphs depicting mean iFC values from the vmPFC as a function of ROI and hemisphere. iFC values are reported in arbitrary units (A.U.). Error bars reflect 1 standard error.
