Abstract
Objective
To develop an approach for radiology-pathology fusion of ex vivo histology of surgically excised pulmonary nodules with pre-operative CT, to radiologically map spatial extent of the invasive adenocarcinomatous component of the nodule.
Methods
Our study included six subjects (age: 75±11) with pre-operative CT and surgically excised ground-glass nodules (size: 22.5±5.1mm) with a significant invasive adenocarcinomatous component (>5mm). The expert pathologist outlined the disease extent on digitized histology specimens; three expert radiologists delineated the entire nodule on CT (in-plane resolution: <0.8mm, inter-slice distance: 1–5mm). We introduced a novel reconstruction approach to localize histology slices in 3D relative to each other while using the CT scan as spatial constraint. This methodology enabled the spatial mapping of the extent of tumor invasion from histology onto CT.
Results
Good overlap of the 3D reconstructed histology and the nodule outlined on CT was observed (65.9±5.2%). Reduction in 3D misalignment of corresponding anatomic landmarks on histology and CT was observed (1.97±0.42mm). Moreover, the CT attenuation (Hounsfield unit) distributions were different when comparing the invasive and in situ regions.
Conclusion
This proof-of-concept study suggests that our fusion method can enable the spatial mapping of the invasive adenocarcinomatous component from 2D histology slices onto in vivo CT.
Keywords: Lung adenocarcinoma, Computed Tomography, Pathology, Computer-Assisted Image Processing, Multimodal Imaging
Introduction
The early assessment of the extent of invasive adenocarcinoma in ground glass nodules may allow for prompt surgical resection, resulting in a near 100% cure rate [1–3]. Currently, radiology readers on lung CT scans are unable to conclusively distinguish invasive adenocarcinoma from adenocarcinoma in situ for ground glass nodules [2]. Histologic assessment of the biopsied or resected nodules remains the definitive approach to confirm the presence and the extent of invasive adenocarcinoma in CT persistent nodules. Accurate assessment of the extent of invasive adenocarcinoma is essential as it has been shown [4] to be the only independent predictor of survival in ground-glass nodules. Alternative approaches for assessing the extent of invasion using CT may facilitate prompt resection of the nodule.
Recent work has sought to characterize the appearance of invasive adenocarcinoma on CT using feature analysis [5–9]. These methods evaluate features for the entire nodule without considering the extent of invasion. However, both invasive and adenocarcinoma in situ may co-exist in the same nodule. Spatially mapping the extent of invasive and in situ disease onto the CT from histopathology may in turn enable better definition of imaging features on CT for these pathologies and hence may facilitate improved and non-invasive disease characterization. To the best of our knowledge careful co-registration of surgically resected lung nodules with preoperative CT scans has not been previously performed.
Previous co-registration methods for radiology-pathology fusion in organs, other than the lung have relied on first identifying slice or landmark correspondences between the histology and the in vivo imaging. These approaches attempted to align 2D histology slices to either the corresponding 2D slice from the in vivo image [10] or directly to the 3D in vivo images [11]. However, they may cause unnatural elastic deformations since they are attempting to anchor 2D histology slices within a 3D volume. Consequently, these approaches tend to be sensitive to the choice of slice/landmark correspondences. Moreover, the process of establishing 2D-2D slice correspondences between the histology and imaging is often difficult, especially in pulmonary nodules due to the fact that the histology specimen is sectioned in a manner independent of the imaging viewing planes of the CT scan. To circumvent these shortcomings, 3D reconstruction methods [12, 13] have been proposed to create 3D histology volumes from consecutive histology slices from the surgically excised specimen. Such 3D reconstruction methods also facilitate 3D-3D radiology-pathology co-registration [13], thereby mitigating unnatural elastic deformations and removing the need for explicitly identifying slice/landmark correspondences.
In this paper we introduce a novel approach for the fusion of histology specimens with in vivo CT in the context of pulmonary ground glass nodules. First, consecutive 2D histology slices are aligned using group-wise registration to create a 3D histology reconstructed volume. This approach involves first reconstructing the histologic volume and then refining the reconstructed volume using spatial constraints provided by the CT scan of the nodule. The group-wise registration ensures that all the histology slices are “aware” of each other during the reconstruction, while the nodule outlined on CT serves to provide a spatial constraint. Next, the CT of the nodule is co-registered with the 3D reconstructed histology volume identifying the optimal translation and rotation in a grid-like exhaustive search. This optimization step seeks to identify spatial correspondences between histology and CT, particularly revealing where the histology specimen was sectioned relative to the CT viewing planes. This step is essential for those nodules where 2D correspondences cannot be identified between the histology slices and CT scan. Finally, we identify the optimal affine and elastic transformations required to align the 3D CT image of the nodule with the 3D reconstructed histology volume. The elastic co-registration step is critical to account for the fact the lung tissue is soft and tends to collapse during histology preparation [14]. In this proof-of concept study, we evaluated our multi-modal fusion methodology for six ground glass nodules.
Material and Methods
Case selection
The institutional review board at our institution waived written consent for this retrospective study. Between 2006 and 2014, more than 100 patients underwent resection of nodules in our institution (Figure 1). Patients with solid large nodules (>40mm), with <3 histology slices or with histology slices showing substantial artifacts were excluded from this study (see supplementary material for details). The histology-CT fusion was performed in six nodules (volume: 3.5±1.0 ml; size: 22.5±5.1 mm), which were resected from six subjects (4 males, 2 females, age range: 75±11).
Figure 1.
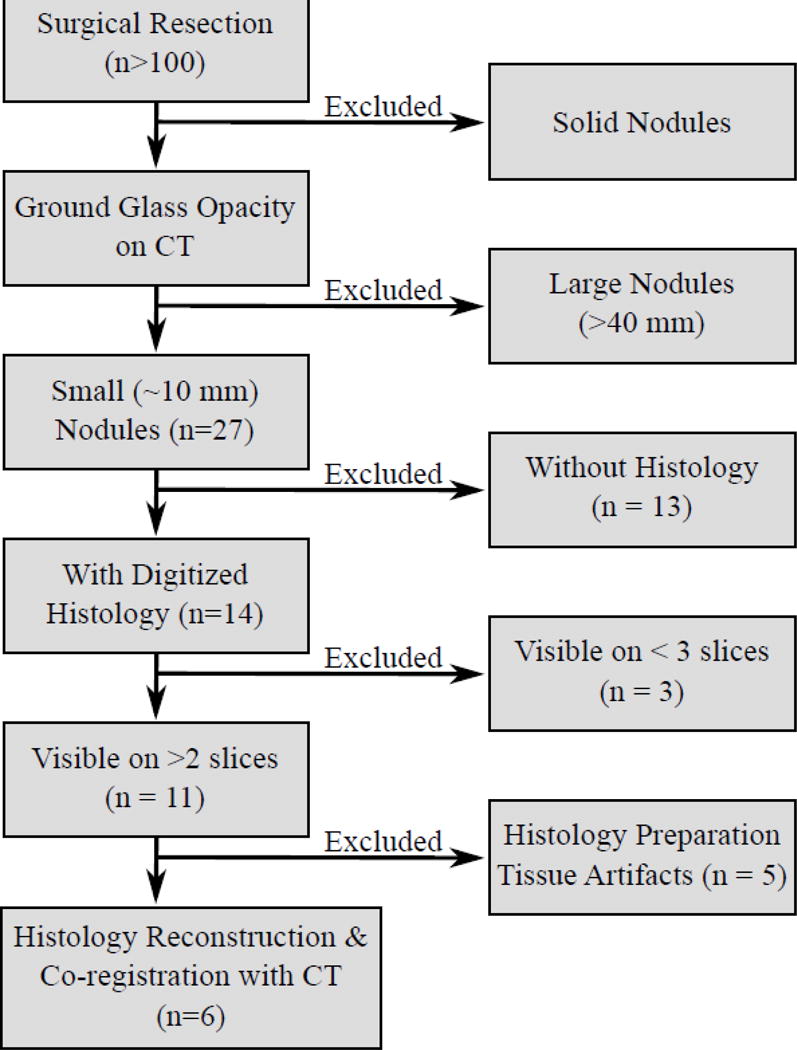
Inclusion criteria.
In Vivo Imaging
The pre-operative CT scan was acquired without contrast media administration (Table 1). Three expert radiologists with 3, 16 and 20 years, respectively, of experience reading chest CT, outlined the nodule on each CT slice using 3D Slicer [15]. The radiologists were blinded to the pathologic diagnosis of the nodule and the delineations obtained from each of the other raters. The inter-rater agreement, evaluated via the Cohen Kappa (κ) statistic [16], was on average 0.68±0.08, where κ=1.00 reflects perfect agreement. Due to differences observed in the outlines of these ground glass nodules, a consensus delineation was constructed by combining the individual delineations of the three different raters (Supplementary Figure 1). A voxel (unit of volume) that was found to be within the nodule annotation of at least two raters was included as part of the consensus delineation, all other voxels in the individual rater delineations were ignored. For each nodule, we applied our radiology-pathology fusion framework four times, for outlines provided for each of the three raters as well as for the consensus annotation. Moreover, the blood vessels in close proximity of the nodule were manually outlined by tracing those hyperintense tubular objects which were visible across multiple contiguous CT sections. The CT scans were reconstructed with 512×512 in-plane pixels and 125–385 slices, while the in-plane resolution was 0.6–0.8 mm and the distance between slices was 1.0–5.0 mm. The nodules had a mean ± standard deviation of −294 ± 288 HU.
Table 1.
Nodule characteristics and data acquisition details. * mean ± standard deviation
| Measurements | CT | Histology | ||||||||||||
|---|---|---|---|---|---|---|---|---|---|---|---|---|---|---|
| Nodule ID |
Size* (mm) |
Solid Component (mm) |
Volume* (ml) |
Kappa* | Reconst. Software |
Tube Voltage (kV) |
Radiation Dose (mSv) |
Exposure (mAs) |
Slice thickness (mm) |
Pixel Spacing (mm) |
Distance Between Slices (mm) |
Slice Number |
Pixel Spacing (mm) |
Distance Between Slices (mm) |
| 1 | 15.6±1.4 | 9.3±0.5 | 2.3±0.9 | 0.65±0.04 | Syngo Ct 2007S | 120 | 3–5 | 120–150 | 2 | 0.80 | 1 | 4 | 2.3e–4 | 4–5 |
| 2 | 19.2±4.9 | 9.3±0.6 | 2.9±1.2 | 0.62±0.11 | Syngo Ct 2010 A | 120 | 3–5 | 120–150 | 2 | 0.76 | 1 | 3 | 2.3e–4 | 4–5 |
| 3 | 19.2±3.6 | 16.3±0.3 | 3.6±2.1 | 0.56±0.09 | – | 120 | 3–5 | 120–150 | 2 | 0.66 | 1 | 3 | 2.3e–4 | 4–5 |
| 4 | 27.9±6.5 | 18.8±0.7 | 4.4±1.9 | 0.70±0.10 | Syngo VB10B | 120 | 3–5 | 120–150 | 5 | 0.73 | 5 | 3 | 2.3e–4 | 4–5 |
| 5 | 26.4±2.2 | 24.1±2.9 | 3.0±0.5 | 0.76±0.03 | Syngo Ct 2007S | 120 | 3–5 | 120–150 | 2 | 0.72 | 1 | 5 | 2.3e–4 | 4–5 |
| 6 | 26.8±0.6 | 17.4±4.4 | 4.9±0.8 | 0.77±0.02 | Syngo Ct 2008G | 120 | 3–5 | 120–150 | 2 | 0.57 | 2 | 5 | 2.3e–4 | 4–5 |
Ex vivo Imaging
Following resection, the tissue was fixed in formaldehyde, and stained with Hematoxylin and Eosin. The specimen was then sectioned in thin slices that were 4–5 mm apart from each other. The expert pathologist (7 years of experience) assessed the nodule for presence of invasive adenocarcinoma and adenocarcinoma in situ according to the 2011 pathologic classification criteria [17]. The slices were scanned at 40× magnification (pixel size: 0.23 μm), and had the invasive and in situ components manually outlined (Aperio ImageScope, Leica Systems) by the expert pathologist on our study. Each nodule included in the study had an invasive component > 5.0 mm. Adenocarcinoma in situ was observed in two nodules, while the remaining four nodules were pathologically identified as comprising of exclusively invasive adenocarcinoma.
Co-registration of CT and histology specimens of lung nodule
Our fusion approach comprised multiple steps and the workflow is illustrated in Figure 2. Each step is summarized below, with details in the supplementary material.
Figure 2.
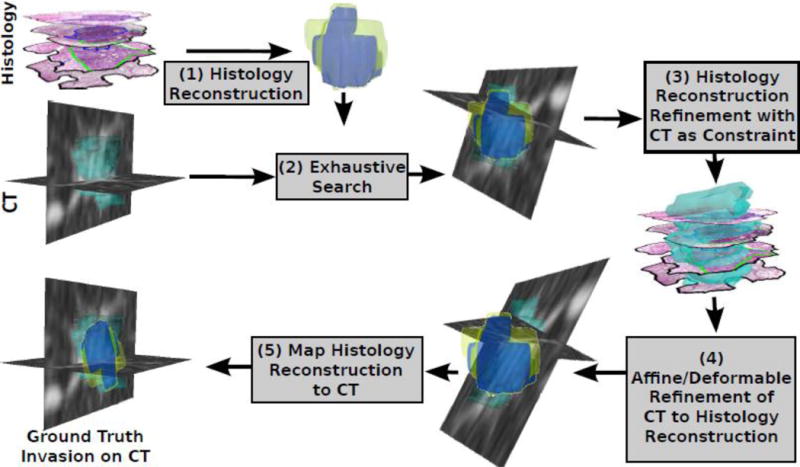
Histology-CT Fusion framework enables the mapping of invasive adenocarcinoma from histology onto CT via (1) the 3D reconstruction of the histology specimens, (2) a global search to identify the best fit of the reconstruction onto CT, (3) the refinement of the 3D histology reconstruction using CT as constraint, (4) the 3D-3D registration of CT to the histology reconstruction, and (5) the mapping of the histology reconstruction including the invasive component onto CT.
3D reconstruction of the histology volume from 2D sections
Prior to histology reconstruction, the histology slices were preprocessed by (1) down-sampling the image to a pixel resolution of 39 μm in the X–Y plane, and (2) rotating them to ensure gross alignment relative to each other. The first step of the framework involves the histology reconstruction, independently of CT (Figure 2), which was achieved via group-wise registration. Similar to the approach described in [12], our method aligned the histology slices relative to each other using rigid transformations, i.e. in plane 2D translations and a rotation. The iterative approach first involved the alignment of the first two histology slices relative to each other using mutual information to assess their spatial alignment. The third slice is then aligned relative to the previous two using a weighted average of mutual information (see equation 2 in the supplementary material). The process is iterated further for the fourth and fifth slices for the nodules with N=4 or N=5 slices. The outcome of this reconstruction step is a 3D volume approximately representing what the histology specimen must have looked like prior to sectioning.
During the reconstruction of the histology sample, there was uncertainty regarding the placement of the first histology slice, stemming from not knowing whether the slice corresponded to the bottom or from the top of the stack of histology slices. Unfortunately this information was not discernible from the corresponding surgical or pathology records. To solve the ambiguity we configured the histology slice stack using both assumptions, firstly that the first slice corresponded to the bottom slice and then that it corresponded to the top slice. The correct reconstruction was chosen based on the configuration which achieved the best alignment with CT (see evaluation strategy below). For simplicity, from here on we use the term histology reconstruction, to refer to both the original reconstruction or its vertically mirrored version.
Moreover, precise information regarding the slice spacing for the cases considered in this study were not mentioned in the corresponding pathology reports. We were however able to learn that tissue sectioning for lung nodules in typically performed with a 4–5 mm slice spacing at our institution. Consequently in our simulations, we performed the 3D histologic reconstruction using both 3 and 4 mm slice spacing. We opted to use a slice spacing less than 5 mm, to account for the tissue shrinkage commonly observed during histology sample fixation. We compared the two different reconstructions (with 3 and 4 mm respectively) in terms of the best fit against the nodule appearance on CT using the evaluation strategies described below. Note that from here on, for the sake of simplicity, we refer to the histologic reconstruction without explicitly referencing the slice spacing (3 or 4 mm) invoked.
In the second step of the framework (Figure 2), a global search is employed to identify the optimal 3D rotation of the nodule on CT relative to the histology reconstruction. A grid-like search is employed to achieve accurate alignment between the moving volume the CT, and the fixed volume, the histology reconstruction, using the package elastix [18] and a FullSearchSpace optimization.
In the third step (Figure 2), the histology reconstruction is further improved via incorporation of constraints based off the appearance of the nodule on the CT. Specifically, the rotation and translation of each histology slice were further optimized using the same group-wise approach but with an additional scoring term that assesses the overlap of the histology slice with the nodule on CT [12] (see details in the supplementary material).
Co-registration of CT of the nodule with the 3D reconstructed histology volume
Following these three reconstruction steps, our approach identified the optimal alignment of the CT relative to the histology reconstruction using both affine and deformable transformations (Step 4 in Figure 2). Up until this point in the methodology, the 3D reconstructed histology volume served as the reference for registration as the fixed volume, while the CT scan served as the moving volume. However, our approach seeks to identify the alignment of the histology reconstruction with respect to the entire CT scan, which was achieved in Step 5 by identifying the inverse of the transform obtained at Step 4. This inverse transform is then used to map the 3D reconstructed histology volume onto CT, while also mapping of the manually delineated invasive and in situ components from the histology reconstruction onto the in vivo CT.
The 3D histology reconstruction was performed using an in-house Matlab toolkit (MATLAB and Statistics Toolbox Release 2013b, The MathWorks, Inc., Natick, Massachusetts, United States) while the radiology-pathology co-registration was performed used the ITK – based package elastix [18]. All the program scripts that were used for generating the results and data in this paper have been made available at https://github.com/mirabelarusu/RadPathFusionLung.
Evaluation Strategy
To evaluate the accuracy of the fusion methodology, we measured the alignment of the histology reconstruction and the nodule outlined on CT via the dice similarity coefficient (DSC). The DSC measures the overlap between objects, and ranges between 0% (no overlap) and 100% (perfect overlap). We also evaluated the multi-modal registration approach using anatomic landmarks that are visible on both modalities. Specifically, the evaluation was done relative to the blood vessels since they are visible and were annotated on both the corresponding histology images and the CT scan (see supplementary material, eq. 4). Note that these landmarks were not utilized to drive the registration but only serve to assess the quality of the reconstruction and registration. As opposed to manually picking corresponding fiducials, the automatic calculation of the distance between the blood vessels provides a more objective approach to assess the accuracy of the alignment and it is evaluated in 3D.
For each nodule, we had a total of 4 possible 3D histologic configurations, corresponding to two different slice intervals (3 or 4 mm) and bottom-up and top-down slice stacks. Each of the four 3D histologic reconstructions were mapped onto CT and the optimal fit was chosen from the four reconstruction based reconstruction was identified as the one which resulted in the minimum distance between landmarks identified on the blood vessels on CT and histology respectively.
Additionally, we evaluated the accuracy of our co-registration method by comparing the HU distributions between the invasive and in situ mapped regions, the hypothesis being that if the spatial mapping of these two tissue partitions had been done accurately, the corresponding CT attenuation distributions within these compartments should be different.
Results
Figures 5–6 and Supplementary Movies S1–S2 show the co-registration results for a 3.0±0.5 ml/26.4±2.2 mm nodule, for which five slices were histologically prepared, digitized and annotated by our expert pathologist (Figure 3). The 3D reconstruction algorithm successfully aligned the 2D histology slices resulting in a 3D reconstructed volume (Figure 4). Following the histology reconstruction, the invasive outlines form a smooth continuous 3D structure (blue volume, Figures 4b–c) as a result of the good alignment of the histology slices relative to each in 3D. Note, that the outline of the invasive component was not used to drive the reconstruction, and may be used to qualitatively assesse the alignment of the histology slices in the reconstruction. Similarly, blood vessels were also only outlined in 2D on the histology slices, yet following reconstruction they also appear to form continuous 3D tubular structures (Asterisk in Figure 3), suggesting an accurate 3D reconstruction. Figures 5–6 and Supplementary Movies S1–S2 show axial and sagittal sections of the CT nodule on which the histology reconstruction was mapped. The optimal histology reconstruction was identified as the one with a slice spacing of 3 mm and configuration where the first slice is the bottom-most in the stack. The overlap of the nodule boundaries (blue and green outline) was calculated to be 69.2%. Additionally one may observe substantial overlap between the blood vessels (see arrows in Figures 5–6). The distance between the blood vessels mapped from the histology reconstruction onto CT and the blood vessels annotated directly on CT was found to be 1.42±0.97 mm, again suggesting that accurate radiology-pathology fusion has been achieved.
Figure 5.
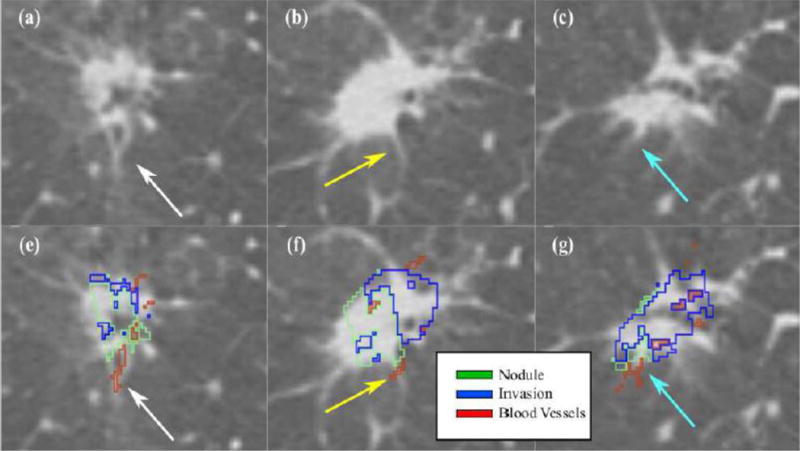
Histology – CT fusion results shown for the same nodule as in Figures 3–4. The arrows point to a corresponding blood vessel mapped from histology onto CT; (a–c) Axial view of slices in the CT reconstruction; (e–f) corresponding mapping of invasive component (blue) and blood vessels (red) onto CT.
Figure 6.
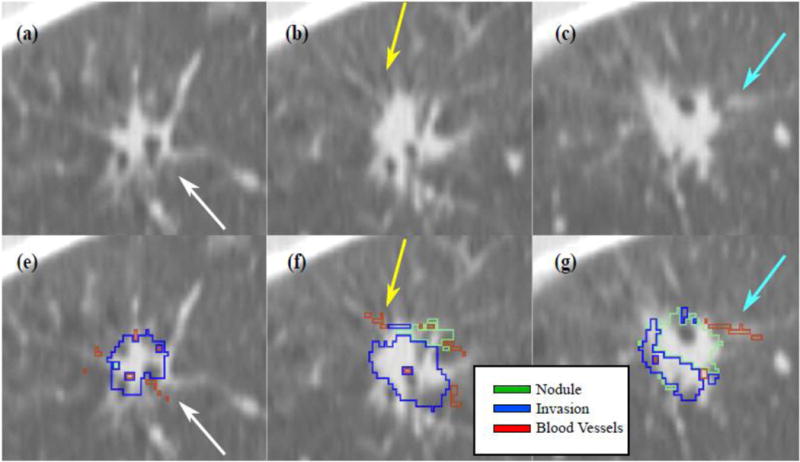
Sagittal view of the histology – CT fusion results (same nodule as in Figures 3–5). The arrows point to a corresponding blood vessel mapped from histology onto CT; (a–c) Sagittal view of slices in the CT reconstruction; (e–f) corresponding mapping of invasive component (blue) and blood vessels (red) onto CT.
Figure 3.
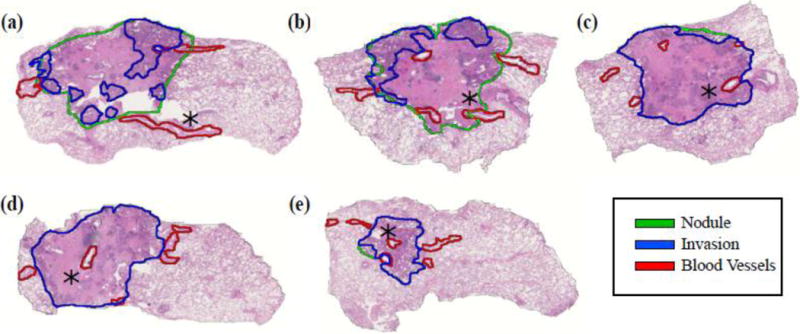
Consecutive histology slices in a 3.0±0.5 ml/26.4±2.2 nodule. The rotation of the slices is optimized to allow for the alignment of the slices relative to each other within the 3D reconstruction. The asterisk points to the same blood vessel visible across multiple histology slices.
Figure 4.
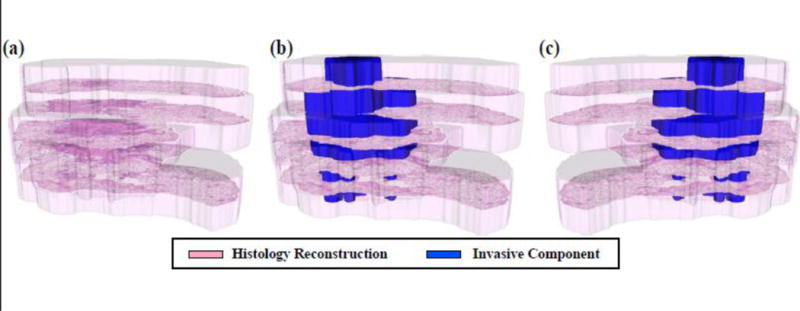
3D histology reconstruction: (a) spatial alignment of the five histology slices within the 3D reconstruction (transparent pink); (b) the histology reconstruction also shows the invasive component (blue); (c) histologic reconstruction where the first slice was assumed to be the top-most slice.
The quantitative evaluation of the fusion approach and the identification of the optimal reconstruction parameters were performed on a total of six nodules (Table 2). The overall average overlap between the 3D histologic reconstruction and the nodule outlined on CT was calculated to be 65.9 ± 5.2 % across the six nodules. The overall deviation of blood vessels was calculated to be 1.97 ± 0.42 mm based on the distance computed between corresponding blood vessels from the ex vivo surgical specimen and the in vivo CT scan.
Table 2.
Quantitative evaluation of the 3D reconstruction of the histology and the corresponding fusion between the 3D histology reconstruction and the CT. The optimal reconstruction parameters are shown along with the performance metrics for blood vessel alignment (Landmark distance) and spatial overlap (Dice).
| Nodule ID | Variables | Landmark Distance (mm, mean±std) | Dice Overlap (%) | |
|---|---|---|---|---|
| Distance Between Slices (mm) | Mirrored | |||
| 1 | 3 | No | 1.75 ± 1.19 | 73.1 |
| 2 | 4 | Yes | 2.15 ± 2.05 | 62.4 |
| 3 | 4 | Yes | 2.02 ± 1.10 | 59.5 |
| 4 | 3 | Yes | 1.81 ± 2.08 | 68.9 |
| 5 | 3 | Yes | 1.42 ± 0.97 | 69.2 |
| 6 | 3 | Yes | 2.67 ± 1.43 | 62.4 |
| Mean ± sd | 1.97 ± 0.42 | 65.9 ± 5.2 | ||
Furthermore, we investigated the robustness of our approach when utilizing the individual rater delineations of the nodule boundary. On average, the resulting mapping of the in situ and invasive adenocarcinoma components is similar to what was obtained via the consensus delineation (Supplementary Table 1). Although small differences exist in the mapping of the invasive and in situ components when using the individual rater delineations compared to the consensus annotation, the differences did not appear to affect the alignment of the blood vessels (Supplementary Figures 2–3). The consensus delineation appeared to show slightly improved Dice overlap measures and blood vessel alignment compared to the individual raters delineations.
Although our proof-of-concept study included only 6 nodules, we compared the distribution of the HU intensity values within the spatially mapped regions of invasive and in situ components on the CT scans. The HU signal intensities associated with the voxels within the region of invasive adenocarcinoma mapped onto the CT showed an average (± standard deviation) of −393 ± 324 HU, with a minimum value of −1024 and maximum attenuation of 413. The CT intensity within the in situ mapped region had an average (± standard deviation) of −433 ± 352 HU, a minimum value of −1024 and a maximum value of 138. Moreover, the CT intensity distribution within the invasive regions were found to be statistically significantly different compared to the corresponding distribution within the in situ regions. Significance was assessed for p values < 0.05 using a Wilcoxon sum-rank test [19]. Our results should be interpreted with care due to the limited number of studies that were available for our study. These preliminary results will clearly need to be independently validated in large population study.
Discussion
In this study, we introduced a fusion methodology that enables the co-registration of sequential histology slices with CT in 3D for resected ground glass nodules. The main goal behind this proof-of-concept study was to carefully map the extent of invasive and in situ disease from histology onto CT, to create disease ground truth and in turn facilitate the identification of imaging features correlated with invasive adenocarcinoma. Our method successfully mapped invasive adenocarcinoma and adenocarcinoma in situ from 2D histology slices onto CT for a total of six different patients. The qualitative and quantitative evaluation of the fusion methodology appeared to suggest that good alignment was achieved between gross structures, e.g. entire nodule, as well as anatomic landmarks, such as blood vessels. Although the inter-rater evaluation showed a Cohen Kappa agreement of 0.68, the consensus annotation allowed us to obtain better nodule and landmark alignment compared to when using the individual annotations. The consensus annotations appear to mitigate the variability that might exist when annotating ground glass nodules.
To assess the validity our fusion approach, we also compared HU intensity values within the spatially mapped regions of invasive and in situ components on the CT scans. Our preliminary comparison indicated statistically significant differences between the HU signal intensities associated with the voxels within the region of invasive adenocarcinoma and adenocarcinoma in situ when comparing across the six nodules included in our proof-of-concept study. A future study with a larger number of nodules is needed to evaluate the extensibility and reproducibility of our approach.
To our knowledge, this is the first radiology-pathology co-registration study of lung nodules where an attempt was made to map the extent of invasion from histology specimens onto CT. In order to avoid the introduction of unnatural elastic deformations in the radiology-pathology co-registration, our approach utilized CT as a spatial constraint during the 3D reconstruction of the histology specimen. Moreover, we implemented a global search and an elastic registration strategy in 3D to account for the large and variable deformations within the sectioned histopathology and the chest CT scans. Our study did however have its limitations. In contrast to previous research studies, e.g. [13, 20] which had the flexibility and resources to closely section histology with small intervals and hence enabling a more accurate 3D reconstruction, our study was reliant on data that had been processed retrospectively via standard clinical protocols. This limited the total number of histology slices available from each nodule to only 3–5. Moreover, little information regard the tissue preparation was available which prompted the need to optimize the distance between slices as well as the order of the slices in the reconstruction. The relatively small number of histology slices available for histology reconstruction may have contributed to the small spatial misalignment observed between the CT and the histopathology images.
Our findings should be interpreted with care due to the reduced number of subjects included in this study. While this proof of concept study showed the utility of the radiology-pathology fusion for spatial mapping of disease extent on to pre-operative imaging data using only routinely and retrospectively acquired clinical data. Additional work will be needed to independently validate the radiology-pathology co-registration approach on a larger set of cases. Moreover, the radiology-pathology co-registration framework needs to be independently validated in a prospective study. A prospective study will allow for careful control of the sectioning of the nodule, carefully slide preparation to mitigate tissue folding artifacts, and potentially employing CT scans that were reconstructed at higher resolutions. We introduced a radiology-pathology fusion methodology that allowed the mapping of invasive and in situ adenocarcinoma from histology specimens onto in vivo CT of ground glass nodules. Our methodology revealed some differences in Hounsfield units (HU) between the regions of invasive adenocarcinoma and adenocarcinoma in situ mapped onto the CT from the ex vivo histopathology in this proof-of-concept study. The presented approach may enable the identification and validation of radiomic imaging signatures for in situ and invasive disease on lung CT in turn potentially paving the way for non-invasive disease characterization. This might have implications for possibly reducing the number of surgical resections and biopsies needed to confirm the presence of invasive adenocarcinoma.
Supplementary Material
Key Points.
3D reconstructions are generated from 2D histology specimens of ground glass nodules
The reconstruction methodology used pre-operative in vivo CT as 3D spatial constraint
The methodology maps adenocarcinoma extent from digitized histology onto in vivo CT
The methodology potentially facilitates the discovery of CT signature of invasive adenocarcinoma.
Methodology.
retrospective
experimental
performed at one institution
Acknowledgments
Funding:
This study has received funding by the US Department of Defense (W81XWH-13-1-0487), US National Institutes of Health (R21CA167811-01, R21CA179327-01, R21CA19515201, U24CA199374-01), the US National Institute of Diabetes and Digestive and Kidney Diseases (R01DK098503-02), the US Department of Defense Prostate Cancer Synergistic Idea Development Award (PC120857); the US Department of Defense Lung Cancer Idea Development Award; the US, Ohio Third Frontier Technology development Grant, the Case Comprehensive Cancer Center Pilot Grant, the VelaSano Grant from the Cleveland Clinic, Ohio, US the Wallace H. Coulter Foundation Program in the Department of Biomedical Engineering at Case Western Reserve University, Ohio, US.
Abbreviations
- 2D
two dimensional
- 3D
three dimensional
- HU
Hounsfield units
- mm
millimeter
- ml
milliliters
- msec
millisecond
- mAs
miliampere second
- mSV
milisieverts
Footnotes
Compliance with ethical standards:
Guarantor:
The scientific guarantor of this publication is Mirabela Rusu
Conflict of interest:
The authors of this manuscript declare relationships with the following companies: GE Global Research, Elucid Bioimaging and Inspirata Inc.
Statistics and biometry:
One of the authors has significant statistical expertise.
Ethical approval:
Institutional Review Board approval was obtained.
Informed consent:
Written informed consent was waived by the Institutional Review Board.
References
- 1.Yanagawa Naoki, Shiono Satoshi, Abiko Masami, Ogata Shin-ya, Sato Toru, Tamura Gen. New IASLC/ATS/ERS classification and invasive tumor size are predictive of disease recurrence in stage I lung adenocarcinoma. J Thorac Oncol. 2013;8(5):612–618. doi: 10.1097/JTO.0b013e318287c3eb. [DOI] [PubMed] [Google Scholar]
- 2.Godoy Myrna CB, Naidich David P. Subsolid pulmonary nodules and the spectrum of peripheral adenocarcinomas of the lung: recommended interim guidelines for assessment and management. Radiology. 2009;253(3):606–622. doi: 10.1148/radiol.2533090179. [DOI] [PubMed] [Google Scholar]
- 3.Van Schil Paul E, Sihoe Alan DL, Travis William D. Pathologic classification of adenocarcinoma of lung. J Surg Oncol. 2013;108(5):320–326. doi: 10.1002/jso.23397. [DOI] [PubMed] [Google Scholar]
- 4.Borczuk Alain C, Qian Fang, Kazeros Angeliki, Eleazar Jennifer, Assaad Adel, Sonett Joshua R, Ginsburg Mark, Gorenstein Lyall, Powell Charles A. Invasive size is an independent predictor of survival in pulmonary adenocarcinoma. Am J Surg Pathol. 2009;33(3):462–469. doi: 10.1097/PAS.0b013e318190157c. [DOI] [PMC free article] [PubMed] [Google Scholar]
- 5.Xiang Wenjing, Xing Yanfen, Jiang Sen, Chen Gang, Mao Haixia, Labh Kanchan, Jia Xiaoli, Sun Xiwen. Morphological factors differentiating between early lung adenocarcinomas appearing as pure ground-glass nodules measuring 10 mm on thin-section computed tomography. Cancer Imaging. 2014;14:33. doi: 10.1186/s40644-014-0033-x. [DOI] [PMC free article] [PubMed] [Google Scholar]
- 6.Lee Sang Min, Park Chang Min, Goo Jin Mo, Lee Hyun-Ju, Wi Jae Yeon, Kang Chang Hyun. Invasive pulmonary adenocarcinomas versus preinvasive lesions appearing as ground-glass nodules: differentiation by using CT features. Radiology. 2013;268(1):265–273. doi: 10.1148/radiol.13120949. [DOI] [PubMed] [Google Scholar]
- 7.Chae Hee-Dong, Park Chang Min, Park Sang Joon, Lee Sang Min, Kim Kwang Gi, Goo Jin Mo. Computerized texture analysis of persistent part-solid ground-glass nodules: differentiation of preinvasive lesions from invasive pulmonary adenocarcinomas. Radiology. 2014;273(1):285–293. doi: 10.1148/radiol.14132187. [DOI] [PubMed] [Google Scholar]
- 8.Orooji M, Rusu M, Rajiah P, Yang M, Jacono F, Gilkeson RC, Linden PA, Madabhushi A. Computer Extracted Texture Features on CT Predict Level of Invasion in Ground Glass Non-Small Cell Lung Nodules. Radiology Society of North America, Annual Meeting Proceedings. 2014 [Google Scholar]
- 9.Son Ji Ye, Lee Ho Yun, Lee Kyung Soo, Kim Jae-Hun, Han Joungho, Jeong Ji Yun, Kwon O Jung, Shim Young Mog. Quantitative CT analysis of pulmonary ground-glass opacity nodules for the distinction of invasive adenocarcinoma from pre-invasive or minimally invasive adenocarcinoma. PLOS One. 2014;9(8):e104066. doi: 10.1371/journal.pone.0104066. [DOI] [PMC free article] [PubMed] [Google Scholar]
- 10.Chappelow J, Bloch BN, Rofsky N, Genega E, Lenkinski R, DeWolf W, Madabhushi A. Elastic registration of multimodal prostate MRI and histology via multiattribute combined mutual information. Med Phys. 2011;38(4):2005–18. doi: 10.1118/1.3560879. [DOI] [PMC free article] [PubMed] [Google Scholar]
- 11.Ward AD, Crukley C, McKenzie CA, Montreuil J, Gibson E, Romagnoli C, Gomez JA, Moussa M, Chin J, Bauman G, Fenster A. Prostate: Registration of Digital Histopathologic Images to in Vivo MR Images Acquired by Using Endorectal Receive Coil. Radiology. 2012;263(3):856–864. doi: 10.1148/radiol.12102294. [DOI] [PubMed] [Google Scholar]
- 12.Rusu Mirabela, Golden Thea, Wang Haibo, Gow Andrew, Madabhushi Anant. Framework for 3D histologic reconstruction and fusion with in vivo MRI: Preliminary results of characterizing pulmonary inflammation in a mouse model. Med Phys. 2015;42(8):4822–4832. doi: 10.1118/1.4923161. [DOI] [PMC free article] [PubMed] [Google Scholar]
- 13.Onozato Maristela L, Klepeis Veronica E, Yagi Yukako, Mino-Kenudson Mari. A role of three-dimensional (3D)-reconstruction in the classification of lung adenocarcinoma. Anal Cell Pathol. 2012;35(2):79–84. doi: 10.3233/ACP-2011-0030. [DOI] [PMC free article] [PubMed] [Google Scholar]
- 14.Litzlbauer Horst Detlef, Neuhaeuser Christoph, Moell Alexander, Greschus Susanne, Breithecker Andreas, Franke Folker Ernst, Kummer Wolfgang, Rau Wigbert Stephan. Three-dimensional imaging and morphometric analysis of alveolar tissue from microfocal X-ray-computed tomography. Am J Physiol Lung Cell Mol Physiol. 2006;291(3):L535–L545. doi: 10.1152/ajplung.00088.2005. [DOI] [PubMed] [Google Scholar]
- 15.Pieper S, Halle M, Kikinis R. 3D Slicer. IEEE Int Sym on Biomed Imaging. 2004;04:632–635. [Google Scholar]
- 16.Cohen J. A coefficient of agreement for nominal scales. Educational and psychological measurement. 1960;20(1):37–46. [Google Scholar]
- 17.Travis William D, Brambilla Elisabeth, Noguchi Masayuki, Nicholson Andrew G, Geisinger Kim, Yatabe Yasushi, Powell Charles A, Beer David, Riely Greg, Garg Kavita, Austin John HM, Rusch Valerie W, Hirsch Fred R, Jett James, Yang Pan-Chyr, Gould Michael, American Thoracic Society International Association for the Study of Lung Cancer/American Thoracic Society/European Respiratory Society: international multidisciplinary classification of lung adenocarcinoma: executive summary. Proc Am Thorac Soc. 2011;8(5):381–385. doi: 10.1513/pats.201107-042ST. [DOI] [PubMed] [Google Scholar]
- 18.Klein S, Staring M, Murphy K, Viergever MA, Pluim JPW. Elastix: a toolbox for intensity-based medical image registration. IEEE Trans Pattern Anal Mach Intell. 2010;29(1):196–205. doi: 10.1109/TMI.2009.2035616. [DOI] [PubMed] [Google Scholar]
- 19.Wilcoxon Frank. Individual comparisons by ranking methods. Biometrics Bulletin. 1945;1(6):80–83. [Google Scholar]
- 20.Lotz J, Berger J, Müller B, Breuhahn K, Grabe N, Heldmann S, Homeyer B, Lahrmann A, Laue H, Olesch J, Schwier M, Sedlaczek O, Warth A. Zooming in: high resolution 3D reconstruction of differently stained histological whole slide images. SPIE Medical Imaging. 2014:904104-1–904104-7. [Google Scholar]
Associated Data
This section collects any data citations, data availability statements, or supplementary materials included in this article.


