Abstract
A quantitative immunochromatographic assay (QIA) was developed by using gold nanoparticle (GNP)-based lateral flow strip biosensor (LFSB) and a portable strip reader for rapid and sensitive quantitation of Carbohydrate Antigen 19-9 (CA 19-9) in human plasma. CA 19-9 is a biomarker that has been associated with cancers (such as pancreatic and colorectal cancers) and various non-cancerous diseases. The principle is based on sandwich-type immunoreactions between gold nanoparticle (GNP)-labelled detection antibody, anti-CA 19-9 capture antibody and CA 19-9to capture the GNPs on the test zone of LFSB. The accumulation of GNPs on the test zone gave a red line whose intensity was read with a portable strip reader to quantify the concentration of CA 19-9. Assay parameters including the membrane type, antibody concentration, amount of GNP-anti-CA 19-9 conjugates and the components of the running buffer were optimized to obtain the best sensitivity and reproducibility of the assay. The detection limit of the assay was determined to be 5 U mL−1 (S/N=3) with a linear range of 5 U mL−1 to 100 U mL−1. CA 19-9 concentrations in healthy human and pancreatic cancer patient plasma samples were successfully evaluated using the developed quantitative immunochromatographic assay (QIA), and the results were in accordance with that obtained with enzyme linked immunosorbent assay (ELISA). The developed assay shows great promise for clinical application and biomedical diagnosis, particularly in limited resource settings.
Keywords: Lateral flow, biosensor, Gold nanoparticle, CA 19-9, quantitative, immunochromatographic
Graphical abstract
A quantitative immunochromatographic assay was developed by using gold nanoparticle-based lateral flow strip biosensor and a portable strip reader for rapid and sensitive quantitation of Carbohydrate Antigen 19-9 (CA 19-9) in healthy human and pancreatic cancer patient plasma.

1. Introduction
Changes in the levels of various biochemical molecules have been known to be associated with diseased conditions for years. These molecules are termed biomarkers and represent a very diverse group of molecules including proteins (enzyme, antibodies, cell surface receptors, secreted proteins), nucleic acids (DNA, microRNAs), carbohydrates, peptides and other molecules [1]. In cancer research, biomarkers are used for disease diagnosis, monitoring patient response to therapy, post-operative monitoring, progression of disease condition and disease recurrence [1,2]–7]. Carbohydrate antigen sialyl Lewis commonly denoted as CA 19-9, is a cancer biomarker that was first isolated in 1979 by Koprowski and coworkers from colorectal carcinoma and later from pancreatic carcinoma [3,4]. CA 19-9 is the main tumor biomarker for digestive tract associated cancers [5–7]. The highest CA 19-9 expression has been reported to occur in pancreatic cancer [8]. CA 19-9 is also associated with other digestive tract cancers, including stomach and bile cancer. Others like breast, lung, and ovarian cancers have also been reported to be associated elevated with CA 19-9 [9, 10]. Elevated CA 19-9 has also been linked with non-cancerous conditions such as pancreatitis, bile inflammation, cirrhosis and obstructive jaundice disease [9, 10]. Despite its low specificity, CA 19-9 currently remains the only U.S. Food and Drug Administration (FDA) approved biomarker for pancreatic cancer and is the most accurate single biomarker for pancreatic cancer [11]. Pancreatic cancer is one of the deadliest cancers with a yearly diagnosis rate close to its annual mortality rate [12]. Hence, sensitive and specific determination of low levels of CA 19-9 in biological fluids would be advantageous in clinical diagnosis, prognosis and monitoring of pancreatic cancer patient response to therapy.
A variety of strategies and techniques have been developed to detect CA 19-9. Most of these assays utilize CA 19-9 monoclonal antibody 1116-NS-19-9 clone as a specific probe to recognize CA 19-9 [9]. One of the first CA 19-9 assays developed was a radioimmunoassay reported in 1983 [13]. Since then there have been reports of enzyme linked immunosorbent, photoelectrochemical, fluorescent and electrochemical assays for detection of CA 19-9 [14–16]. There are also reports of CA 19-9 detection using Surface Plasmon Resonance (SPR) and Raman Spectroscopy [17,18]. Though most of these methods have provided acceptable detection limits and specificities to CA 19-9, there remains drawbacks such as the use of radioactive materials, extensive sample preparations and wash steps, enzyme reactions, long assay times and the requirement for technical expertise, as well as expensive and specialized instrumentation.
Immunochromatographic assay (IA), also named lateral flow immunoassay (LFI), is a point-of-care approach, which overcomes the drawbacks of traditional immunoassays. Lateral flow assays have been used for the detection of various targets ranging from proteins and nucleic acids to other small molecules [19–29]. Various nanoparticles (eg. GNPs, quantum dots, silver nanoparticles among others) have been used in lateral flow assays with varying degrees of sensitivity. GNPs are however the gold standard for lateral flow assays due to their stability, ease of preparation and low cost. The surface plasmon property of GNPs gives them intense size dependent coloration, which makes them highly desirable for LFSB applications. The color of GNPs enables naked eye detection of analyte on LFSBs. GNPs have shown great versatility for use in the analysis of complex matrixes including food, water and clinical samples (eg. plasma, serum) [19,21 –29]. Traditional IA and LFI are qualitative (Yes/No) or semi-quantitative assays. Recently, our group and others have developed quantitative LFSBs for rapid and sensitive detection of various analytes [20–23,26–29]. In this work, a quantitative immunochromatographic assay (QIA) was developed using a GNP-based LFSB and a portable strip reader for the rapid and sensitive detection of CA 19-9 in human plasma. This has the advantages of being rapid, sensitive and low cost as compared to the conventional CA19-9 immunoassays and immunosensors.
2. Experimental section
2.1 Apparatus
Biojet BJQ 3000 dispenser, Clamshell Laminator, and the Guillotine cutting module CM 4000 manufactured by Biodot LTD (Irvine, CA, USA) were used to prepare lateral flow strip biosensors. Portable test strip reader (DT2032) was purchased from Shanghai Goldbio Tech. Co., LTD (Shanghai, China)
2.2 Materials
Gold chloride trihydrate (HAuCl4), trisodium citrate, sodium deodocylsulfate (SDS), sodium chloride (NaCl), Tween 20, sucrose, trisodium phosphate (Na3PO4), hexadecyltrimethylammonium bromide (CTAB), trizma hydrochloride (Tris-HCl, pH=8.0), phosphate buffered saline (PBS, pH=7.4, 0.01M), PBS with 0.05% Tween-20 (PBST, pH=7.4), bovine serum antigen (BSA) and immunoglobulin (IgG) from human plasma were obtained from Sigma Aldrich (St. Louis, MO, USA). Nitrocellulose membranes (HFC090MC100, HFC180MC100, HFC240MC100), glass fiber (GFCP000800) and fiber pads were (CFSP001700) obtained from Millipore (Billerica, MA, USA).
Native CA 19-9 protein (30-AC14) and mouse anti-CA19-9 antibodies with catalogue numbers of 10-CA19A and 10-CA19B were purchased from Fitzgerald Industries International (Acton, MA, USA). The anti-CA 19-9 antibodies were designated as anti-CA 19-9 AbA and anti-CA 19-9 AbB, respectively. Human mammaglobin was purchased from Creative BioMart (Shirley, NY, USA). CA 19-9 ELISA kit (EHCA 19-9) and goat anti-mouse IgG (A16092) was purchased from Thermofisher Scientific (Waltham, MA, USA). Healthy human plasma samples were purchased from Golden West Biologicals, Inc. (Temecula, CA, USA). Blood sample from pancreatic cancer patient was provided by Sanford Clinic (Fargo, ND, USA, IRB#: SM17227). All reagents used were analytical grade chemicals. All solutions used in the study were prepared in ultrapure (>18 MΩ) water made from Milli-Q water purification system by Millipore (Billerica, MA, USA).
2.3 Preparation of GNP and GNP- Anti CA 19-9 AbA conjugates
GNPs with typical diameters averaging 13 nm ± 3.5 nm were prepared as previously reported [21, 30]. Briefly, glassware used for the preparation of the GNPs were soaked with aqua regia (3:1; HCl:HNO3) followed by thorough washing with distilled water. Fifty microliters of 50% w/v HAuCl4 was added to 250 mL ultrapure water in glassware. The mixture was heated and brought to boil under vigorous stirring. Sodium citrate solution was added and mixture was left to boil until the characteristic red color of GNPs was observed. The solution was boiled for an additional 10 minutes. Prepared GNP solution was cooled down to room temperature (RT) and stored at 4°C until further used.
GNP-Anti CA 19-9 AbA conjugates were prepared by incubating anti-CA19-9A AbA at a concentration of 75 μg in 1 ml of 5-fold concentrated GNPs at pH=9. The mixture was incubated at RT for 1 hour on shaker at low speed. After which 10% BSA solution was added to a final concentration of 1%. The mixture was further incubated for 1 hour with gentle mixing. The mixture was then centrifuged at 12,000 rpm for 15minutes at 4°C. The supernatant containing excess antibodies was discarded and pelleted GNP-Anti CA19-9 AbA conjugate was resuspended in PBS containing 1% BSA to wash it. The washing was repeated twice and conjugate was finally suspended in a buffer containing 20 mM sodium phosphate, 0.25 % Tween-20, 10 % sucrose and 5 % BSA. Prepared conjugates were stored at 4°C until used.
2.4 Preparation of CA19-9 lateral flow strip biosensors
The setup for the developed GNP-based LFSB is as pictured in Fig. 1. The biosensor was composed of a sample pad, conjugate pad, nitrocellulose membrane and an absorption pad all immobilized on a sticky backing layer. The sample pad was a cellulose fiber pad (17 mm × 300 mm) and pretreated with a buffer (0.05 M Tris-HCl + 0.25% Triton X−100 + 0.15 mM NaCl, pH 8.0) for 1 hr after which it was dried at 37°C and stored in a desiccator at RT until used. The conjugate pad was a glassy fiber membrane on which the GNP-Anti-CA19-9 AbA conjugate was dispensed on before an assay. The test and control lines of LFSB, which were 3 mm apart, were prepared by dispensing anti-CA19-9 AbB (0.5 mg mL−1) and goat anti-mouse IgG (1 mg mL−1) respectively onto the nitrocellulose membrane (25 mm ×x 300 mm). The nitrocellulose membrane was dried at 37°C for 1 hr and subsequently kept at 4°C until used. The absorption pad was a cellulose pad with dimensions 17mm × 300mm. All components were assembled onto a 60 mm × 300 mm adhesive plastic layer with a clamshell laminator. To ensure the continuous migration of solution along the LFSB, the components were overlapped by 2 mm. The assembly was then cut down to strips with 3 mm width using a Guillotine cutting module CM 4000.
Fig. 1.
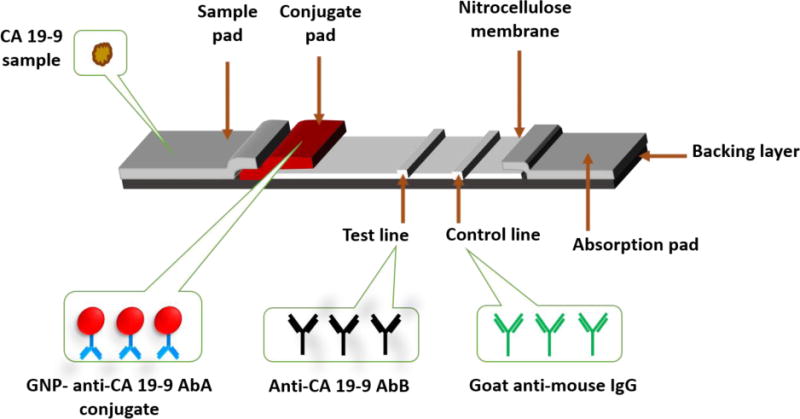
Configuration of the gold nanoparticle-based lateral flow strip biosensor for the detection of CA 19-9.
2.5 Assay Procedure
One hundred microliters of CA 19-9 sample solution prepared in running buffer (PBS + 1% BSA + 0.5 mM CTAB) was applied to the sample pad of the developed LFSB. The solution could travel through the membranes in 15 minutes. An extra 100 μL of running buffer was added to wash the test strip. The washing step removes any nonspecifically adsorbed conjugates and thus reduces background signal. The test results could be read visually with the naked eye after 5minutes. To get quantitative data, the intensities of the test and control lines were read with portable test strip reader. Human plasma samples were tested with a similar procedure as above. Prior to testing, plasma was diluted 2-fold with a PBS buffer containing 2% BSA and 1% CTAB. Plasma sample of pancreatic cancer patient was prepared by spinning the blood sample in an EP tube at 3000 g for 10 minutes and collecting the supernatant.
3. Results and discussion
3.1 Principle of the quantitative immunochromatographic assay (QIA) of CA 19-9
Figure 2 illustrates the principle of QIA for the detection of CA 19-9. Anti-CA 19-9 AbB and goat anti-mouse IgG antibody were pre-immobilized on the nitrocellulose membrane to form the test line and control line, respectively. Anti-CA 19-9 AbA was used as detection antibody immobilized on the GNP surface and GNP-anti-CA 19-9 AbA conjugate was dispensed on the conjugate pad. Sample solution containing CA 19-9 is applied on the sample application pad. The solution migrates by capillary action, and upon reaching the conjugate pad, rehydrates the GNP-anti-CA 19-9 AbA conjugates. An immune-complex (GNP-anti-CA 19-9 AbA-CA 19-9) is formed between the CA 19-9 and anti-CA 19-9 AbA of the GNP-anti-CA 19-9-AbA conjugates, and continues to migrate along the strip. The complex is captured on the test zone through the second immunoreaction between CA 19-9 and the immobilized anti-CA 19-9 AbB. The accumulation of GNPs in the test zone is visualized as a characteristic red band. (Fig. 2a). The excess of GNP-anti CA 19-9 AbA conjugates continue to migrate and are captured on the control zone by the immuno events between goat anti-rabbit IgG and anti-CA 19-9 AbA, thus forming a second red band (Fig. 2a). In the absence of CA 19-9, no red band is observed in the test zone. In this case, a red band (control line) shows that the LFSB works well (Fig. 2b). The strips are observed with the naked eye for qualitative analysis. Quantitative analysis is performed by reading the optical intensity of the test line and control line with a portable strip reader (Fig. 2c). The strip reader connects with a laptop, which has an installed software that transduces the line intensities into characteristic peaks. The peak area on the computer monitor is proportional to the number of GNPs captured on the test line, which is proportional to the concentration of CA 19-9 in the sample solution.
Fig. 2.
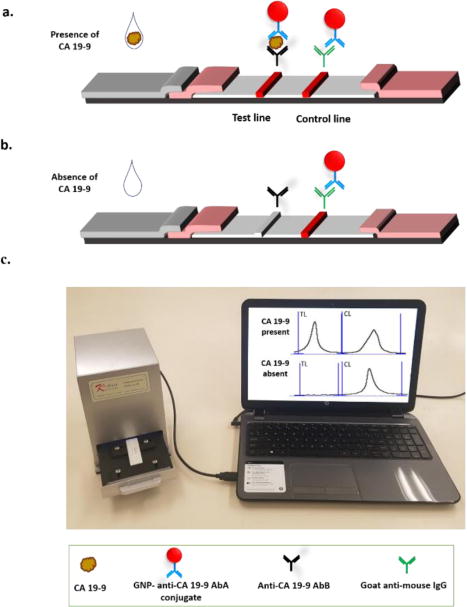
Principle of quantitative immunochromatographic assay of CA 19-9. (a) Capture of gold nanoparticles on the test line and control line in the presence of CA 19-9. (b) Capture of gold nanoparticles on the control line in the absence of CA 19-9. (c) Measuring the intensities of test line and control line with a portable strip reader connected to a laptop computer.
3.2 Optimization of experimental parameters
Assay parameters including the membrane type, antibody concentration, amount of GNP-anti-CA 19-9 conjugates and the components of the running buffer were optimized to obtain the best sensitivity and reproducibility of the assay. The flow rate of sample solution on the nitrocellulose membrane dictated the time frame within which CA 19-9 interacted with the antibodies on the GNP surface, test line and control line. Three membranes HF090MC100, HF180MC100 and HF240MC100 with flow time of 90, 180 and 240 seconds (sec) as reported by the manufacturer were evaluated for their performance in the LFSB. From Fig. 3a, it is observed that the 90sec membrane had the highest signal to noise (S/N) ratio. Although the 180 sec and 240 sec membranes increased the immunoreaction time, it led to high background signal and hence lowering the S/N ratios. Therefore, the 90sec membrane was chosen to prepare the LFSBs.
Fig. 3.
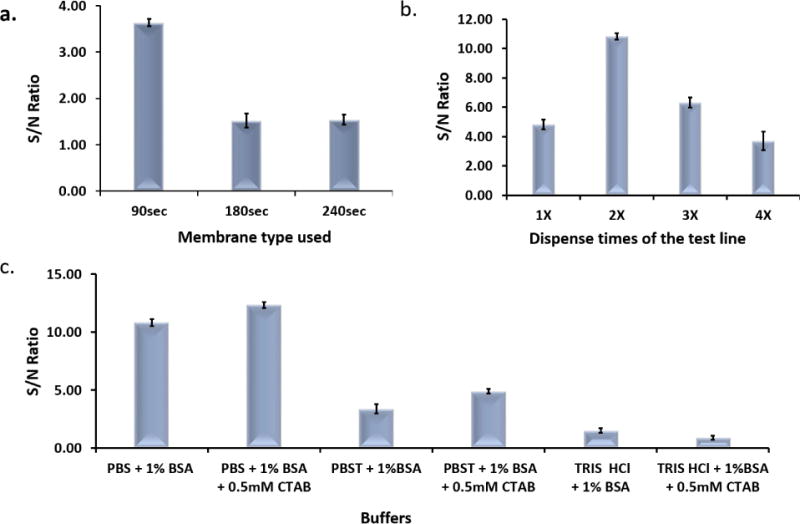
(a)Effect of different types of nitrocellulose membranes on the S/N ratio of the assay; (b): Effect of the dispensing times of Anti-CA 19-9 AbB on the S/N ratio of the assay; (c): Effect of buffer components on the S/N ratio of the assay.
The signal of the LFSB was affected by the amount of anti-CA 19-9-AbB immobilized on the test zone, which needed to be sufficient to generate the test band with a minimum nonspecific adsorption. The anti-CA 19-9 AbB solution was dispensed on the test zone with different dispensing times and the S/N ratios of the LFSBs were compared. As shown in Fig. 3b, the highest S/N ratio of the LFSB was obtained when the dispensing times was 2. At dispense times of 3 and 4, the S/N ratio reduced. This is most likely the result of increased non-specific interaction at high concentration of antibody as well as steric hindrance as previously described [36]. Therefore, the dispensing times of 2 was used to prepare the LFSB.
The composition of running buffer has a substantial influence on the performance of the LFSB. Various buffers including PBS + 1% BSA, PBS + 1% BSA + 0.5 mM CTAB, PBST + 1% BSA, PBST + 1% BSA + 0.5 mM CTAB, Tris-HCl + 1% BSA and Tris-HCl + 1% BSA + 0.5 mM CTAB were tested. It was observed that the highest S/N ratio was obtained with PBS+1% BSA+0.5 mM CTAB (Fig. 3c), which was therefore used as running buffer for subsequent experiments.
The amount of anti-CA 19-9 AbA used to prepare GNP-anti-CA 19-9 AbA conjugates played a key role in the sensitivity of the assay. Various concentrations of anti-CA 19-9 AbA were used to prepare the conjugates and the S/N ratios of LFSBs were compared (Fig. 4a). From the graph, low S/N ratios of LFSBs were obtained with low concentrations of antibody. The reason could be low coating density of antibody on the GNP surface, which reduced the efficiency of immunoreactions during the assay. Beyond 75 μg of antibodies for conjugate preparation, there was a reduction in the S/N ratio of the assay. The low S/N ratio at higher concentrations could be attributed to overcrowding of the antibodies on the surface of the GNP thus reducing accessibility to bind target CA 19-9. As shown in the Fig. 4a, 75 μg of anti-CA 19-9 AbA gave the highest S/N ratio and was thus chosen for subsequent assays.
Fig. 4.
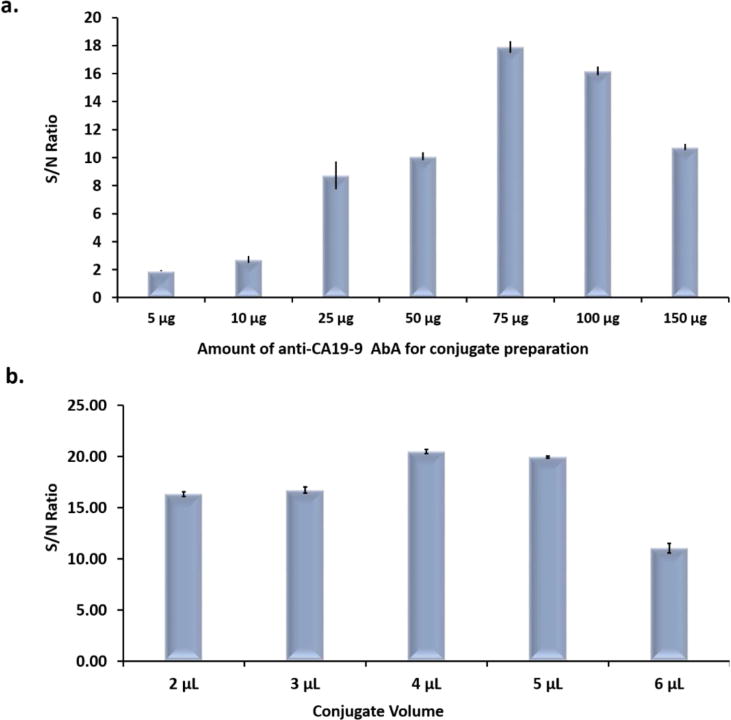
(a) Effect of the amount of Anti- CA 19-9 AbA used for conjugate preparation on the S/N of the assay; (b) Effect of the conjugate volume on the S/N ratio of the assay.
The amount of GNP-anti-CA 19-9 AbA conjugate dispensed on the conjugate pad was also optimized to obtain the best sensitivity of the assay. Different volumes of GNP-anti CA 19-9 AbA were loaded on the conjugate pad and the S/N ratios of the assay were compared. As presented in Fig. 4b, the S/N ratio peaked at 4 μL, after which the S/N ratio reduced. Beyond 4 μL of conjugate, there was increased background signal due to increased nonspecific adsorption thus reducing the S/N ratios. A conjugate volume of 4 μL was adopted for further assay development.
3.3 Analytical performance
Under the optimized experimental conditions, the GNP-based LFSBs were used to detect different concentrations of CA 19-9. Sample solutions were prepared by diluting the CA 19-9 stock solution in running buffer. All tests were run in triplicates. Fig. 5 presents the typical photo images of the LFSBs with increasing concentrations (0 to 100 U mL−1). As expected, the intensities of the test-lines increased with increasing concentrations of CA 19-9. No test line was observed on the test zone of LFSB in the absence of CA 19-9 (control), indicating negligible nonspecific adsorption. The test line was still observed at 5 U mL−1 of CA 19-9, which was used as a threshold for visual detection limit of CA 19-9 without instrumentation. All LFSBs showed the red control-line, which was a validation of the proper performance of the developed LFSBs. Quantitative detection was obtained by reading the intensity of the test line with the aid of a portable strip reader. The peak areas increased with the increasing intensity of the lines, and thus correlated with increasing CA 19-9 concentrations. The resulting calibration curve (Fig. S1) was plotted using the peak areas versus CA 19-9 concentration yielding a linear dynamic range between 5 and 100 U mL−1(R2=0.9927, y= 3.274x + 22.615). The limit of detection of the assay (S/N =3) was determined to be 5 U mL−1. Aside the low detection limit achieved, the developed LFSB showed good reproducibility. Six replicate tests were performed in the absence and presence of 30 U mL−1 of CA 19-9. The relative standard deviation of testing 0 U mL−1 and 30 U mL−1 are 2.1% and 3.2%, respectively (data not shown). The selectivity of the assay was studied by testing a series of probable interferences including CEA, human IgG and mammaglobin. As shown in Fig. 6, a high response is observed when 30 U mL−1 CA 19-9 was tested, whereas the negligible signals were obtained from other proteins with concentrations of 100 ng mL−1, indicating the excellent specificity of the assay.
Fig. 5.

Photo images of LFSBs in the presence of different concentrations of CA 19-9.
Fig. 6.
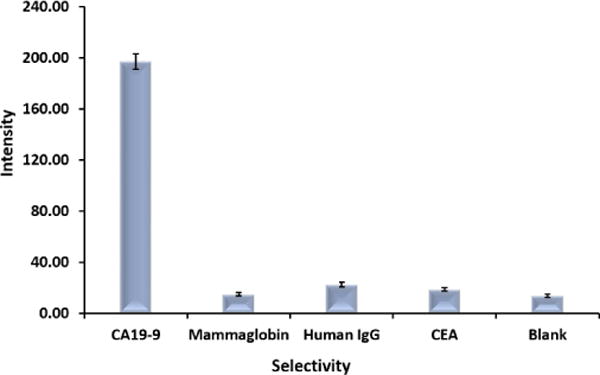
Selectivity of the developed GNP-based LFSB (concentration of CA 19-9 was 50 U mL−1, Mammaglobin, Human IgG and CEA were at 100 ng mL−1).
3.4 Detection of CA 19-9 in healthy human plasma and pancreatic cancer patient plasma
The developed assay was used to detect the concentrations of CA 19-9 in healthy human plasma and pancreatic cancer patient plasma samples. Three plasma samples from healthy human and one plasma sample from pancreatic cancer patient were tested, and the results were validated with commercially available ELISA kit. Plasma samples from healthy humans were purchased from Golden West Biologicals, Inc. (Temecula, CA). Blood sample from a pancreatic cancer patient was provided by Sanford Clinic. Plasma of pancreatic cancer patient was prepared by spinning the blood sample in an EP tube at 3000 g for 10 min and collecting the supernatant. Plasma (50 μL) was diluted two-fold in a buffer containing PBS+2% BSA+1% CTAB before the test. Table 1 shows the results from the developed QIA and ELISA. One can see that the analytical results of the QIA are in good agreement with the results obtained from ELISA, indicating that the QIA had good reliability for quantifying CA 19-9 concentrations in clinic samples.
Table 1.
Screening of plasma samples from healthy human and pancreatic cancer patient with the developed QIA and commercial ELISA kit.
| Plasma sample | This assay(QIA) | Commercial ELISA |
|---|---|---|
| Healthy human plasma sample 1 | 12.67 ± 0.38 | 11.88 ± 0.75 |
| Healthy human plasma sample 2 | 30.76 ± 1.21 | 32.13 ± 1.62 |
| Healthy human plasma sample 3 | 0 | 0 |
| Pancreatic cancer patient sample | 97.03 ± 0.67 | 95.72 ± 1.01 |
4. Conclusion
A quantitative immunochromatographic assay was developed by using GNP-based lateral flow strip biosensor and a portable reader for the rapid and sensitive detection of CA 19-9. The assay was successfully applied to quantitate CA 19-9 concentrations in healthy human plasma and pancreatic cancer patient plasma samples. The detection limit of 5 U mL−1 achieved is sufficiently sensitive for clinical screening of CA 19-9 in plasma as the reported reference value of CA 19-9 in healthy human plasma is 37 U mL−1 [18]. The developed assay provides a simple, rapid and inexpensive method to detect CA 19-9 in human plasma, showing great promise for clinical application and biomedical diagnosis, particularly in limited resource settings.
Highlights.
a quantitative immunochromatographic assay was developed for rapid, low-cost and sensitive quantitation of CA 19-9 in human plasma.
The assay was applied to detect CA 19-9 in healthy and pancreatic cancer patient plasma with satisfied results.
Acknowledgments
This research was supported by the National Institute of Health, Centers of Biomedical Research Excellent (NIH, COBRE, Grant number: 1P20 GM109024). Its contents are solely the responsibility of the authors, and do not necessarily represent the official views of the NIH.
Footnotes
Publisher's Disclaimer: This is a PDF file of an unedited manuscript that has been accepted for publication. As a service to our customers we are providing this early version of the manuscript. The manuscript will undergo copyediting, typesetting, and review of the resulting proof before it is published in its final citable form. Please note that during the production process errors may be discovered which could affect the content, and all legal disclaimers that apply to the journal pertain.
References
- 1.Henry NL, Hayes D. Cancer biomarkers. Mol Oncol. 2012;6:140–146. doi: 10.1016/j.molonc.2012.01.010. [DOI] [PMC free article] [PubMed] [Google Scholar]
- 2.Kondo N, Murakami Y, Uemura K, Hayashidani Y, Sudo T, Hashimoto Y, Nakashima A, Sakabe R, Shigemoto N, Kato Y, Ohge H, Sueda T. Prognostic impact of perioperative serum CA 19-9 levels in patients with resectable pancreatic cancer. Ann Surg Oncol. 2010;17:2321–2329. doi: 10.1245/s10434-010-1033-0. [DOI] [PubMed] [Google Scholar]
- 3.Koprowski H, Herlyn M, Steplewski Z, Sears HF. Specific antigen in serum of patients with colon carcinoma. Science. 1981;212:53–55. doi: 10.1126/science.6163212. [DOI] [PubMed] [Google Scholar]
- 4.Koprowski H, Steplewski Z, Mitchell K, Herlyn M, Herlyn D, Fuhrer P. Colorectal carcinoma antigens detected by hybridoma antibodies. Somatic Cell Genet. 1979;5:957–971. doi: 10.1007/BF01542654. [DOI] [PubMed] [Google Scholar]
- 5.Magnani JL, Nilsson B, Brockhaus M, Zopf D, Steplewski Z, Koprowski H, Ginsbeurg V. A monoclonal antibody-defined antigen associated with gastrointestinal cancer is a ganglioside containing sialylated lacto-Nfucopentose II. J Biol Chem. 1982;257:14365–14369. [PubMed] [Google Scholar]
- 6.Magnani JL, Steplewski Z, Koprowski H, Ginsburg V. Identification of the gastrointestinal and pancreatic cancer-associated antigen detected by monoclonal antibody 19-9 in the sera of patients as a mucin. Cancer Res. 1983;43:5489–5492. [PubMed] [Google Scholar]
- 7.Kannagi R, Fukushi Y, Tachikawa T, Noda A, Shin S, Shigeta K, Hiraiwa N, Fukuda Y, Inamoto T, Hakomori S, Imura H. Quantitative and qualitative characterization of cancer-associated serum glycoprotein antigens expressing fucosyl or sialosyl-fucosyl type 2 chain polylactosamine. Cancer Res. 1986;46:2619–2626. [PubMed] [Google Scholar]
- 8.Chung YS, Ho JJ, Kim YS, Tanaka H, Nakata B, Hiura A, Motoyoshi H, Satake K, Umeyama K. The detection of human pancreatic cancer-associated antigen in the serum of cancer patients. Cancer. 1987;60:1636–1643. doi: 10.1002/1097-0142(19871001)60:7<1636::aid-cncr2820600736>3.0.co;2-c. [DOI] [PubMed] [Google Scholar]
- 9.Passerini R, Cassatella MC, Boveri S, Salvatici M, Radice D, Zorzino L, Galli C, Sandri MT. The Pitfalls of CA19-9: Routine Testing and Comparison of Two Automated Immunoassays in a Reference Oncology Center. Am J Clin Path. 2012;138:281–287. doi: 10.1309/AJCPOPNPLLCYR07H. [DOI] [PubMed] [Google Scholar]
- 10.Duffy MJ. CA 19-9 as a marker for gastrointestinal cancers: a review. Ann Clin Biochem. 1998;35:364–370. doi: 10.1177/000456329803500304. [DOI] [PubMed] [Google Scholar]
- 11.Duffy MJ, Sturgeon C, Lamerz R, Haglund C, Holubec VL, Klapdor R, Nicolini A, Topolcan O, Heinemann V. Tumor markers in pancreatic cancer: a European Group on Tumor Markers (EGTM) status report. Ann Oncol. 2010;21:441–447. doi: 10.1093/annonc/mdp332. [DOI] [PubMed] [Google Scholar]
- 12.American Cancer Society. Cancer Facts & Figures 2017. American Cancer Society; 2017. [Google Scholar]
- 13.Del Villano BC, Brennan S, Brock P, Bucher C, Liu V, McClure M, Rake B, Space S, Westrick B, Schoemaker H, Zurawski VR., Jr Radioimmunometric assay for a monoclonal antibody-defined tumor marker, CA 19-9. Clin Chem. 1983;29:549–552. [PubMed] [Google Scholar]
- 14.Alubaidi GH, Ali ZA, Mahmood AR. Detection of carbohydrate antigen CA19-9 levels in sera and tissues’ homogenate of breast and thyroid benign cases. Iraqi J Pharm Sci. 2010;19 [Google Scholar]
- 15.Gu BX, Xu CX, Yang C, Liu SQ, Wang ML. ZnO quantum dot labeled immunosensor for carbohydrate antigen 19-9. Biosens Bioelectron. 2011;26:2720–2723. doi: 10.1016/j.bios.2010.09.031. [DOI] [PubMed] [Google Scholar]
- 16.Zhu H, Fan GC, Abdel-Halim ES, Zhang JR, Zhu JJ. Ultrasensitive photoelectrochemical immunoassay for CA19-9 detection based on CdSe@ZnS quantum dots sensitized TiO2NWs/Au hybrid structure amplified by quenching effect of Ab2@V2+conjugates. Biosens Bioelectron. 2016;77:339–346. doi: 10.1016/j.bios.2015.09.051. [DOI] [PubMed] [Google Scholar]
- 17.Chung JW, Bernhardt R, Pyuna JC. Additive assay of cancer marker CA 19-9 by SPR biosensor. Sens Actuators A. 2006;118:28–32. [Google Scholar]
- 18.Grange JH, Granger MC, Firpo MA, Mulvihill SJ, Porter MD. Toward development of a surface-enhanced Raman scattering (SERS)-based cancer diagnostic immunoassay panel. Analyst. 2013;138:410–416. doi: 10.1039/c2an36128k. [DOI] [PMC free article] [PubMed] [Google Scholar]
- 19.Zeng Q, Mao X, Xu H, Wang S, Liu G. Quantitative Immunochromatographic Strip Biosensor for the Detection of Carcinoembryonic Antigen Tumor Biomarker in Human Plasma. Am J Biomed Sci. 2009;1:70–79. [Google Scholar]
- 20.Takalkar S, Xu H, Chen J, Baryeh K, Qiu W, Zhao JX, Liu G. Gold Nanoparticle Coated Silica Nanorods for Sensitive Visual Detection of microRNA on a Lateral Flow Strip Biosensor. Anal Sci. 2016;32:617–622. doi: 10.2116/analsci.32.617. [DOI] [PubMed] [Google Scholar]
- 21.Qiu W, Xu H, Takalkar S, Gurung AS, Liu B, Zheng Y, Guo Z, Baloda M, Baryeh K, Liu G. Carbon nanotube-based lateral flow biosensor for sensitive and rapid detection of DNA sequence. Biosens Bioelectron. 2015;15:367–72. doi: 10.1016/j.bios.2014.09.028. [DOI] [PubMed] [Google Scholar]
- 22.Xu H, Chen J, Birrenkott J, Zhao JX, Takalkar S, Baryeh K, Liu G. Gold-nanoparticle-decorated silica nanorods for sensitive visual detection of proteins. Anal Chem. 2014;86:7351–7359. doi: 10.1021/ac502249f. [DOI] [PMC free article] [PubMed] [Google Scholar]
- 23.Yang Y, Ozsoz M, Liu G. Gold nanocage-based lateral flow immunoassay for immunoglobulin G. Microchim Acta. 2017:1–7. doi: 10.1007/s00604-017-2176-5. [DOI] [PMC free article] [PubMed] [Google Scholar]
- 24.Li D, Wei S, Yang H, Li Y, Deng A. A sensitive immunochromatographic assay using colloidal gold—antibody probe for rapid detection of pharmaceutical indomethacin in water samples. Biosens Bioelectron. 2009;24:2277–2280. doi: 10.1016/j.bios.2008.11.004. [DOI] [PubMed] [Google Scholar]
- 25.Tang Y, Zhai YF, Xiang JJ, Wang H, Liu B, Guo CW. Colloidal gold probe-based immunochromatographic assay for the rapid detection of lead ions in water samples. Environ Pollut. 2010;158:2074–2077. doi: 10.1016/j.envpol.2010.03.001. [DOI] [PubMed] [Google Scholar]
- 26.Song Y, Song S, Liu L, Kuang H, Guo L, Xu C. Simultaneous detection of tylosin and tilmicosin in honey using a novel immunoassay and immunochromatographic strip based on an innovative hapten. Food Agric Immunol. 2016;27:314–328. [Google Scholar]
- 27.Wang Z, Zou S, Xing C, Song S, Liu L, Xu C. Preparation of a monoclonal antibody against testosterone and its use in development of an immunochromatographic assay. Food Agric Immunol. 2016;27:547–558. [Google Scholar]
- 28.Song Y, Song S, Liu L, Kuang H, Guo L, Xu C. Simultaneous detection of tylosin and tilmicosin in honey using a novel immunoassay and immunochromatographic strip based on an innovative hapten. Food Agric Immunol. 2016;27:314–328. [Google Scholar]
- 29.Yu L, Liu L, Song S, Kuang H, Xu C. Development of an immunochromatographic test strip and ic-ELISA for tetrabromobisphenol: a detection in lake water and rice pudding samples. Food Agric Immunol. 2016;27:460–47. [Google Scholar]
- 30.Grabar KC, Freeman RG, Hommer MB, Natan MJ. Preparation and Characterization of Au Colloid Monolayers. Anal Chem. 1995;67:735–743. [Google Scholar]


