

Abstract
Programmed cell death ligand 1 (PD-L1) is part of an immune checkpoint system that is essential for preventing autoimmunity and cancer. Recent approaches in immunotherapy that target immune checkpoints have shown great promise in a variety of cancers, including metastatic melanoma. The use of targeted molecular imaging would help identify patients who will best respond to anti-PD-L1 treatment while potentially providing key information to limit immune-related adverse effects. Recently, we developed an antibody-based PD-L1–targeted SPECT agent—111In-diethylenetriaminepentaacetic acid (DTPA)-anti-PD-L1—to identify PD-L1–positive tumors in vivo. To best use such PD-L1–targeted imaging agents, it is important, as a first step, to understand how the signal is affected by different parameters. Methods: We evaluated the impact of protein concentration on the distribution of 111In-DTPA-anti-PD-L1 in a murine model of aggressive melanoma. Results: 111In-DTPA-anti-PD-L1 (dissociation constant, 0.6 ± 0.1 nM) demonstrated increased uptake in B16F10 tumors at protein concentrations equaling or exceeding 1 mg/kg at 24 h and 3 mg/kg at 72 h. At 24 h, the PD-L1–rich spleen and lungs demonstrated decreasing uptake with increasing protein concentration. At 72 h, uptake in the thymus was significantly increased at protein concentrations of 3 mg/kg or greater. Both time points demonstrated increased tracer amounts remaining in circulation as the amount of cold antibody was increased. Conclusion: These studies demonstrate that 111In-DTPA-anti-PD-L1 is capable of identifying tumors that overexpresses PD-L1 and monitoring the impact of PD-L1–rich organs on the distribution of anti-PD-L1 antibodies.
Keywords: anti-PD-L1, SPECT, melanoma, targeted antibodies, immune checkpoint inhibitors
Melanoma is the most dangerous form of skin cancer. It represents only 1% of skin cancer patients, but once metastasized, it is responsible for most skin cancer deaths. Treatment options for metastatic melanoma are severely limited, but recent approaches in immunotherapy that target immune checkpoints have shown great promise in a variety of cancers, including melanoma (1–3).
Programmed cell death ligand 1 (PD-L1) is part of an immune checkpoint system essential for preventing autoimmunity and cancer (4). PD-L1 is expressed in a variety of immune cells and immune-cell rich organs, such as the spleen and thymus (5–7). Tumor cells have developed the ability to co-opt these immune checkpoints to suppress antitumor immunity. Immune checkpoint therapy, such as anti-PD-L1 therapy, targets inhibitory checkpoint signaling, allowing the body’s immune system to recognize tumor cells and mount an attack against them. PD-L1 overexpression in tumor cells is associated with a poorer prognosis, but patients whose tumors exhibit overexpression typically have a stronger response to anti-PD-L1 therapy (8). PD-L1 expression in tumor-infiltrating immune cells is also associated with a stronger response to immune checkpoint inhibition therapy than is PD-L1 positivity in tumor itself (9). However, mixed responses to immune checkpoint therapy and the development of immune-related adverse events have highlighted a deficiency in the current methods to evaluate and monitor patients for anti-PD-L1 treatment.
In clinical trials, patients identified by immunohistochemistry as overexpressing PD-L1 in advanced melanoma have a 39% response rate to anti-PD-L1 therapy, compared with a 13% response rate in patients with PD-L1–negative melanoma (8). Immunohistochemistry is limited to a snapshot of the tumor microenvironment and is unable to capture the dynamic nature of PD-L1 expression in tumors or in PD-L1–rich organs. Clarification of PD-L1 status via molecular imaging is necessary to address why a 13% response rate was seen in patients with a negative PD-L1 status. In addition, immune-related adverse events have been noted in patients receiving anti-PD-L1 therapy, with 5% of patients experiencing grade 3 or 4 events (2). The recent exploration of combinations of immunotherapies has shown a significant improvement in treatment efficacy and significant increases in high-grade immune-related adverse events (10,11). Furthermore, increases in immune-related adverse events are anticipated because the patient population receiving immune checkpoint therapies is expected to expand due to the success of immunotherapies in the clinic. A thorough understanding of the distribution of the therapeutic anti-PD-L1 antibody within the whole body would provide valuable insight to help answer the following questions: Will a patient respond to anti-PD-L1 therapy? Would determining a dose based on an individual patient help increase that patient’s likelihood to respond? Would monitoring PD-L1 expression in immune-cell–rich organs help identify patients who are at risk for developing immune-related adverse events?
We previously reported the development and evaluation of an antibody-based PD-L1–targeted SPECT agent—111In-diethylenetriaminepentaacetic acid (DTPA)-anti-PD-L1—in an immunocompetent murine model of breast cancer (12). 111In-DTPA-anti-PD-L1 showed high uptake in the PD-L1–positive tumors but also in immune-associated organs such as the thymus and spleen. This previous study demonstrated the feasibility of developing antibody-based anti-PD-L1 SPECT molecular imaging agents capable of identifying PD-L1–expressing tumors and highlighted the significant impact of the spleen and thymus on the distribution of anti-PD-L1 antibodies. To answer the above questions and best use PD-L1–targeted imaging agents, it is important, as a first step, to understand how the signal is affected by different parameters. In this work, we used an immunocompetent murine model of melanoma to examine how the amount of antibody administered affects the signal obtained, specifically focusing on the impact of immune-related organs on the delivery of labeled and unlabeled anti-PD-L1 antibodies to the tumor site. We accomplished this by investigating the impact of protein concentration on the distribution of 111In-DTPA-anti-PD-L1, both at a tracer amount and coadministered with unlabeled anti-PD-L1 at therapeutic amounts, providing a theranostic approach. 111In-DTPA-anti-PD-L1 was evaluated in an immunocompetent murine model of melanoma via in vivo SPECT imaging and ex vivo biodistribution studies. The results were consistent with our previous work, again highlighting the impact of immune-associated organs, including the thymus and spleen, on the distribution of 111In-DTPA-anti-PD-L1. Furthermore, this work provided additional insight into the significance of these immune-associated organs and identified additional PD-L1–rich organs that affect the distribution of anti-PD-L1 antibodies.
MATERIALS AND METHODS
Reagents
All chemicals were purchased from Sigma-Aldrich Chemical Co. or Thermo Fisher Scientific, unless otherwise specified. Aqueous solutions were prepared using ultrapure water (resistivity, 18 MΩ⋅cm) treated with Chelex resin purchased from Bio-Rad Laboratories, Inc. N-[2-amino-3-(p-isothiocyanatophenyl)propyl]-trans-cyclohexane-1,2-diamine-N,N′,N′,N″,N″-pentaacetic acid (p-SCN-Bn-DTPA) was purchased from Macrocyclics, Inc. 111In (111In-InCl3) was purchased from MDS Nordion. InVivoPlus antimouse PD-L1 antibody was purchased from Bio X Cel. The murine melanoma cell line, B16F10, was kindly provided by Dr. Carolyn Anderson of the University of Pittsburgh and was authenticated by IDEXX BioResearch. The murine lymphoma cell line, EL4.murineByH1 (EL4), was obtained from Amplimmune, Inc.
Radiolabeling of Antibody
The 111In-labeled anti-PD-L1 antibody was prepared as previously described (12). Briefly, the antibody was conjugated to p-SCN-Bn-DTPA and purified by size-exclusion chromatography. The resulting antibody conjugate was added to an acid-washed 1.5-mL Eppendorf tube containing 37–74 MBq of 111In-InCl3, 0.25 mL of 0.2 M HCl, and 0.03 mL of 3 M NH4OAc, pH 7. The resulting mixture was allowed to sit at room temperature for 45–60 min and then was purified as described previously (13). Radiochemical purity was determined by thin-layer chromatography, and protein concentration was determined by a NanoDrop spectrophotometer (NanoDrop Technologies, Inc.).
In Vitro Studies
Cell Lines
The B16F10 cell line was cultured on 100 × 20 mm2 tissue culture dishes using heat-inactivated Corning Cellgro RPMI 1640 medium (Mediatech) supplemented with 10% fetal bovine serum and 1% penicillin–streptomycin. The EL4 cell line was cultured with heat-inactivated Dulbecco’s modified eagle medium supplemented with 10% horse serum. The cells were incubated at 37°C in 5% CO2.
Western Blot Analysis
To evaluate PD-L1 expression in B16F10 cells, a Western blot analysis was performed on cell lysates incubated with and without mouse recombinant interferon-γ (IFN-γ) as previously described (12), as well as on selected organs collected from C57BL/6 mice. Cells were seeded in 60-mm dishes and grown to 80% confluence. The growth medium was replaced with RPMI 1640 plus 1% fetal bovine serum. In addition, selected plates included IFN-γ, 200 ng/mL (EMD Millipore). IFN-γ is utilized to mimic in vivo cell signaling that induces PD-L1 expression (14). The lysates were centrifuged at 13,000 rpm for 15 min, the supernatant was collected, and the protein concentration was quantified by a bicinchoninic acid assay. For PD-L1 expression in non–tumor-bearing C57BL/6 mice, all organs were homogenized in radioimmunoprecipitation assay protein extraction buffer with freshly added proteinase inhibitors using mortar and pestle, and the lysate was centrifuged at 12,000 rpm for 15 min. The supernatant was collected, and the protein concentration was determined via the bicinchoninic acid assay. Approximately 40 μg of extracted cell lysates treated with and without IFN-γ and organ lysates were vertically electrophoresed on 4%–12% Bis-Tris NuPAGE gel in 3-(N-morpholino)propanesulfonic acid running buffer (Invitrogen) before being transferred to nitrocellulose membranes. The membranes were stained with Ponceau S stain, confirming protein transfer, and blocked with 5% skim milk in phosphate-buffered saline (PBS) with polysorbate 20 for 1 h at room temperature. Membranes were washed and incubated with anti-PD-L1 antibody (1:1,000, AF1019; Novus Biologicals) in 3% skim milk/PBS with polysorbate 20 overnight. Afterward, the membranes were washed, incubated with a secondary antibody for 1 h, and washed again. The membranes were then treated with Amersham ECL detection reagent (GE Healthcare Life Sciences) and exposed to HyBlot CL autoradiography film (Denville Scientific Inc.) to determine protein expression. The PD-L1 expression levels with and without IFN-γ were normalized to β-actin. The EL4 cell line served as a positive control line.
Flow Cytometry
Cell-surface expression of PD-L1 with and without IFN-γ treatment was also evaluated by flow cytometry, which was performed as previously described (12). Preparation of the EL4, a positive control, and B16F10 murine cell lines was done in parallel to maintain the same treatment conditions. Flow cytometry was performed as previously described (12). The cell lines were seeded with growth medium and serum-starved for 24 h (1% serum). The cells were then cultured for 24 h with or without IFN-γ (200 ng/mL). After incubation, the cells were trypsinized, washed with PBS (1×), and blocked with a 10% fetal bovine serum PBS solution. Cells (1 × 10⁶) were treated with antimouse B7-H1 (CD274)-phycoerythrin clone M1H5 (Ebioscience) for 30 min at 4°C, washed (2×), suspended in 500 μL of PBS, and analyzed on a FACS flow cytometer (BD Biosciences).
Receptor Binding Assay
The binding affinity of 111In-DTPA-anti-PD-L1 was determined in B16F10 cells as described previously, with modifications (12,15). Briefly, cells were seeded in 24-well plates (50,000 cells) 48 h before the experiment. IFN-γ (400 ng) was added to each well to induce PD-L1 expression. After 24 h of incubation with IFN-γ, the cells were washed (1×) with PBS (1 mL), and 0.5 mL of growth medium (RPMI 1640 with 0.1% penicillin–streptomycin and 10% fetal bovine serum) was added to each well. To determine nonspecific binding, 5 μg of anti-PD-L1 was added to half the wells as a cold block 30 min before 111In-DTPA-anti-PD-L1. 111In-DTPA-anti-PD-L1 was added to all wells in increasing concentrations (0.50–12.5 nM). The samples were incubated for 4 h at 4°C. After incubation, the radioactive medium was removed. The wells were rinsed twice with PBS (1 mL), and the cells were dissolved in 0.5% sodium dodecyl sulfate solution. The radioactivity in each fraction was measured in an automatic γ-well counter (2470 WIZARD2; Perkin-Elmer), and the protein content of each cell lysate sample was determined (bicinchoninic acid protein assay kit; Pierce). The measured radioactivity associated with the cells was normalized to the amount of cell protein present (cpm/mg of protein). The dissociation constant was calculated using Prism 6 (GraphPad).
In Vivo Studies
Animals
Seven- to 8-wk-old female C57BL/6 mice from Charles River Laboratories were used in this study. All animal studies were approved by the Animal Care and Use Committee of the Johns Hopkins University School of Medicine. For B16F10 tumors, mice were injected subcutaneously in the right flank (biodistribution) or shoulder (SPECT imaging) with 106 cells in PBS. It should be noted that when B16F10 cells are subcutaneously implanted in the ear of C57BL/6 mice, spontaneous lung metastasis has been shown to develop in approximately a third of the mice after a 4-wk growth period (16). However, lung metastatic models having B16F10 injected directly to the lungs via the tail vein only show early signs of lung metastases at approximately 2 wk after injection (17).
SPECT Imaging of 111In-DTPA-Anti-PD-L1
Two tumor-bearing healthy C57BL/6 female mice were injected intravenously with 15–16 MBq of 111In-DTPA-anti-PD-L1 (60 μg) 10 d after B16F10 cell injections. At 1, 24, and 72 h after injection of the 111In-DTPA-anti-PD-L1, whole-body SPECT images were acquired with a VECTor4 SPECT system (MILabs) using a general-purpose mouse collimator with 0.6-mm pinholes, yielding a 0.4-mm resolution in the reconstructed images. Images were acquired for 60 min at the 1- and 24-h time points and 90 min at the 72-h time point and were reconstructed with a voxel side length of 0.2 mm using prediction-oriented segmentation in expectation maximization, a vendor-supplied iterative algorithm (18). The SPECT images were analyzed with ImageJ Fiji, version 1.49b (National Institutes of Health), and voxel intensity was calibrated using images of a standard with a known activity and volume. The SPECT images were coregistered with CT images for an anatomic reference using AMIDE (http://amide.sourceforge.net).
Biodistribution of 111In-DTPA-Anti-PD-L1
Biodistribution experiments were conducted as previously described, with minor modifications (15,19,20). Briefly, healthy B16F10 tumor–bearing female C57BL/6 mice (5 per time point) were injected intravenously with 111In-DTPA-anti-PD-L1 (0.37 MBq [specific activity, 21.3 MBq/nmol]; 0.13 mg of antibody protein per kilogram of mouse mass) 10 d after the B16F10 cell injections. At 1, 24, 72, and 96 h after the injection of 111In-DTPA-anti-PD-L1, the mice were sacrificed. The blood, heart, lungs, liver, kidneys, spleen, stomach (with content), intestine (with content), bone, thymus, muscle, and tumors were harvested, weighed, and measured in a γ-well counter.
In addition, to examine the impact of a wider range of administered antibody, additional biodistribution studies were performed using 111In-DTPA-anti-PD-L1 (0.37 MBq) antibody doses of approximately 0.5–0.6 mg/kg (dose 1), 1 mg/kg (dose 2), 3 mg/kg (dose 3), 5 mg/kg (dose 4), and 10 mg/kg (dose 5). The mice were sacrificed at 24 and 72 h after injection, and the organs were visually inspected, harvested, and processed as described above. The percentage injected dose (%ID) per gram was calculated by comparison to a weighed, diluted standard.
Statistical Analysis
Statistical analysis was performed using Prism 6. All data are presented as mean ± SD. Groups were compared using 2-way ANOVA; values were considered significant at a P value of 0.05 or less.
RESULTS
Radiolabeling of Antibody
The 111In-DTPA-anti-PD-L1 was radiolabeled at an average specific activity of 21.2 ± 1.97 MBq/nmol, with greater than 95% radiochemical purity after purification.
Western Blot Analysis
The B16F10 cells were positive for PD-L1 expression, having similar levels with or without IFN-γ (Supplemental Fig. 1; supplemental materials are available at http://jnm.snmjournals.org). In non–tumor-bearing C57BL/6 mice, the thymus, spleen, lungs, and kidneys showed PD-L1 expression, whereas the liver had very low to no expression. PD-L1 expression levels for the liver were set to 1, and relative expression levels were determined in the thymus (4.85), spleen (3.87), lung (3.22), and kidneys (1.67) (Supplemental Fig. 2).
Flow Cytometry
PD-L1 expression on the EL4 cell line was not significantly increased with IFN-γ treatment (Fig. 1). PD-L1 expression on the B16F10 cells increased 4.1-fold with IFN-γ incubation as determined by the mean fluorescent intensity. Response to IFN-γ highlights the ability of the B16F10 tumor cell line to mount an antiimmunity response to immune cell signaling.
FIGURE 1.

Flow cytometry for murine cell lines EL4 and B16F10. Cells were stained with anti-PD-L1 antibody after treatment with and without IFN-γ. Unstained cells were used as reference. FL2-H = maximum fluorescence emission; MFI = mean fluorescent intensity; PE = phycoerythrin.
Receptor Binding Assay
The saturation binding assay showed that 111In-DTPA-anti-PD-L1 binds with high affinity to PD-L1, having a dissociation constant of 0.6 ± 0.1 nM (Supplemental Fig. 3).
In Vivo Studies
SPECT Imaging of 111In-DTPA-Anti-PD-L1
At 1 h, most of the activity on the SPECT images was concentrated along the major arteries (carotids, caudal, and femoral) and heart. The lungs demonstrated modest contrast to the background. The spleen, liver, and tumor were distinguishable but had low contrast to the background. At 24 h (Fig. 2), clearance from the blood reduced the signal so that only the carotids and heart had modest to low contrast to the background. The B16F10 isograft had the highest contrast to the background and was clearly visible. The liver and spleen were defined with superior contrast to the background as well. The thymus (Supplemental Fig. 4) and brown adipose tissue (BAT, Supplemental Fig. 5) had modest contrast to the background. At 72 h, the liver, spleen, and tumor isograft were distinct, with modest contrast to the background. Because of the rapid growth of the B16F10 tumor line, the isograft was significantly larger at 72 h than at 24 h, obstructing visualization of BAT. The low signal-to-noise ratio at 72 h did not allow for a clear definition of the thymus (Supplemental Fig. 6).
FIGURE 2.
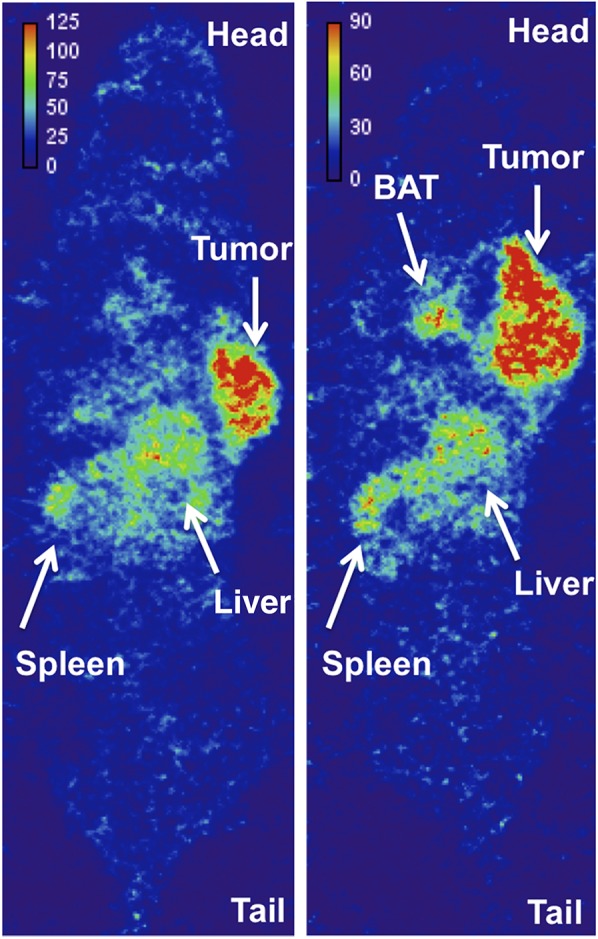
Coronal section of whole-body SPECT image of 111In-DTPA-anti-PD-L1 (3 mg/kg) 24 h after injection in 2 prone C57BL/6 mice bearing B16F10 tumor. Voxel intensity (MBq/mL) was calibrated from SPECT image of known activity and volume.
Biodistribution of 111In-DTPA-Anti-PD-L1
At 1 h, the highest uptake was observed in the blood, lung, liver, spleen, and kidneys (Fig. 3). Tumor demonstrated the greatest uptake at 24 h after injection (6.6 ± 3.1 %ID/g), with a tumor-to-muscle ratio of 4.6 ± 2.0 and a tumor-to-blood ratio of 4.2 ± 1.5. This uptake was lower than in our previous study (12), most likely because that study used a different anti-PD-L1 antibody, which is no longer available to us. After its peak at 24 h, tumor uptake decreased at 72 and 96 h. The pattern of uptake in the kidneys was similar to that in tumor, with a peak at 24 h followed by a decrease. Decreasing uptake over the 96-h window was also shown in the blood, lungs, and spleen; significant decreases (P ≤ 0.05) were seen in both the lungs and the spleen.
FIGURE 3.

Biodistribution of 111In-DTPA-anti-PD-L1 (0.37 MBq, 0.13 mg/kg, 21.3 MBq/nmol) in B16F10 tumor–bearing mice at 1, 24, 72, and 96 h after injection (n = 5 at 1, 72, and 96 h; n = 4 at 24 h).
In the biodistribution studies that used a range of administered antibody (doses 1–5), the blood, lungs, spleen, and tumor had significant changes in uptake at 24 h due to the increasing dose concentration (Fig. 4). The presence of additional unlabeled antibody in the administered doses resulted in decreased uptake in the lung and spleen and increased uptake in tumor and blood. The highest uptake in tumor (11.9 ± 3.0 %ID/g) was observed at dose 3, with a tumor-to-muscle ratio of 10 ± 0.2 and a tumor-to-blood ratio of 1.0 ± 0.2 (Table 1). At 72 h, uptake in the lungs remained consistent over the doses, but significant changes were seen again in the blood, spleen, and tumor, as well as in the thymus (Fig. 4). The blood, tumor, and thymus uptake increased with doses that had higher amounts of cold antibody, whereas the spleen uptake decreased. The highest uptake in tumor (15.4 ± 7.9 %ID/g) occurred at dose 5, with a tumor-to-muscle ratio of 8.7 ± 2.8 and a tumor-to-blood ratio of 1.9 ± 1.0 (Table 2). On visual inspection, the organs in the biodistribution studies showed no signs of metastatic disease. The increase in dose from 0.6 to 10 mg/kg is representative of a competitive blocking experiment. In a traditional blocking experiment, we would expect to observe a decrease in tumor uptake indicating selective binding to the target. However, this result was not seen because the spleen served as a sink for the PD-L1 antibody. The significant decrease in spleen uptake at 24 h, as well as at 72 h for the 10 mg/kg dose, is indicative of selective binding of the labeled and unlabeled PD-L1 antibody to PD-L1 because of the strong presence of PD-L1–positive immune cells in the spleen. The improved tumor uptake is attributed to excess antibody occupying sites in the spleen, allowing more labeled antibody to reach the tumor after passage through the spleen.
FIGURE 4.

Ex vivo biodistribution of 111In-DTPA-anti-PD-L1 at 24 h (A) and 72 h (C) after injection in C57BL/6 mice bearing B16F10 tumors, and selected organs having significant differences in uptake between doses administered at 24 h (B) and 72 h (D). Dose 1: specific activity, 4.4–5.6 MBq/nmol; protein concentration, 0.5–0.6 mg/kg. Dose 2: specific activity, 2.8 MBq/nmol; protein concentration, 1.0 mg/kg. Dose 3: specific activity, 0.9 MBq/nmol; protein concentration, 3.0 mg/kg. Dose 4: specific activity, 0.6 MBq/nmol; protein concentration, 5.0 mg/kg. Dose 5: specific activity, 0.3 MBq/nmol; protein concentration, 10 mg/kg. *P ≤ 0.05. **P ≤ 0.01. ***P ≤ 0.001. ****P ≤ 0.0001.
TABLE 1.
111In-DTPA-Anti-PD-L1 24 Hours After Injection
| Dose | MBq/nmol | mg/kg | %ID/g tumor | %ID/g spleen | Tumor to blood | Tumor to muscle |
| 1 | 4.4–5.6 | 0.5–0.6 | 4.8 ± 1.7 | 47 ± 9.5 | 3.9 ± 3.0 | 3.2 ± 1.8 |
| 2 | 2.8 | 1.0 | 10 ± 2.0 | 26 ± 3.4 | 1.7 ± 0.4 | 9.6 ± 2.6 |
| 3 | 0.9 | 3.0 | 12 ± 3.0 | 17 ± 1.8 | 1.0 ± 0.2 | 10 ± 0.2 |
| 4 | 0.6 | 5.0 | 10 ± 4.4 | 9.0 ± 2.5 | 0.8 ± 0.2 | 8.4 ± 0.2 |
| 5 | 0.3 | 10.0 | 8.5 ± 1.9 | 6.8 ± 1.0 | 0.8 ± 0.1 | 11 ± 0.1 |
TABLE 2.
111In-DTPA-Anti-PD-L1 72 Hours After Injection
| Dose | MBq/nmol | mg/kg | %ID/g tumor | %ID/g spleen | Tumor to blood | Tumor to muscle |
| 1 | 4.4–5.6 | 0.5–0.6 | 3.8 ± 0.8 | 23 ± 4.1 | 9.0 ± 2.3 | 2.8 ± 0.6 |
| 2 | 2.8 | 1.0 | 4.3 ± 0.8 | 21 ± 2.8 | 11 ± 2.3 | 3.1 ± 1.1 |
| 3 | 0.9 | 3.0 | 13 ± 6.0 | 21 ± 4.2 | 5.4 ± 2.0 | 8.9 ± 6.1 |
| 4 | 0.6 | 5.0 | 13 ± 3.0 | 20 ± 5.5 | 2.7 ± 0.9 | 9.3 ± 3.3 |
| 5 | 0.3 | 10.0 | 15 ± 8.0 | 12 ± 3.0 | 1.9 ± 1.0 | 8.7 ± 2.8 |
DISCUSSION
Anti-PD-L1 antibodies are active against a variety of cancers but have an unpredictable success rate. Currently, antibody for patient therapy is administered on a per-kilogram basis regardless of tumor burden or PD-L1 expression, as empirically determined in multiarm, phase 1 trials (2). The ability to accurately determine PD-L1 expression and monitor the distribution of anti-PD-L1 antibodies would enable a precision medicine approach to immune checkpoint inhibition therapy, but before such an approach can be implemented, a greater understanding is required of the biodistribution of such therapeutics and of how normal-organ distribution is affected by the amount of antibody administered. Our previous work demonstrated the feasibility of modifying an anti-PD-L1 antibody to deliver a SPECT imaging payload to PD-L1–positive sites, including subcutaneous breast cancer (12). In the current work, we examined the effects of antibody concentration on distribution of the anti-PD-L1 SPECT agent in a murine model of melanoma.
The preliminary biodistribution was evaluated at a specific activity of 21.3 MBq/nmol (4 μg). The results for this level of activity showed high uptake in the spleen, which serves as a sink for the anti-PD-L1 antibody, resulting in minimal uptake in tumor. To enhance uptake in tumor, we added a therapeutic dose of unlabeled anti-PD-L1 antibody to the tracer dose of 111In-DTPA-anti-PD-L1 to help block PD-L1 sites in the spleen. We selected the 24- and 72-h time points on the basis of our preliminary biodistribution study and our previous study on a murine model of breast cancer (12). Coadministration of the unlabeled antibody effectively lowered the specific activity by increasing the amount of antibody protein administered, providing an agent capable of both diagnostic and therapeutic applications in a theranostic approach. Such an agent can guide and optimize anti-PD-L1 therapy, potentially by relating observed effects to distribution of the antibody. The ex vivo biodistribution of 111In-DTPA-anti-PD-L1 was consistent with our previous observation in the breast cancer model that the spleen serves as a sink, with uptake being associated with PD-L1–positive B cells, splenic dendritic cells, and macrophages (7), whereas uptake in the thymus is not significantly affected by increasing protein amounts at 24 h. However, the current study provides additional insight into the effects of protein concentration on the distribution of anti-PD-L1 antibodies. First, uptake in the thymus increased at the later time point for doses containing higher protein concentrations (≥3 mg/kg). Second, at the earlier time point, uptake in the lungs was significantly blocked as the protein concentration was increased. Finally, a dose of 3 mg/kg appears to provide optimal distribution of the anti-PD-L1 antibody in this model. At this dose, uptake in tumor is comparable to that at higher doses and the concentration in the blood is lower than at higher doses.
The thymus, having a PD-L1–rich environment because of its association with naïve T-cell output, is affected by immune checkpoint therapy (6). In normal thymus tissue, PD-L1 expression is associated with the epithelial cells (21). Immune checkpoint therapy, including anti-PD-L1 therapy, has been associated with adverse effects such as myasthenia gravis, which has been seen in a small percentage of patients receiving anti-PD-L1 therapy (2). However, the recent report of fatal nivolumab-related myasthenia gravis has further stressed the need to understand the impact of immune checkpoint therapy on the thymus (22). In addition, the impact of uptake in the thymus may vary because of variation in activity between patients, especially pediatric cancer patients. The translation of anti-PD-L1 therapy to pediatric cancer would require a better understanding of the impact of the thymus on distribution of these antibodies, since thymus activity decreases with age, potentially contributing to increased susceptibility to infection, autoimmune disease, and cancer (23). The data presented here highlight a significant increase in thymus uptake of the labeled anti-PD-L1 antibody as the administered dose increases. Specifically, the doses with increased protein concentration (≥3 mg/kg) demonstrated increased uptake of the labeled anti-PD-L1 antibody over time, being the highest at the later time point. However, there were no significant differences in uptake between doses of 3 mg/kg and higher, suggesting that saturation of binding sites in the thymus occurs at the 3 mg/kg dose.
The lung is host to a variety of immune cells because of its continuous exposure to external pathogens (24). PD-L1 expression in the lungs is associated with resident immune cells, particularly alveolar macrophages (25,26). Adverse effects, including pneumonitis, influenzalike illnesses, and sarcoidosis, highlight the need for a clear understanding of the distribution and impact of immune checkpoint therapies on nontumor sites such as the lungs (2). This study highlighted differences in lung uptake of 111In-DTPA-anti-PD-L1 at the earlier time point. Specifically, as the concentration of unlabeled antibody increased, binding sites for 111In-DTPA-anti-PD-L1 decreased at the 24-h time point. There was no significant difference in 111In-DTPA-anti-PD-L1 uptake between the various doses at the later time point, suggesting that the PD-L1 binding sites in the lungs were saturated at doses of 3 mg/kg and higher at 24 h and all doses at 72 h.
The whole-body SPECT images of 111In-DTPA-anti-PD-L1 at the determined optimal dose (3 mg/kg) support the biodistribution data. SPECT imaging demonstrated that tumor, spleen, and liver are clearly defined at the later time point. At the 24-h time point, signal was intensified at the thymus, which is consistent with our biodistribution data. The development of a higher-resolution, higher-sensitivity agent for PET imaging would be beneficial in distinguishing the thymus. Hettich et al. demonstrated clear uptake of an anti-PD-L1 PET agent in BAT in C57BL/6 mice, relating to CD45-positive leukocytes (macrophages and CD3-positive T cells) (27). Our SPECT images of 111In-DTPA-anti-PD-L1 were able to distinguish BAT in the murine model of melanoma. In addition, we confirmed uptake in BAT in a murine model of breast cancer and in biodistribution studies (unpublished data, 2017).
The optimal dose in our murine model of melanoma was determined to be 3 mg/kg. However, melanoma is more immunogenic and more responsive to immune checkpoint therapies than other cancers, and the optimal dose may differ for cancer types that are less so. Also, the optimal amount of anti-PD-L1 antibody per unit of body weight will likely differ between humans and mice. The approach presented in this work provides a means to identify disease-specific optimal amounts.
CONCLUSION
The development of anti-PD-L1 theranostic agents and imaging protocols is critical in providing a personalized approach to immune checkpoint therapies. We have demonstrated the dependence of PD-L1 antibody biodistribution on the amount of antibody administered, and we have identified the antibody level that maximizes delivery to tumors relative to normal organs in a murine model of melanoma. We also confirmed that the spleen is a significant sink for PD-L1 antibody and that the amount available in the tumor environment is affected by splenic uptake. Furthermore, we demonstrated the impact of the dose concentration on distribution of the anti-PD-L1 antibody to the thymus and lungs. Anti-PD-L1 imaging has substantial potential—potential for allowing the amount of administered antibody to be adjusted to optimize treatment, potential for evaluating the patient-specific variability in antibody distribution to ensure that adequate amounts reach tumors, potential for identifying the development of adverse effects, and potential for better understanding why response to this type of therapy varies in different patients.
DISCLOSURE
This work was supported by a grant from the National Institutes of Health (RO1CA187037). No other potential conflict of interest relevant to this article was reported.
Supplementary Material
Acknowledgments
We thank Drs. Elizabeth Jaffe, Suzanne Topalian, and Leisha Emens for their helpful insights on PD-L1 therapy, and Drs. Ben Tsui, Andew Rittenbach, and Taek-Soo Lee for their assistance with the small-animal SPECT imaging.
REFERENCES
- 1.Lipson EJ, Forde PM, Hammers HJ, Emens LA, Taube JM, Topalian SL. Antagonists of PD-1 and PD-L1 in cancer treatment. Semin Oncol. 2015;42:587–600. [DOI] [PMC free article] [PubMed] [Google Scholar]
- 2.Brahmer JR, Tykodi SS, Chow LQ, et al. Safety and activity of anti-PD-L1 antibody in patients with advanced cancer. N Engl J Med. 2012;366:2455–2465. [DOI] [PMC free article] [PubMed] [Google Scholar]
- 3.Larkin J, Chiarion-Sileni V, Gonzalez R, et al. Combined nivolumab and ipilimumab or monotherapy in untreated melanoma. N Engl J Med. 2015;373:23–34. [DOI] [PMC free article] [PubMed] [Google Scholar]
- 4.Pardoll DM. The blockade of immune checkpoints in cancer immunotherapy. Nat Rev Cancer. 2012;12:252–264. [DOI] [PMC free article] [PubMed] [Google Scholar]
- 5.Carter L, Fouser LA, Jussif J, et al. PD-1:PD-L inhibitory pathway affects both CD4(+) and CD8(+) T cells and is overcome by IL-2. Eur J Immunol. 2002;32:634–643. [DOI] [PubMed] [Google Scholar]
- 6.Murray JM, Kaufmann GR, Hodgkin PD, et al. Naive T cells are maintained by thymic output in early ages but by proliferation without phenotypic change after age twenty. Immunol Cell Biol. 2003;81:487–495. [DOI] [PubMed] [Google Scholar]
- 7.Liu Q, Lu JY, Wang XH, Qu BJ, Li SR, Kang JR. Changes in the PD-1 and PD-L1 expressions of splenic dendritic cells in multiple-organ dysfunction syndrome mice and their significance. Genet Mol Res. 2014;13:7666–7672. [DOI] [PubMed] [Google Scholar]
- 8.Herbst RS, Soria JC, Kowanetz M, et al. Predictive correlates of response to the anti-PD-L1 antibody MPDL3280A in cancer patients. Nature. 2014;515:563–567. [DOI] [PMC free article] [PubMed] [Google Scholar]
- 9.Kim MY, Koh J, Kim S, Go H, Jeon YK, Chung DH. Clinicopathological analysis of PD-L1 and PD-L2 expression in pulmonary squamous cell carcinoma: comparison with tumor-infiltrating T cells and the status of oncogenic drivers. Lung Cancer. 2015;88:24–33. [DOI] [PubMed] [Google Scholar]
- 10.Postow MA, Chesney J, Pavlick AC, et al. Nivolumab and ipilimumab versus ipilimumab in untreated melanoma. N Engl J Med. 2015;372:2006–2017. [DOI] [PMC free article] [PubMed] [Google Scholar]
- 11.Wolchok JD, Kluger H, Callahan MK, et al. Nivolumab plus ipilimumab in advanced melanoma. N Engl J Med. 2013;369:122–133. [DOI] [PMC free article] [PubMed] [Google Scholar]
- 12.Josefsson A, Nedrow JR, Park S, et al. Imaging, biodistribution, and dosimetry of radionuclide-labeled PD-L1 antibody in an immunocompetent mouse model of breast cancer. Cancer Res. 2016;76:472–479. [DOI] [PMC free article] [PubMed] [Google Scholar]
- 13.Brechbiel MW. Bifunctional chelates for metal nuclides. Q J Nucl Med Mol Imaging. 2008;52:166–173. [PMC free article] [PubMed] [Google Scholar]
- 14.Topalian SL, Drake CG, Pardoll DM. Targeting the PD-1/B7-H1(PD-L1) pathway to activate anti-tumor immunity. Curr Opin Immunol. 2012;24:207–212. [DOI] [PMC free article] [PubMed] [Google Scholar]
- 15.Beaino W, Nedrow JR, Anderson CJ. Evaluation of 68Ga- and 177Lu-DOTA-PEG4-LLP2A for VLA-4-targeted PET imaging and treatment of metastatic melanoma. Mol Pharm. 2015;12:1929–1938. [DOI] [PMC free article] [PubMed] [Google Scholar]
- 16.Hart IR. The selection and characterization of an invasive variant of the B16 melanoma. Am J Pathol. 1979;97:587–600. [PMC free article] [PubMed] [Google Scholar]
- 17.Adiseshaiah PP, Patel NL, Ileva LV, Kalen JD, Haines DC, McNeil SE. Longitudinal imaging of cancer cell metastases in two preclinical models: a correlation of noninvasive imaging to histopathology. Int J Mol Imaging. 2014:102702. [DOI] [PMC free article] [PubMed] [Google Scholar]
- 18.Branderhorst W, Vastenhouw B, Beekman FJ. Pixel-based subsets for rapid multi-pinhole SPECT reconstruction. Phys Med Biol. 2010;55:2023–2034. [DOI] [PubMed] [Google Scholar]
- 19.Nedrow JR, Latoche JD, Day KE, et al. Targeting PSMA with a Cu-64 labeled phosphoramidate inhibitor for PET/CT imaging of variant PSMA-expressing xenografts in mouse models of prostate cancer. Mol Imaging Biol. 2016;18:402–410. [DOI] [PubMed] [Google Scholar]
- 20.Song H, Shahverdi K, Huso DL, et al. 213Bi (α-emitter)-antibody targeting of breast cancer metastases in the neu-N transgenic mouse model. Cancer Res. 2008;68:3873–3880. [DOI] [PMC free article] [PubMed] [Google Scholar]
- 21.Padda SK, Riess JW, Schwartz EJ, et al. Diffuse high intensity PD-L1 staining in thymic epithelial tumors. J Thorac Oncol. 2015;10:500–508. [DOI] [PMC free article] [PubMed] [Google Scholar]
- 22.Shirai T, Sano T, Kamijo F, et al. Acetylcholine receptor binding antibody-associated myasthenia gravis and rhabdomyolysis induced by nivolumab in a patient with melanoma. Jpn J Clin Oncol. 2016;46:86–88. [DOI] [PubMed] [Google Scholar]
- 23.Palmer DB. The effect of age on thymic function. Front Immunol. 2013;4:316. [DOI] [PMC free article] [PubMed] [Google Scholar]
- 24.Chen K, Kolls JK. T cell-mediated host immune defenses in the lung. Annu Rev Immunol. 2013;31:605–633. [DOI] [PMC free article] [PubMed] [Google Scholar]
- 25.Igarashi T, Teramoto K, Ishida M, Hanaoka J, Daigo Y. Scoring of PD-L1 expression intensity on pulmonary adenocarcinomas and the correlations with clinicopathological factors. ESMO Open. 2016;1:e000083. [DOI] [PMC free article] [PubMed] [Google Scholar]
- 26.Taube JM, Klein A, Brahmer JR, et al. Association of PD-1, PD-1 ligands, and other features of the tumor immune microenvironment with response to anti-PD-1 therapy. Clin Cancer Res. 2014;20:5064–5074. [DOI] [PMC free article] [PubMed] [Google Scholar]
- 27.Hettich M, Braun F, Bartholoma MD, Schirmbeck R, Niedermann G. High-resolution PET imaging with therapeutic antibody-based PD-1/PD-L1 checkpoint tracers. Theranostics. 2016;6:1629–1640. [DOI] [PMC free article] [PubMed] [Google Scholar]
Associated Data
This section collects any data citations, data availability statements, or supplementary materials included in this article.