

Abstract
IMPORTANCE
Prevention of osteoporosis in adulthood begins with optimizing bone health in early life. The longitudinal association between growth and bone accretion during childhood is not fully understood.
OBJECTIVES
To assess the acquisition of whole-body (WB) and skeletal site–specific bone mineral content (BMC) relative to linear growth in a healthy, diverse, longitudinal cohort of children, adolescents, and young adults and to test for differences related to sex and African American race.
DESIGN, SETTING, AND PARTICIPANTS
This investigation was a mixed longitudinal study with annual assessments for up to 7 years at 5 US clinical centers. Participants were healthy children, adolescents, and young adults. The study dates were July 2002 through March 2010. The dates of the analysis were June through December 2016.
MAIN OUTCOMES AND MEASURES
Anthropometrics, BMC, and body composition via dual-energy x-ray absorptiometry. The superimposition by translation and rotation (SITAR) analysis method was used to define the mean trajectories for height, WB lean soft tissue, appendicular lean soft tissue, and WB and skeletal site–specific BMC acquisition and to measure the age and magnitude of peak velocity for each parameter. The SITAR modeling was performed separately by sex and self-reported race.
RESULTS
Among 2014 healthy children, adolescents, and young adults (1022 [50.7%] female and 479 [23.8%] African American) aged 5 to 19 years at study entry, the mean age of peak height velocity was 13.1 years (95% CI, 13.0–13.2 years) in African American boys vs 13.4 years (95% CI, 13.3–13.4 years) in non-African American boys (difference, −0.3 years; 95% CI, −0.4 to −0.1 years) and 11.0 years (95% CI, 10.8–11.1 years) in African American girls vs 11.6 years (95% CI, 11.5–11.6 years) in non-African American girls (difference, −0.6 years; 95% CI, −0.7 to −0.5 years). Age of peak acquisition of WB BMC was 14.0 years (95% CI, 13.8–14.1 years) in African American boys vs 14.0 years (95% CI, 13.9–14.1 years) in non-African American boys (difference, −0.0 years; 95% CI, −0.2 to 0.2 years) and 12.1 years (95% CI, 12.0–12.3 years) in African American girls vs 12.4 years (95% CI, 12.3–12.5 years) in non-African American girls (difference, −0.3 years; 95% CI, −0.4 to −0.1 years). At age 7 years, children had acquired 69.5% to 74.5% of maximal observed height but only 29.6% to 38.1% of maximal observed WB BMC. Adolescents gained 32.7% to 35.8% of maximal observed WB BMC during the 2 years before and 2 years after peak height velocity. Another 6.9% to 10.7% of maximal observed WB BMC occurred after linear growth had ceased. In the group at highest risk for fracture, non-African American boys, peak fracture incidence occurred approximately 1 year before peak height velocity.
CONCLUSIONS AND RELEVANCE
In this longitudinal study, height gains substantially outpaced gains in BMC during childhood, which could contribute to fracture risk. A significant proportion of bone is accrued after adult height is achieved. Therefore, late adolescence represents a potentially underrecognized window of opportunity to optimize bone mass.
The bone mass achieved by young adulthood is a critically important determinant of lifelong bone health.1 A significant proportion of peak bone mass is acquired during adolescence. Although linear growth and bone acquisition are coordinated, they do not occur at exactly the same pace. It has previously been hypothesized that a lag between skeletal expansion and skeletal mineralization may contribute to an epidemiologically observed increase in fracture risk in childhood.2 However, few pediatric studies have contained sufficiently detailed longitudinal measurements to characterize the difference in pace between gains in height and gains in bone throughout childhood, adolescence, and young adulthood. The strong associations between bone mineral content (BMC) accrual and lean soft tissue (LST) are also important to consider.3,4 Moreover, the association between growth, body composition, and BMC accrual may be specific to the particular skeletal site and may vary with sex and race. We and others have previously demonstrated differences in skeletal development in African American children compared with non-African American children.5,6 The degree to which sex- and race-related differences in adult bone density are attributable to differences in the timing and magnitude of developmental gains in bone mass remains unknown.
Therefore, the present study aimed (1) to assess the acquisition of whole-body (WB) and skeletal site–specific BMC relative to linear growth, WB LST, and appendicular LST (aLST) (reflecting mostly skeletal muscle in the limbs7) between ages 5 and 20 years in a healthy, diverse, longitudinal cohort and (2) to test for differences related to sex and African American race. We used innovative techniques that have significantly increased the feasibility of such investigations.8
Methods
Study Sample
The Bone Mineral Density in Childhood Study (BMDCS)5 was a mixed longitudinal investigation of 2014 children enrolled at 5 US centers who were evaluated between July 2002 and March 2010. The dates of the analysis were June through December 2016. Participants (aged 5–19 years at study entry) were evaluated annually for up to 7 years. Inclusion and exclusion criteria were specified to obtain a healthy sample of children without medical problems known to adversely influence bone health.5 Height and body mass index of each participant at study entry were required to be between the 3rd and 97th percentiles for age and sex.
The protocol was approved by the institutional review boards at each clinical center (The Children’s Hospital of Philadelphia, Cincinnati Children’s Hospital Medical Center, Creighton University, Children’s Hospital Los Angeles, and Columbia University) and the data coordinating center (Clinical Trials and Survey Corporation). Consent was obtained from the parent or guardian for participants younger than 18 years, and assent was obtained from participants. Written informed consent was obtained from study participants 18 years or older.
Self-reported Race
Individuals were categorized as African American or non-African American. Children’s race was based on the parent’s report.5
Physical Examination
Height, weight, and Tanner stage5 were assessed following standard procedures. Sex-specific body mass index and height z scores were calculated.9
Body Composition
Whole-body, posteroanterior lumbar spine, proximal femur, and forearm (distal one-third radius and ultradistal radius) dual-energy x-ray absorptiometry (DXA) scans were acquired on bone densitometers (QDR4500A, QDR4500W, and Delphi A; Hologic) for determination of BMC and areal bone mineral density (aBMD). All scans were analyzed centrally by the DXA Core Laboratory at the University of California, San Francisco, using Hologic (release 12.3) software.10 Both WB and aLST (excluding bone) were determined and corrected for intermachine differences and longitudinal drift. Whole-body and site-specific BMC and aBMD z scores, adjusted for age- and sex-specific height z scores, were calculated.10
Fracture
Participants were asked whether they had experienced a fracture in the previous year. This question was asked at each follow-up visit.
Statistical Analysis
Characteristics of the cohort were summarized with parametric or nonparametric statistics as appropriate. We used a growth modeling approach called superimposition by translation and rotation (SITAR),8 which generates a shape-invariant model with a single fitted curve. Models with different df were tested empirically and evaluated with respect to goodness of fit. For each individual and for each dimension of growth (height, WB and skeletal site–specific BMC acquisition, WB LST, and aLST), 3 parameters were estimated as random effects for each individual that correspond to key features of variation in growth. These parameters included size (individuals can be larger or smaller than average), tempo (the timing of the adolescent spurt can be earlier or later than average), and velocity (the duration of the adolescent spurt can be more or less rapid than average). By design, SITAR permits inclusion of individuals with missing data and reduces complex growth curves into these 3 clinically meaningful parameters that can be compared across individuals and groups. We tested models with 4 to 8 df11 and used visualization, along with the Bayesian information criterion, to identify the best model. Results were used to estimate the age and magnitude of peak velocity for each individual participant.12 As in previous investigations from the BMDCS,5 we fit separate models for African American and non-African American children. We used the standard error of the tempo parameter in the sex- and race-stratified SITAR models as an estimate of the standard error of age of peak height velocity (PHV), and we used the standard error of the velocity parameter as a proportional standard error for peak velocity.8 Summary statistics were used to perform sex-stratified t tests to assess the difference between African Americans and non-African Americans for each parameter. We report unadjusted P values and indicate those that meet the Bonferroni-adjusted P value threshold of less than 0.0028 (0.05 divided by 18 sex-stratified comparisons).
The difference in growth velocity parameters by race (African American vs non-African American) was assessed using 2-sample t tests for girls and boys separately. We expressed the magnitude of BMC and LST parameters at the age of PHV relative to maximal observed value before 20 years or the value at age 20 years, whichever was greater (referred to as maximal observed value) because the age of PHV serves as a common point of reference. We estimated the proportion of maximal observed BMC and LST that is acquired during the following 2 periods of interest: (1) during the 2 years before and 2 years after PHV and (2) after peak height (linear growth velocity <1 cm/y) was achieved. Pearson product moment correlation analyses were used to investigate the association between the size, tempo, and velocity parameters obtained by SITAR in each of the dimensions of growth. To understand the association between pubertal timing and SITAR parameters, we visualized these parameters with the cohort stratified into previously defined categories of age of pubertal onset (within the BMDCS cohort, <25th percentile, 25th to <75th percentile, and ≥75th percentile).13 Analysis of variance was used to evaluate the association of the age of peak velocity and peak velocity in each parameter with the category of pubertal timing. To understand how observed trajectories of linear growth and bone acquisition may relate to fracture vulnerability, we calculated the annualized incidence of any fracture in each year of life by sex and race.
All analyses were conducted using R (version 3.1.3),14 including the SITAR extension package.15 Statistical significance was taken as a 2-sided P value of less than .05.
Results
Sample Characteristics
The sample consisted of 2014 healthy children, adolescents, and young adults (1022 [50.7%] female and 479 [23.8%] African American), who completed a mean of 5 annual visits each (eTable 1 in the Supplement). These visits represent a range of pubertal stages, with 5001 of 10 695 (46.8%) visits occurring in postpubertal (Tanner V) adolescents.
SITAR Trajectories
The mean trajectory curves are shown in Figure 1A (for magnitude of attained BMC and LST) and Figure 1B (for velocity of BMC and LST) by sex and race. As expected, older boys were taller and had more BMC and LST than older girls. For boys, peak velocity in all parameters occurred later and was greater in magnitude. Across childhood, the absolute amount of both BMC and LST was greater in African American children and adolescents compared with non-African American children and adolescents despite overall similar heights.
Figure 1.
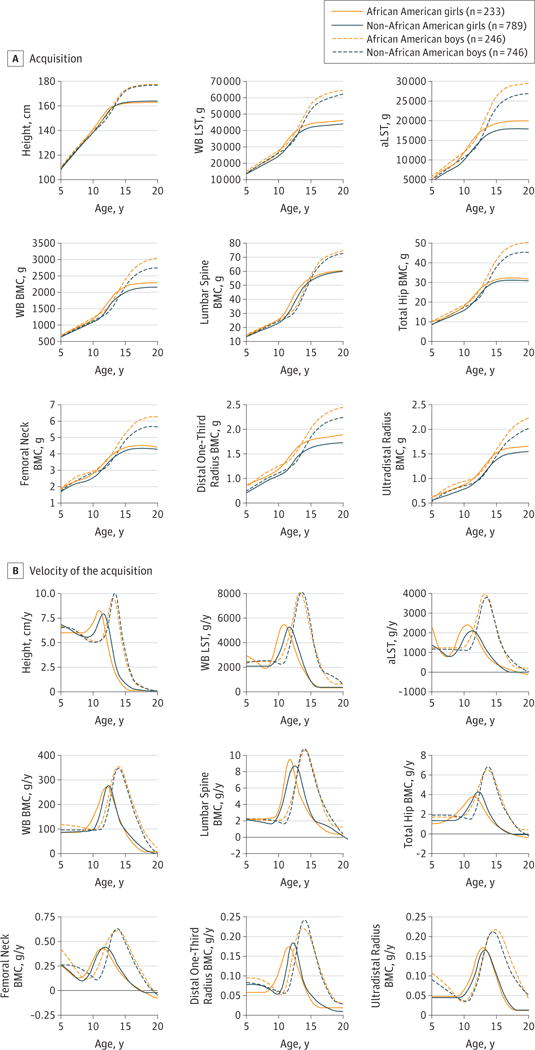
Acquisition of Height, Bone, and Soft Tissue With Age, by Sex and Self-reported Race, From the Mean Curves Modeled Using SITAR (Superimposition by Translation and Rotation)
A, The SITAR-derived mean curves for the magnitude of acquisition of each growth parameter with increasing age are shown, stratified by sex and race. B, The SITAR-derived mean curves for the velocity of acquisition of each growth parameter with increasing age are shown, stratified by sex and race. In B, the horizontal black line indicates zero velocity (ie, neither gain nor loss). aLST indicates appendicular lean soft tissue;
BMC, bone mineral content;
WB, whole body; and
WB LST, whole-body lean soft tissue.
Estimates of the Age and Magnitude of Peak Velocities
As summarized in Table 1 and Table 2, the mean age of PHV occurred significantly earlier in African American boys compared with non-African American boys (13.1 vs 13.4 years) (difference, −0.3 years, 95% CI, −0.4 to −0.1 years) and significantly earlier in African American girls compared with non-African American girls (11.0 vs 11.6 years) (difference, −0.6 years, 95% CI, −0.7 to −0.5 years). Age of peak acquisition of WB BMC was similar in African American boys compared with non-African American boys (14.0 vs 14.0 years) (difference, −0.0 years; 95% CI, −0.2 to 0.2 years). Age of peak acquisition of WB BMC was significantly younger in African American girls compared with non-African American girls (12.1vs12.4years) (difference, −0.3years; 95%CI, −0.4to−0.1years), and a similar pattern was observed at all skeletal sites. Model-derived estimates of peak velocity of WB BMC accrual lagged behind PHV by 0.6 to 0.9 years in boys and by 0.8 to 1.2 years in girls in this cohort (Figure 2). Figure 2 also shows that, before the age of peak velocity in each parameter, the relative pace of linear growth is faster than the relative pace of WB BMC accrual. For example, at age 7 years, height velocity is 62.9% to 76.3% of PHV, but WB BMC velocity is 27.8% to 31.9% of peak WB BMC velocity. In eFigure 1 in the Supplement, a consequence of this discrepancy is shown, namely, that the proportion of maximal observed value is larger for height than for bone. For example, at age 7 years, children had acquired 69.5% to 74.5% of maximal observed height but only 29.6% to 38.1% of maximal observed BMC. Also, both African American and non-African American boys at age 10 years have achieved 79.0% and 78.2%, respectively, of maximal observed height but only 41.2% and 39.7%, respectively, of maximal observed BMC.
Table 1.
Age of Peak Velocity for Linear Growth, Acquisition of Lean Mass, and Accrual of Site-Specific Bone Mineral Content (BMC), by Sex- and Race-Specific SITAR Modelinga
| Variable | Age of Peak Velocity, y | |||||
|---|---|---|---|---|---|---|
| African American Girls (n = 233) | Non-African American Girls (n = 789) | P Value for Difference | African American Boys (n = 246) | Non-African American Boys (n = 746) | P Value for Difference | |
| Height | 11.0 (10.8–11.1) | 11.6 (11.5–11.6) | <.001 | 13.1 (13.0–13.2) | 13.4 (13.3–13.4) | <.001 |
| WB LST | 10.9 (10.8–11.0) | 11.8 (11.7–11.8) | <.001 | 13.4 (13.3–13.5) | 13.7 (13.6–13.7) | .001 |
| aLST | 10.5 (10.3–10.7) | 11.5 (11.4–11.6) | <.001 | 13.2 (13.1–13.4) | 13.5 (13.4–13.6) | .007 |
| BMC | ||||||
| WB | 12.1 (12.0–12.3) | 12.4 (12.3–12.5) | .002 | 14.0 (13.8–14.1) | 14.0 (13.9–14.1) | .83 |
| Lumbar spine | 11.8 (11.6–11.9) | 12.5 (12.4–12.6) | <.001 | 14.1 (13.9–14.2) | 14.0 (13.9–14.1) | .37 |
| Total hip | 11.5 (11.3–11.6) | 12.2 (12.1–12.3) | <.001 | 13.7 (13.5–13.8) | 13.7 (13.6–13.8) | .40 |
| Femoral neck | 11.4 (11.3–11.6) | 11.8 (11.7–11.9) | <.001 | 13.7 (13.5–13.9) | 13.7 (13.6–13.8) | .77 |
| Distal one-third radius | 11.5 (11.4–11.7) | 12.2 (12.2–12.3) | <.001 | 13.7 (13.6–13.8) | 14.0 (13.9–14.1) | <.001 |
| Ultradistal radius | 13.0 (12.8–13.1) | 13.2 (13.1–13.3) | .005 | 14.9 (14.7–15.1) | 14.5 (14.4–14.6) | .001 |
Abbreviations: aLST, appendicular lean soft tissue; SITAR, superimposition by translation and rotation; WB, whole body; WB LST, whole-body lean soft tissue.
Data are presented as the means (95% CIs). Unadjusted P values are shown. P values less than .0028 (0.05 divided by 18 sex-stratified comparisons) meet the threshold for Bonferroni-adjusted statistical significance.
Table 2.
Magnitude of Peak Velocity for Linear Growth, Acquisition of Lean Mass, and Accrual of Site-Specific Bone Mineral Content (BMC), by Sex- and Race-Specific SITAR Modelinga
| Variable | Magnitude of Peak Velocity | |||||
|---|---|---|---|---|---|---|
| African American Girls (n = 233) | Non-African American Girls (n = 789) | P Value for Difference | African American Boys (n = 246) | Non-African American Boys (n = 746) | P Value for Difference | |
| Height, cm/y | 8.3 (8.1–8.4) | 7.9 (7.9–8.0) | <.001 | 9.5 (9.4–9.7) | 10.0 (10.0–10.1) | <.001 |
| WB LST, kg/y | 5.5 (5.3–5.6) | 5.3 (5.2–5.4) | .02 | 8.2 (8.0–8.4) | 8.1 (8.0–8.2) | .44 |
| aLST, kg/y | 2.4 (2.4–2.5) | 2.5 (2.4–2.5) | .16 | 4.0 (3.9–4.1) | 3.8 (3.8–3.9) | .002 |
| BMC, g/y | ||||||
| WB | 273 (266–280) | 277 (272–281) | .41 | 352 (343–362) | 348 (343–354) | .47 |
| Lumbar spine | 9.5 (9.2–9.9) | 8.7 (8.6–8.9) | <.001 | 10.6 (10.2–11.0) | 10.8 (10.6–11.0) | .24 |
| Total hip | 3.8 (3.6–3.9) | 4.3 (4.2–4.4) | <.001 | 6.5 (6.2–6.8) | 6.9 (6.7–7.0) | .03 |
| Femoral neck | 0.43 (0.42–0.44) | 0.44 (0.43–0.45) | .19 | 0.61 (0.59–0.62) | 0.63 (0.62–0.64) | .01 |
| Distal one-third radius | 0.17 (0.17–0.18) | 0.18 (0.18–0.19) | <.001 | 0.22 (0.21–0.23) | 0.24 (0.24–0.25) | <.001 |
| Ultradistal radius | 0.17 (0.17–0.18) | 0.17 (0.16–0.17) | .03 | 0.22 (0.21–0.22) | 0.21 (0.21–0.22) | .08 |
Abbreviations: aLST, appendicular lean soft tissue; SITAR, superimposition by translation and rotation; WB, whole body; WB LST, whole-body lean soft tissue.
Data are presented as the means (95% CIs). Unadjusted P values are shown. P values less than .0028 (0.05 divided by 18 sex-stratified comparisons) meet the threshold for Bonferroni-adjusted statistical significance.
Figure 2.
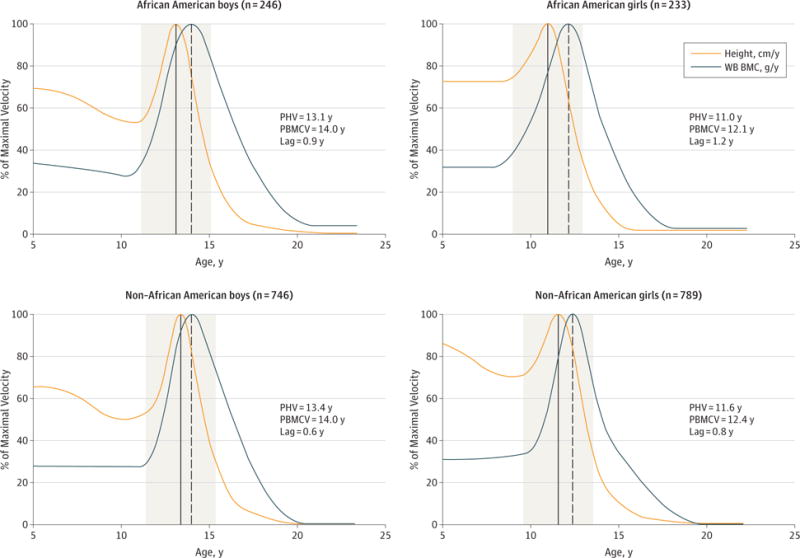
Relative Timing and Magnitude of Peak Height Velocity (PHV) and Peak Whole-Body Bone Mineral Content (WB BMC) Acquisition, by Sex and Self-reported Race
In each panel, the solid vertical line indicates the age of PHV, and the dashed vertical line indicates the age of peak WB BMC acquisition. The ages at which peak velocity in each of these parameters occurs, along with the lag between the 2, are also given. The 2 years before and 2 years after the PHV are shaded in gray. PBMCV indicates peak (whole-body) bone mineral content velocity.
Age at which peak velocity for the acquisition of each parameter occurs is shown in eFigure 2 in the Supplement. Overall, peak gains in total hip and femoral neck BMC occurred before peak gains in WB BMC, lumbar spine, and distal one-third radius. Peak gains in the ultradistal radius occurred last (Tables 1 and 2 and eFigure 2 in the Supplement).
We also examined the acquisition of these parameters relative to a common reference, PHV (Table 3, Figure 2, and eFigure 2 in the Supplement). We found that adolescents have attained 90.0% to 90.4% of maximal observed height and approximately 57.6% to 60.2% of maximal observed WB BMC by the time of their PHV (Table 3). The continued accretion of BMC for most skeletal sites in late adolescence up to age 20 years is shown in Figure 1B. Overall, approximately 32.7% to 35.8% of predicted maximal adult BMC was acquired in the 2 years before and 2 years after the age of PHV (Figure 2 and eTable 2 in the Supplement). Approximately 6.9% to 10.7% of maximal observed BMC is acquired in late adolescence after peak height has been achieved. The proportion of maximal observed BMC acquired in late adolescence also varies with skeletal site and was highest at the ultradistal radius, with 13.0% to 17.8% of maximal observed BMC attained after achievement of adult height. The SITAR-estimated age of peak velocity (ie, tempo) in growth in height, WB LST, and aLST show similar high correlations with site-specific BMC accrual (Pearson ρ range, 0.72–0.88 [ < .001] for all parameters).
Table 3.
Percentage of Maximal Observed Value in Height, Lean Mass, and Whole-Body and Site-Specific Bone Mineral Content (BMC) at the Mean Age of Peak Height Velocity, by Sex and Self-reported Race
| Variable | % of Maximal Observed Value | |||
|---|---|---|---|---|
| African American Girls (n = 233) | Non-African American Girls (n = 789) | African American Boys (n = 246) | Non-African American Boys (n = 746) | |
| Height | 90.4 | 90.1 | 90.3 | 90.0 |
| WB LST | 67.8 | 68.5 | 63.4 | 63.8 |
| aLST | 70.9 | 72.4 | 65.0 | 65.0 |
| BMC | ||||
| WB | 58.3 | 60.2 | 56.7 | 58.8 |
| Lumbar spine | 50.3 | 49.9 | 50.8 | 48.2 |
| Total hip | 64.4 | 65.4 | 59.6 | 57.7 |
| Femoral neck | 71.4 | 70.0 | 66.7 | 66.0 |
| Distal one-third radius | 68.3 | 68.2 | 61.5 | 63.5 |
| Ultradistal radius | 55.8 | 56.5 | 52.0 | 52.5 |
Abbreviations: aLST, appendicular lean soft tissue; WB, whole body; WB LST, whole-body lean soft tissue.
With respect to sexual maturation, we found that, in both girls and boys, earlier pubertal timing was associated with younger age of peak velocity as well as more rapid velocity; this pattern was consistent across growth parameters tested (eFigure 3 in the Supplement). Rates of fracture were highest in non-African American boys and overall lower in African American children (eFigure 4 in the Supplement). For the highest-risk group, non-African American boys, fracture rates were highest at approximately age 12.5 years before the age of PHV (13.4 years).
Discussion
We describe the timing and magnitude of peak acquisition in height, WB LST, aLST, WB and skeletal site–specific BMC acquisition, and puberty stage in a contemporary, multicenter, multiethnic cohort of healthy children, adolescents, and young adults. First, we report race-specific differences in the age and magnitude of peak gains in height, LST, and WB and skeletal site–specific BMC acquisition. Second, we demonstrate that, in the 2 years before and 2 years after PHV, adolescents gained approximately one-third of their observed maximal BMC. Through childhood, children have gained substantially less BMC relative to height, which may contribute to their increased incidence of fracture. Similar to previous analyses in this cohort,16 we observe this increased incidence of fracture before PHV most clearly in non-African American boys. Our analyses reveal strong associations between trajectories of both height and LST acquisition with BMC accrual. Most important, we illustrate the extended acquisition of bone that occurs well after the cessation of linear growth in both girls and boys.
Our results show similarities with another seminal study of the timing of peak bone mineral accrual. Specifically, the Saskatchewan Pediatric Bone Mineral Accrual Study was a 6-year longitudinal investigation, beginning in 1991, of 113 children of mostly white race who were aged 8 to 14 years at enrollment.17,18 The age of PHV estimates were similar to those obtained in the BMDCS for non-African American participants. The investigators found that adolescents had attained approximately 90% of adult height and approximately 60% of adult WB BMC by the time of their PHV, estimates that are also similar to those obtained in the BMDCS in non-African American participants. We show that earlier puberty is associated with more rapid physical maturation (eFigure 3 in the Supplement). It has long been known that the timing and magnitude of the velocity curve differs between children who are early, typical, and late maturing19; this phenomenon is captured well by the SITAR models. The present study adds substantially to this previous work in that it provides a more contemporary assessment of skeletal development and, most important, includes both estimates in African American children and at multiple skeletal sites.
We also observed sex- and race-specific differences in the acquisition of BMC and LST. These differences recapitulate patterns observed in the BMDCS5 and in other diverse cohorts.20,21 Overall, as expected, girls had lower BMC and LST than boys after peak linear growth, and peak acquisition of BMC and LST occurred sooner. With respect to race in both girls and boys, despite having similar heights, African American girls and African American boys had more WB LST, aLST, and BMC than their non-African American counterparts. In African American girls and boys, peak gain in height, WB LST, and aLST occurred earlier than in their non-African American counterparts; in African American girls, consistent differences were observed for BMC as well. Multiple previous studies have also demonstrated race-specific effects on bone development. For example, in a cross-sectional study,22 differences in cancellous vertebral bone density were significantly greater in African American girls in late puberty (34% vs 11% increase from prepubertal values). Our longitudinal study adds to these cross-sectional observations and suggests that race-specific differences in trajectories of BMC and LST acquisition may underlie the increased fracture prevalence among children16 and the higher rates of osteoporosis and hip fracture among adults of white race23 compared with African Americans.
To better understand determinants of bone health across the life span, we modeled the acquisition of BMC at various skeletal sites. This finding is important because skeletal sites can differ in many ways, including their exposure to weight-bearing forces and the relative contribution of cortical and trabecular bone to DXA estimates of aBMD. We found that, although growth patterns at specific sites were correlated, the timing of peak bone mineral accrual and the cessation of BMC acquisition differed by skeletal site (eFigure 2 in the Supplement). For total hip and femoral neck, the mean BMC accrual approached zero by age 20 years, particularly for female participants (ie, there was evidence of a cessation of BMC gain and the beginning of loss in early adulthood at these sites rich in trabecular bone) (Figure 1). Other investigations have shown that trabecular bone loss can occur in young adulthood, especially from the predominantly trabecular bone of the lumbar spine.24 In contrast, even after linear growth ceases, young adults continue to gain cortical bone, and cortical bone loss may not occur until the fourth or fifth decade of life.25,26 The persistence of BMC acquisition in the distal one-third radius that we observed after age 20 years in the BMDCS (Figure 1) may reflect ongoing gains in cortical bone.
Similar to previous investigations,17 we identified a lag between the acquisition of height and the acquisition of BMC relative to maximal observed values (Figure 2 and eFigure 1 in the Supplement). One possible consequence of this lag is that the proportional load borne by cortical bone decreases around the time of PHV, a period that corresponds in some investigations to peak epidemiological incidence of fracture.27 Most important, we found that in childhood, well before PHV, children gain height more rapidly than they accrue BMC. The slower rate of BMC relative to height acquisition in childhood may explain the epidemiological observation that the window of fracture vulnerability may begin many years before PHV. Indeed, we observed that, on average, in non-African American boys (the group that experienced the most fractures) the highest incidence of fracture was at approximately age 12.5 years, before the mean PHV. The lag typically observed between gains in height and bone may be due to the expansion in cortical thickness, cross-sectional area, and density that continues even after the cessation of linear growth.24,28 However, differences in lag do not appear to explain race-specific variations in fracture rates.
Strengths and Limitations
The present study has several important strengths and limitations. By design, the cohort is approximately 24% African American, which permits analysis of African American–specific associations. Although we used self-reported race, our group has previously shown that such report is associated with genetic ancestry.6 Use of the novel SITAR modeling strategy is another advantage because SITAR readily accommodates the range in the number and timing of measurements that can occur in a longitudinal study. In addition, by reducing the dimensionality of complex growth curves, SITAR facilitates the investigation of the influence of clinical covariates or even therapeutic interventions29 on growth. Inclusion of more participants in the third and fourth decades of life would likely improve the SITAR model fitting in late adolescence. We used DXA to estimate site-specific BMC. While DXA may not capture important dimensions of bone quality, DXA-based assessments are also used in clinical practice to evaluate bone health. However, future studies using newer imaging techniques should be undertaken. Also, it would be informative to ex tend these longitudinal observations into adulthood to explicitly evaluate the influence of developmental parameters on osteoporosis and fracture.
Conclusions
In summary, in a longitudinal cohort, we report sex and race differences in the size, tempo, and velocity of WB and skeletal site–specific BMC accrual. Consistent with historical reports in children of almost exclusively European descent, we found that all adolescents gained a substantial proportion of maximal observed BMC during pubertal growth. However, despite the clear importance of linear growth to bone health, we also found that, even after linear growth has ceased, approximately 6.9% to 10.7% of maximal observed WB BMC is accrued in late adolescence. We also found that, for many years before PHV, bone accretion proceeds at a modest pace compared with gains in height, which may contribute to the increased vulnerability to fracture that we observed, particularly in non-African American boys. A detailed understanding of sex and race associations, as well as the developmental timing of BMC accrual, is critical for the development of rational strategies to optimize peak bone mass.1
Supplementary Material
Key Points.
Question
How does the association between linear growth and bone accrual during childhood and adolescence affect bone health?
Findings
In this mixed longitudinal study of 2014 healthy children, adolescents, and young adults using an innovative approach to model growth in a diverse cohort, we found that, at age 7 years, children had acquired 69.5% to 74.5% of maximal observed height but only 29.6% to 38.1% of maximal observed whole-body bone mineral content. Also, adolescents gained 32.7% to 35.8% of maximal observed whole-body bone mineral content during the 4 years around peak height velocity and another 6.9% to 10.7% of maximal observed whole-body bone mineral content in late adolescence, even after linear growth had ceased.
Meaning
The important physiological lag between gains in bone and gains in height may contribute to the increased risk for fracture in childhood and indicates that late adolescence represents a potentially underrecognized opportunity for clinical and public health interventions to maximize peak bone mass.
Acknowledgments
Funding/Support
The Bone Mineral Density in Childhood Study was funded by grantsR01 HD58886 and R01 HD076321 from the Eunice Kennedy Shriver National Institute of Child Health and Human Development (NICHD); NICHD contracts N01-HD-1-3228, N01-HD-1-3329, N01-HD-1-3330, N01-HD-1-3331, N01-HD-1-3332, and N01-HD-1-3333; and the Clinical and Translational Science Award program grant 8 UL1 TR000077. Additional support was provided by grant R01 HD056465 from the NICHD (Dr Grant); grant DK102659-01 from the National Institute of Diabetes and Digestive and Kidney Diseases; the Pediatric Endocrine Society Clinical Scholars Award; a Children’s Hospital of Philadelphia Metabolism, Nutrition, and Development Research Affinity Group Pilot and Feasibility Grant (Dr McCormack); and the Daniel B. Burke Endowed Chair for Diabetes Research (Dr Grant).
Role of the Funder/Sponsor
Dr Winer, who is affiliated with the Eunice Kennedy Shriver NICHD, which was a key sponsor of the research, was involved in the design and conduct of the study; collection, management, analysis, and interpretation of the data; preparation, review, and approval of the manuscript; and decision to submit the manuscript for publication. No other funding agencies were involved in these activities.
Footnotes
Author Contributions
Dr McCormack had full access to all of the data in the study and takes responsibility for the integrity of the data and the accuracy of the data analysis.
Study concept and design: McCormack, Cousminer, Mitchell, Oberfield, Kelly, Grant, Zemel.
Acquisition, analysis, or interpretation of data: All authors.
Drafting of the manuscript: McCormack, Grant, Zemel.
Critical revision of the manuscript for important intellectual content: All authors.
Statistical analysis: McCormack, Cousminer, Chesi, Zemel.
Obtained funding: Kalkwarf, Lappe, Grant, Zemel. Administrative, technical, or material support: Kalkwarf, Lappe, Oberfield, Shepherd, Winer, Grant. Study supervision: Roy, Kalkwarf, Lappe, Gilsanz, Oberfield, Grant, Zemel.
Conflict of Interest Disclosures
None reported.
Additional Contributions
Timothy J. Cole, PhD (Institute of Child Health, University College London), provided helpful discussions regarding the superimposition by translation and rotation (SITAR) modeling. No compensation was received.
Contributor Information
Shana E. McCormack, Division of Endocrinology and Diabetes, Department of Pediatrics, The Children’s Hospital of Philadelphia, Perelman School of Medicine, University of Pennsylvania, Philadelphia.
Diana L. Cousminer, Division of Human Genetics, Department of Pediatrics, The Children’s Hospital of Philadelphia, Perelman School of Medicine, University of Pennsylvania, Philadelphia.
Alessandra Chesi, Division of Human Genetics, Department of Pediatrics, The Children’s Hospital of Philadelphia, Perelman School of Medicine, University of Pennsylvania, Philadelphia.
Jonathan A. Mitchell, Division of Gastroenterology, Hepatology and Nutrition, Department of Pediatrics, The Children’s Hospital of Philadelphia, Perelman School of Medicine, University of Pennsylvania, Philadelphia.
Sani M. Roy, Division of Endocrinology, Department of Pediatrics, Cook Children’s Medical Center, Fort Worth, Texas.
Heidi J. Kalkwarf, Division of Gastroenterology, Hepatology and Nutrition, Department of Pediatrics, Cincinnati Children’s Hospital Medical Center, University of Cincinnati College of Medicine, Cincinnati, Ohio.
Joan M. Lappe, College of Nursing, Creighton University, Omaha, NebraskaOsteoporosis Research Center, School of Medicine, Creighton University, Omaha, Nebraska.
Vicente Gilsanz, Department of Radiology, Children’s Hospital Los Angeles, Keck School of Medicine of USC, University of Southern California, Los AngelesDepartment of Pediatrics, Children’s Hospital Los Angeles, Keck School of Medicine of USC, University of Southern California, Los Angeles.
Sharon E. Oberfield, Division of Pediatric Endocrinology, Diabetes and Metabolism, Department of Pediatrics, Columbia University, New York, New York.
John A. Shepherd, Department of Radiology and Biomedical Imaging, University of California, San Francisco.
Karen K. Winer, Pediatric Growth and Nutrition Branch, Eunice Kennedy Shriver National Institute of Child Health and Human Development (NICHD), National Institutes of Health, Bethesda, Maryland.
Andrea Kelly, Division of Endocrinology and Diabetes, Department of Pediatrics, The Children’s Hospital of Philadelphia, Perelman School of Medicine, University of Pennsylvania, Philadelphia.
Struan F. A. Grant, Division of Endocrinology and Diabetes, Department of Pediatrics, The Children’s Hospital of Philadelphia, Perelman School of Medicine, University of Pennsylvania, PhiladelphiaDivision of Human Genetics, Department of Pediatrics, The Children’s Hospital of Philadelphia, Perelman School of Medicine, University of Pennsylvania, Philadelphia.
Babette S. Zemel, Division of Gastroenterology, Hepatology and Nutrition, Department of Pediatrics, The Children’s Hospital of Philadelphia, Perelman School of Medicine, University of Pennsylvania, Philadelphia.
References
- 1.Weaver CM, Gordon CM, Janz KF, et al. The National Osteoporosis Foundation’s position statement on peak bone mass development and lifestyle factors: a systematic review and implementation recommendations. Osteoporos Int. 2016;27(4):1281–1386. doi: 10.1007/s00198-015-3440-3. [DOI] [PMC free article] [PubMed] [Google Scholar]
- 2.Faulkner RA, Davison KS, Bailey DA, Mirwald RL, Baxter-Jones AD. Size-corrected BMD decreases during peak linear growth: implications for fracture incidence during adolescence. J Bone Miner Res. 2006;21(12):1864–1870. doi: 10.1359/jbmr.060907. [DOI] [PubMed] [Google Scholar]
- 3.Jackowski SA, Faulkner RA, Farthing JP, Kontulainen SA, Beck TJ, Baxter-Jones AD. Peak lean tissue mass accrual precedes changes in bone strength indices at the proximal femur during the pubertal growth spurt. Bone. 2009;44(6):1186–1190. doi: 10.1016/j.bone.2009.02.008. [DOI] [PubMed] [Google Scholar]
- 4.Jackowski SA, Lanovaz JL, Van Oort C, Baxter-Jones AD. Does lean tissue mass accrual during adolescence influence bone structural strength at the proximal femur in young adulthood? Osteoporos Int. 2014;25(4):1297–1304. doi: 10.1007/s00198-013-2592-2. [DOI] [PubMed] [Google Scholar]
- 5.Zemel BS, Kalkwarf HJ, Gilsanz V, et al. Revised reference curves for bone mineral content and areal bone mineral density according to age and sex for black and non-black children: results of the Bone Mineral Density in Childhood Study [published correction appears in J Clin Endocrinol Metab. 2013;98(1):420] J Clin Endocrinol Metab. 2011;96(10):3160–3169. doi: 10.1210/jc.2011-1111. [DOI] [PMC free article] [PubMed] [Google Scholar]
- 6.McCormack SE, Chesi A, Mitchell JA, et al. Relative skeletal maturation and population ancestry in nonobese children and adolescents. J Bone Miner Res. 2017;32(1):115–124. doi: 10.1002/jbmr.2914. [DOI] [PMC free article] [PubMed] [Google Scholar]
- 7.Dorsey KB, Thornton JC, Heymsfield SB, Gallagher D. Greater lean tissue and skeletal muscle mass are associated with higher bone mineral content in children. Nutr Metab (Lond) 2010;7:41. doi: 10.1186/1743-7075-7-41. [DOI] [PMC free article] [PubMed] [Google Scholar]
- 8.Cole TJ, Donaldson MD, Ben-Shlomo Y. SITAR: a useful instrument for growth curve analysis. Int J Epidemiol. 2010;39(6):1558–1566. doi: 10.1093/ije/dyq115. [DOI] [PMC free article] [PubMed] [Google Scholar]
- 9.Kuczmarski RJ, Ogden CL, Guo SS, et al. CDC growth charts for the United States: methods and development. Vital Health Stat 11. 2000;2002(246):1–190. [PubMed] [Google Scholar]
- 10.Zemel BS, Leonard MB, Kelly A, et al. Height adjustment in assessing dual energy x-ray absorptiometry measurements of bone mass and density in children. J Clin Endocrinol Metab. 2010;95(3):1265–1273. doi: 10.1210/jc.2009-2057. [DOI] [PMC free article] [PubMed] [Google Scholar]
- 11.Cole TJ, Rousham EK, Hawley NL, Cameron N, Norris SA, Pettifor JM. Ethnic and sex differences in skeletal maturation among the Birth to Twenty cohort in South Africa. Arch Dis Child. 2015;100(2):138–143. doi: 10.1136/archdischild-2014-306399. [DOI] [PMC free article] [PubMed] [Google Scholar]
- 12.Cole TJ, Pan H, Butler GE. A mixed effects model to estimate timing and intensity of pubertal growth from height and secondary sexual characteristics. Ann Hum Biol. 2014;41(1):76–83. doi: 10.3109/03014460.2013.856472. [DOI] [PMC free article] [PubMed] [Google Scholar]
- 13.Kelly A, Winer KK, Kalkwarf H, et al. Age-based reference ranges for annual height velocity in US children. J Clin Endocrinol Metab. 2014;99(6):2104–2112. doi: 10.1210/jc.2013-4455. [DOI] [PMC free article] [PubMed] [Google Scholar]
- 14.R Core Team. R: A Language and Environment for Statistical Computing [computer program] Vienna, Austria: R Foundation for Statistical Computing; http://www.R-project.org/. Published 2013 Accessed May 24, 2017. [Google Scholar]
- 15.Cole T. SITAR extension package for R version 1.0.2. CRAN Repository; Superimposition by Translation and Rotation Growth Curve Analysis [computer program] https://github.com/statist7/sitar. Published April 21, 2015 Accessed May 24, 2017. [Google Scholar]
- 16.Wren TA, Shepherd JA, Kalkwarf HJ, et al. Racial disparity in fracture risk between white and nonwhite children in the United States. J Pediatr. 2012;161(6):1035–1040. doi: 10.1016/j.jpeds.2012.07.054. [DOI] [PMC free article] [PubMed] [Google Scholar]
- 17.Bailey DA. The Saskatchewan Pediatric Bone Mineral Accrual Study: bone mineral acquisition during the growing years. Int J Sports Med. 1997;18(suppl 3):S191–S194. doi: 10.1055/s-2007-972713. [DOI] [PubMed] [Google Scholar]
- 18.Bailey DA, McKay HA, Mirwald RL, Crocker PR, Faulkner RA. A six-year longitudinal study of the relationship of physical activity to bone mineral accrual in growing children: the University of Saskatchewan Bone Mineral Accrual Study. J Bone Miner Res. 1999;14(10):1672–1679. doi: 10.1359/jbmr.1999.14.10.1672. [DOI] [PubMed] [Google Scholar]
- 19.Tanner JM, Whitehouse RH, Takaishi M. Standards from birth to maturity for height, weight, height velocity, and weight velocity: British children, 1965, I. Arch Dis Child. 1966;41(219):454–471. doi: 10.1136/adc.41.219.454. [DOI] [PMC free article] [PubMed] [Google Scholar]
- 20.Weber DR, Moore RH, Leonard MB, Zemel BS. Fat and lean BMI reference curves in children and adolescents and their utility in identifying excess adiposity compared with BMI and percentage body fat. Am J Clin Nutr. 2013;98(1):49–56. doi: 10.3945/ajcn.112.053611. [DOI] [PMC free article] [PubMed] [Google Scholar]
- 21.Looker AC, Melton LJ, III, Harris T, Borrud L, Shepherd J, McGowan J. Age, gender, and race/ethnic differences in total body and subregional bone density. Osteoporos Int. 2009;20(7):1141–1149. doi: 10.1007/s00198-008-0809-6. [DOI] [PMC free article] [PubMed] [Google Scholar]
- 22.Gilsanz V, Roe TF, Mora S, Costin G, Goodman WG. Changes in vertebral bone density in black girls and white girls during childhood and puberty. N Engl J Med. 1991;325(23):1597–1600. doi: 10.1056/NEJM199112053252302. [DOI] [PubMed] [Google Scholar]
- 23.Karagas MR, Lu-Yao GL, Barrett JA, Beach ML, Baron JA. Heterogeneity of hip fracture: age, race, sex, and geographic patterns of femoral neck and trochanteric fractures among the US elderly. Am J Epidemiol. 1996;143(7):677–682. doi: 10.1093/oxfordjournals.aje.a008800. [DOI] [PubMed] [Google Scholar]
- 24.Riggs BL, Melton LJ, Robb RA, et al. A population-based assessment of rates of bone loss at multiple skeletal sites: evidence for substantial trabecular bone loss in young adult women and men. J Bone Miner Res. 2008;23(2):205–214. doi: 10.1359/JBMR.071020. [DOI] [PMC free article] [PubMed] [Google Scholar]
- 25.Khosla S, Riggs BL, Atkinson EJ, et al. Effects of sex and age on bone microstructure at the ultradistal radius: a population-based noninvasive in vivo assessment. J Bone Miner Res. 2006;21(1):124–131. doi: 10.1359/JBMR.050916. [DOI] [PMC free article] [PubMed] [Google Scholar]
- 26.Khosla S, Melton LJ, III, Achenbach SJ, Oberg AL, Riggs BL. Hormonal and biochemical determinants of trabecular microstructure at the ultradistal radius in women and men. J Clin Endocrinol Metab. 2006;91(3):885–891. doi: 10.1210/jc.2005-2065. [DOI] [PubMed] [Google Scholar]
- 27.Bailey DA, Wedge JH, McCulloch RG, Martin AD, Bernhardson SC. Epidemiology of fractures of the distal end of the radius in children as associated with growth. J Bone Joint Surg Am. 1989;71(8):1225–1231. [PubMed] [Google Scholar]
- 28.Xu L, Nicholson P, Wang Q, Alén M, Cheng S. Bone and muscle development during puberty in girls: a seven-year longitudinal study. J Bone Miner Res. 2009;24(10):1693–1698. doi: 10.1359/jbmr.090405. [DOI] [PubMed] [Google Scholar]
- 29.Gault EJ, Perry RJ, Cole TJ, et al. British Society for Paediatric Endocrinology and Diabetes Effect of oxandrolone and timing of pubertal induction on final height in Turner’s syndrome: randomised, double blind, placebo controlled trial. BMJ. 2011;342:d1980. doi: 10.1136/bmj.d1980. [DOI] [PMC free article] [PubMed] [Google Scholar]
Associated Data
This section collects any data citations, data availability statements, or supplementary materials included in this article.