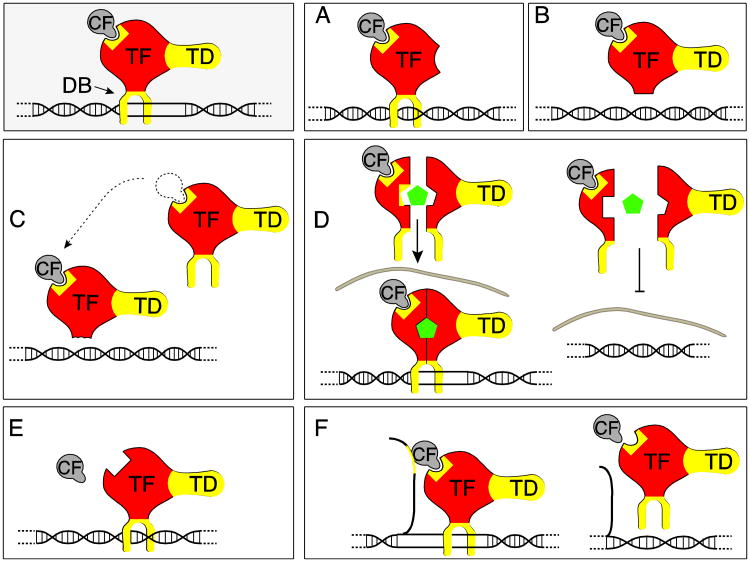
Figure 3. Changes in transcription factors.
The gray box schematically depicts the general structure of a transcription factor complex. TD: transactivation domain; CF: Co-factor; TF: core transcription factor, DB: DNA binding domain. Components of transcription factors that undergo alternative splicing with well-studied effects are indicated in yellow. The numbering (A-F) of the Figure refers to Table 2 that lists specific examples.
A. Change in transactivation domain
B. Loss in DNA binding
C. Generation of dominant negative isoforms, here a factor that lost its DNA binding domain, but can still compete for cofactors (indicated by arrow).
D. Alternative splicing of nuclear recpetors. In this example, the ligand binding domain is subject to alternative splicing (yellow area) that interferes with ligand binding (green pentagon), which regulates translocation of the dimerized receptor complex into the nucleus (indicated by gray nuclear membrane).
E. The binding of transcriptional cofactors is regulated by alternative splicing.
F. ncRNAs can direct transcription factors to DNA, which is regulated by alternative splicing of the ncRNAs.

