Abstract
The biologic activity of IgG molecules is modulated by its crystallizable fragment N-glycosylation, and thus, the analysis of IgG glycosylation is critical. A standard approach to analyze glycosylation of IgGs involves the release of the N-glycans by the enzyme peptide N-glycosidase F, which cleaves the linkage between the asparagine residue and innermost N-acetylglucosamine (GlcNAc) of all N-glycans except those containing a 3-linked fucose attached to the reducing terminal GlcNAc residue. The importance of obtaining complete glycan release for accurate quantitation led us to investigate the kinetics of this de-glycosylation reaction for IgG glycopeptides and to determine the effect of glycan structure and amino acid sequence on the rate of glycan release from glycopeptides of IgGs. This study revealed that the slight differences in amino acid sequences did not lead to a statistically different deglycosylation rate. However, statistically significant differences in the deglycosylation rate constants were observed between glycopeptides differing only in glycan structure (i.e., nonfucosylated, fucosylated, bisecting-GlcNAc, sialylated, etc.). For example, a single sialic acid residue was found to decrease the rate by a factor of 3. Similar reductions in rate were associated with the presence of a bisecting-GlcNAc. We predict the differences in release kinetics can lead to significant quantitative variations of the glycosylation study of IgGs.
Keywords: Antibody, de-glycsoylation, LC-MS, HILIC
INTRODUCTION
Igs encompass the major class of the serum glycoprotein that is used by the adaptive immune system to identify and neutralize pathogens. IgG is one of the five distinct classes (IgG, IgM, IgA, IgE, and IgD) observed in humans. IgG is a complex glycoprotein built from four peptide chains that are two identical class 𝛾 heavy chains of ∼50 kDa and two identical light chains of ∼25 kDa arranged in a “Y” shape. There are 4 subclasses of IgGs (IgG1, IgG2, IgG3, and IgG4) that are based on conserved domains of their polypeptide chains. However, all IgG subclasses possess an N-glycosylation site at asparagine (Asn) 297 in the conserved C𝛾2 domain of the crystallizable fragment (Fc) part of the heavy chains. The N-glycans, found on IgG, are predominantly a core-fucosylated complex biantennary structure. The biantennary, core-fucosylated structure possess from 0 to 2 galactose residues, and these structures are referred to as G0–2 in a common nomenclature. Additional glycan populations carry terminal 𝛼2–6-linked sialic acids (SAs) and/or a bisecting-N-acetylglucosamine (GlcNAc).
The Fc N-glycosylation modulates the biologic activity of IgGs. Many reports have shown that the absence of core fucose on Fc N-glycans of IgG1 may lead to dramatic enhancement of antibody-dependent cellular cytotoxicity.1–4 The anti-inflammatory properties of intravenous Ig depend on sialylation of the Fc N-glycans.5 In healthy individuals, IgG glycosylation features correlate to age, gender, and pregnancy. For example, IgG is less galactosylated in both children and the elderly.6 The G0 glycoform (“agalactosyl” IgG) is unusually abundant in patients with various infectious diseases and chronic inflammation, which include rheumatoid arthritis, juvenile chronic arthritis, active Crohn’s disease, tuberculosis, Lyme disease, and sarcoidosis.7, 8 The biologic significance establishes the need for strategies to analyze these glycans accurately.
A standard approach to analyze IgG glycosylation involves the release of N-glycans from the protein backbone. Glycans can be released by enzymatic or chemical means. The chemical release procedures can degrade the peptide backbone and have potential to degrade the oligosaccharides. Consequently, chemical hydrolysis for the liberation of N-glycans is not widely used. The most commonly used enzyme for releasing intact N-glycans is peptide N-glycosidase F (PNGase F),9–22 which cleaves the linkage between the Asns residue and the innermost GlcNAc of N-linked glycans. This enzyme is reported to cleave all N-linked glycans except those containing a 3-linked fucose attached to the reducing terminal GlcNAc residue, which is not found in mammals.23 Consequently, this enzyme releases all mammalian N-linked glycans, which has led to its widespread use in the analysis of glycoproteins, such as IgGs. Accurate quantitation necessitates either complete release of all glycans or for relative quantitation, that the extent of glycan release is the same for all glycans on all sites. Quantitative glycan studies typically assume that one or both of these conditions are met; however, there has been minimal experimental evidence to support this assumption.
We investigated the kinetics of glycan release from glycopeptides of IgGs to determine the effect of glycan structure and amino acid sequence on the rate of glycan release for these model peptides. We had previously observed that the PNGase F release step typically introduces a large source of quantitative variation, which could be explained by different glycans being released at different rates. We pursued a more detailed study of this enzyme system and predict that the observed differences in the kinetics of PNGase F, released based on glycan structure, will be of interest to researchers investigating IgG glycosylation and those performing glycan quantification on other glycoproteins.
Moreover, with the use of both neuraminidase treatment and enrichment of sialylated species by lectin affinity chromatography, they showed that sialylated IgGs, as well as sialylated IgG Fc moieties, are much more potent in preventing pathology.
MATERIALS AND METHODS
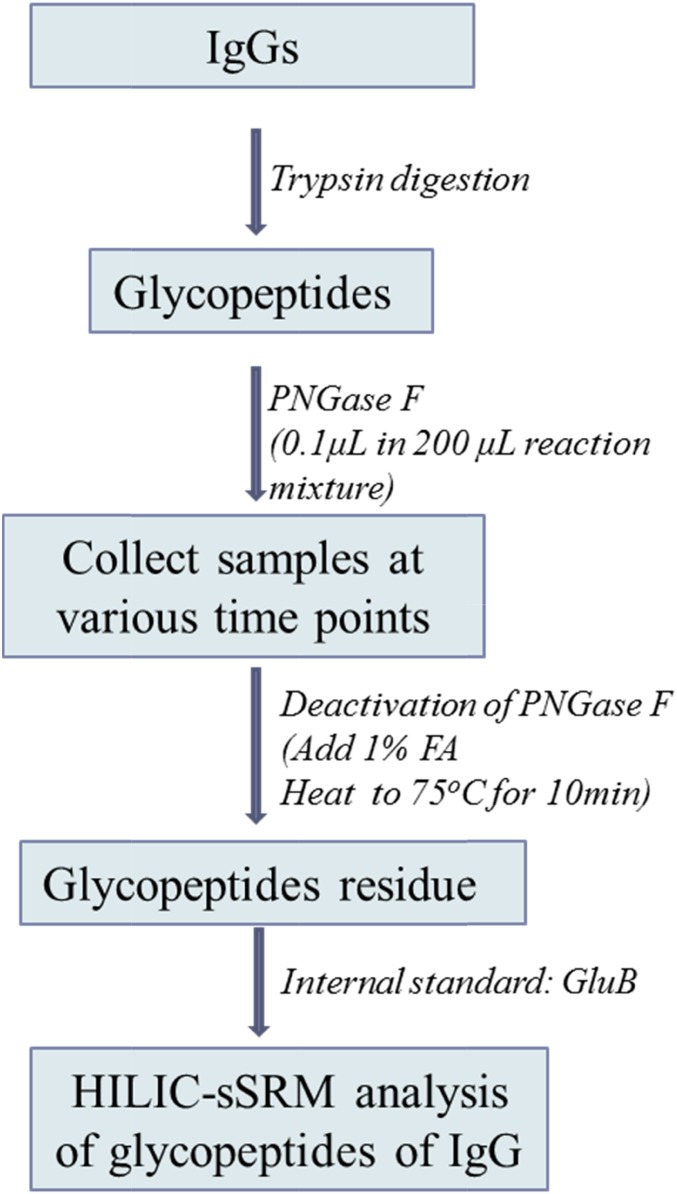
The overall experimental procedure is illustrated in Fig. 1. The details of the experimental procedure are described in the following paragraphs.
FIGURE 1.
The experimental workflow used to study the kinetics of the PNGase F deglycosylation reaction.
Human serum, trypsin (tosyl phenylalanyl chloromethyl ketone treated), dl-DTT, iodoacetamide, ammonium bicarbonate, ammonium formate, and formic acid [for liquid chromatography (LC)-mass spectrometry (MS)] were purchased from Sigma-Aldrich (St. Louis, MO, USA). PNGase F (glycerol free) was purchased from New England BioLabs (Ipswich, MA, USA). Acetonitrile (ACN; HPLC grade) was purchased from Thermo Fisher Scientific (Waltham, MA, USA). Octadecyl (C18)-disposable extraction columns (J.T.Baker) were purchased from Avantor (Center Valley, PA, USA). Other reagents were analytical grade.
A 200 μl aliquot of human serum was lyophilized to dryness (dried human serum weighed 14 mg) and resuspended in 200 μl of 50 mM ammonium bicarbonate. DTT (5 μl of 200 mM) was added to the sample solution to reduce the disulfide bonds. Sulfhydryl alkylation was carried out by adding 4 μl of 1 M iodoacetamide to the sample. The excess iodoacetamide was neutralized by adding 20 μl of 200 mM DTT. Trypsin was added to the sample with the ratio of 1 part trypsin to 20 parts sample, and digestion was carried out at 37°C overnight, followed by incubation of the sample at 75°C for 5 min to denature the trypsin. The trypsin digest was loaded onto a Sep-Pak C18, which had been pre-equilibrated in 5% acetic acid. The sample was eluted with 5 ml of 65% ACN in 5% acetic acid, which was collected, frozen, and lyophilized to dryness.
The dried tryptic digest was dissolved in 200 μl of 50 mM ammonium bicarbonate. [Glu1]-Fibrinopeptide B (GluFib) was spiked into the sample and served as an internal standard for quantification. The dissolved peptides/glycopeptides were then treated with 500 U (0.1 μl) of PNGase F. Aliquots of the digestion mixture were removed at various time points, quenched by lowering the pH to 4 with formic acid, and then quickly heated to 75°C to inactivate the PNGase F, after which, the samples were immediately frozen in a dry ice/acetone bath.
These aliquots collected from the PNGase F digestion mixture were analyzed by LC-MS using a 2.1 mm Penta ID hydrophilic interaction LC column (Advanced Materials Technology Wilmington, DE, USA) on a Nexera LC (Shimadzu, Kyoto, Japan) system interfaced to a QTRAP 4000 mass analyzer (SCIEX, Framingham, MA, USA). Sufficient ACN was added to each sample so that its final concentration was 65% (ACN) in water. Separation was carried out at a flow rate of 0.4 ml/min at 60°C with a mobile phase A consisting of water:ACN (95:5 v/v) with 50 mM ammonium formate (adjusted to pH 4.4 with formic acid) and mobile phase B as pure ACN. A segmented linear gradient was used: 1) 62% mobile phase B to 61.2% mobile phase B in 9 min, 2) 61.2% mobile phase B to 60.2% mobile phase B in 10 min, and 3) 60.2% mobile phase B to 58% mobile phase B in 11 min. In each case, the column was flushed at 25% mobile phase for 5 min before returning to the starting mobile phase composition.
Scheduled selected reaction monitoring (SRM) mode on a QTRAP 4000 mass analyzer was used to quantitate the most abundant glycoforms for each tryptic IgG glycopeptide and the deglycosylated form of these peptides. The masses of glycopeptides of human serum IgGs (precursor masses) were calculated by adding the masses of targeted N-glycans to the masses of targeted tryptic peptides containing the N-glycosylation sites of interest. The mass-to-charge ratio values used as precursors (Q1 ions) in the SRM experiments performed on the glycopeptides of the human serum IgGs are listed in Supplemental Table 1. MS/MS experiments conducted on the various glycopeptides revealed that each produced 2 intense fragment ions. The common fragment at mass-to-charge ratio 365.7 corresponds to the oxonium ion of hexose-N-acetylhexoseamine. The other intense fragment ion corresponds to the complete peptide backbone for the selected precursor, combined with a single GlcNAc attached. These two fragment ions were used in the SRM experiment for all of the glycopeptides as Q3 transition ions and significantly reduced the possibility of false positives. Retention times were found experimentally for all of the glycopeptides, and these are listed in Supplemental Table 2. The detection window set for each transition is 3 min. A collision energy of 70 V and declustering potential of 40 V were selected as an appropriate compromise between selected ion intensity and background current. The dwell time for data collection was set at 100 ms, and unit resolution was used in both Q1 and Q3.
RESULTS AND DISCUSSION
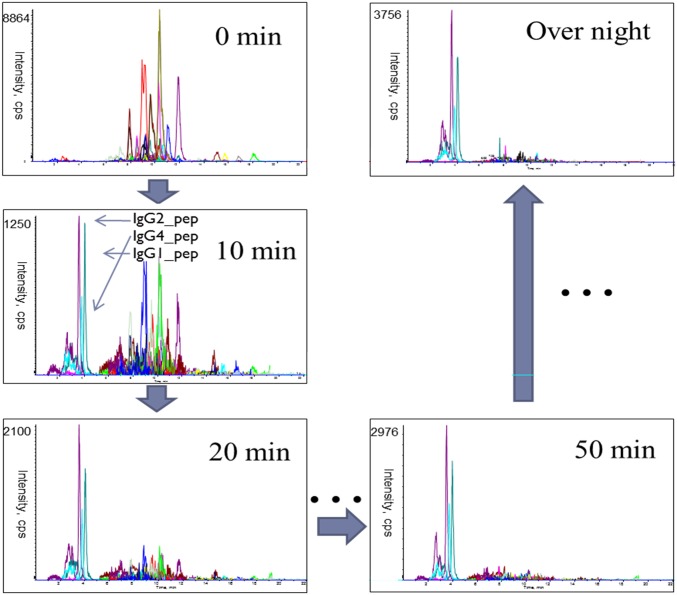
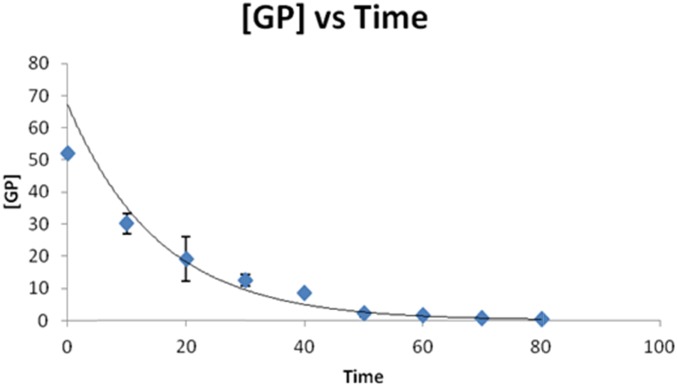
The kinetics of PNGase F deglycosylation reaction were studied by its addition to a solution containing tryptic digested human serum containing IgG glycopeptides and by the monitoring of the release of their glycans. This process allowed a broad range of human serum IgG glycopeptides to be analyzed simultaneously by LC-SRM. This study was performed on glycopeptides, as opposed to glycoproteins, as our typical PNGase F de-glycosylation protocol is carried out on trypsin-digested glycoproteins to minimize the effects of steric hindrance caused by the protein’s higher-order structure and because the smaller glycopeptides are directly amenable to LC-SRM quantitation. The LC-SRM chromatograms (Fig. 2) demonstrate that the peaks from the glycopeptides decrease with increasing digestion times, whereas those corresponding to the deglycosylated peptide increase with time. The integrated peak area of each glycopeptide divided by the integrated peak area of internal standard (GluB) from each time point reflects the concentration of glycopeptide ([GP]). The disappearance of the glycopeptides can be viewed in plots of [GP] as a function of time, as shown by the decay profile (Fig. 3) of the IgG1 glycopeptide carrying the fucosylated glycan, with 0 galactoses (H3N4F1), shown here as an example.
FIGURE 2.
The LC-SRM chromatograms show the appearance of de-glycosylated peptides and the disappearance of glycopeptide in the sample from 0 min to overnight.
FIGURE 3.
The decay profile of the IgG1 glycopeptide carrying the fucosylated glycan with 0 galactoses (H3N4F1) following the addition of PNGase F at a concentration of 2.5 U/μl. The [GP] signal was obtained by dividing the peak area of this glycopeptide by the integrated peak area of internal standard (GluFib) at each time point.
PNGase F releases N-linked glycans from the peptide backbone by hydrolyzing the amide group of the Asn side-chain, as shown in the reaction in Eq. 1. As an enzyme, PNGase F is neither consumed nor produced during the reaction, and therefore, its concentration stays constant. The concentration of H2O is much greater than that of the other two reactants and remains constant throughout the process. Therefore, this third-order reaction corresponds to a pseudo first-order process (see reaction in Eq. 2). The differential rate equation describing the decrease in glycopeptide concentration as a function of time (−d[GP]/dt) for a pseudo first-order kinetics is given in Eq. 3, and its integrated form is shown in Eq. 4. In Eqs. 3 and 4, k is the rate constant.
| (1) |
| (2) |
| (3) |
| (4) |
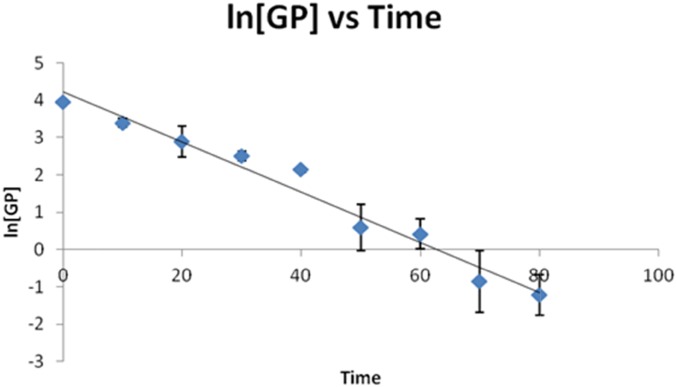
The plotting of the natural log of [GP] (ln[GP]) with respect to time yields a straight line, as shown for the IgG1 glycopeptide carrying the fucosylated glycan with 0 galactoses (H3N4F1; Fig. 4). This linearity confirms that the PNGase F de-glycosylation reaction can be modeled as a pseudo first-order process and allows a rate constant for the deglycosylation of each glycopeptide to be determined by calculating the slope of ln[GP] vs. time plots.
FIGURE 4.
The plot of ln[GP] vs. time for the IgG1 glycopeptide carrying the fucosylated glycan with 0 galactoses (H3N4F1). These data were obtained following the addition of PNGase F at a concentration of 2.5 U/μl. The [GP] signal was achieved by dividing the peak area of this glycopeptide by the integrated peak area of internal standard (GluFib) at each time point.
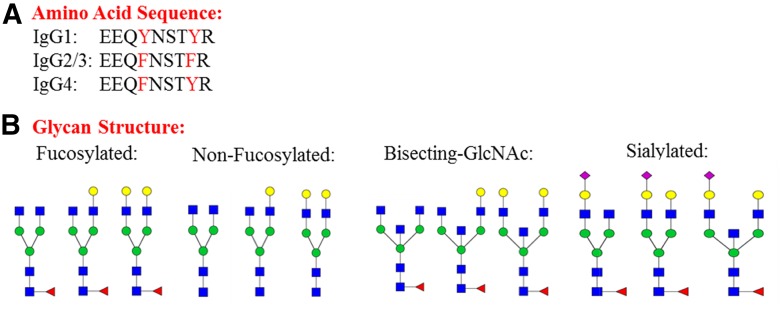
The effects of the glycan structure on the rate of glycan release were investigated. The heterogeneity of glycan structures attached to human serum IgGs makes this a good system to study the effect of glycan structure on the rate of glycan release. The glycan structures of the abundant glycopeptides detected on IgGs were categorized into 4 groups: fucosylated, nonfucosylated, bisecting-GlcNAc, and sialylated as shown in Fig. 5. The fucosylated and nonfucosylated glycoforms only differ by the presence/absence of a core fucose, so the comparison between releasing rate of fucosylated and nonfucosylated glycoforms can reveal the effect of core fucose on PNGase F releasing rate. Similar comparisons can be made among fucosylated, bisecting-GlcNAc, and sialylated glycoforms. The effect of bisecting-GlcNAc can be found by comparison between the releasing rate of fucosylated and bisecting-GlcNAc glycoforms; as well, the effect of terminal SA can be studied by comparing releasing rate of fucosylated and sialylated glycopeptides.
FIGURE 5.
The amino acid sequences of the tryptic glycopeptide of IgG1, IgG2/3, and IgG4 and the glycan structures investigated, which were categorized into 4 groups: fucosylated, nonfucosylated, bisecting-GlcNAc, and sialylated.
The amino acid sequences of the tryptic peptides are different among the IgG subclasses (IgG1, IgG2/3, and IgG4). The sequences of IgG2/3 (EEQFNSTFR), IgG4 (EEQFNSTYR), and IgG1 (EEQYNSTYR) differ by a phenylalanine (F) to tyrosine (Y) substitution at one or two locations (Fig. 5). The effect of these minor peptide sequence differences on PNGase F release can be revealed by comparing the deglycosylation rates of glycopeptides with same glycoforms but different peptide backbones.
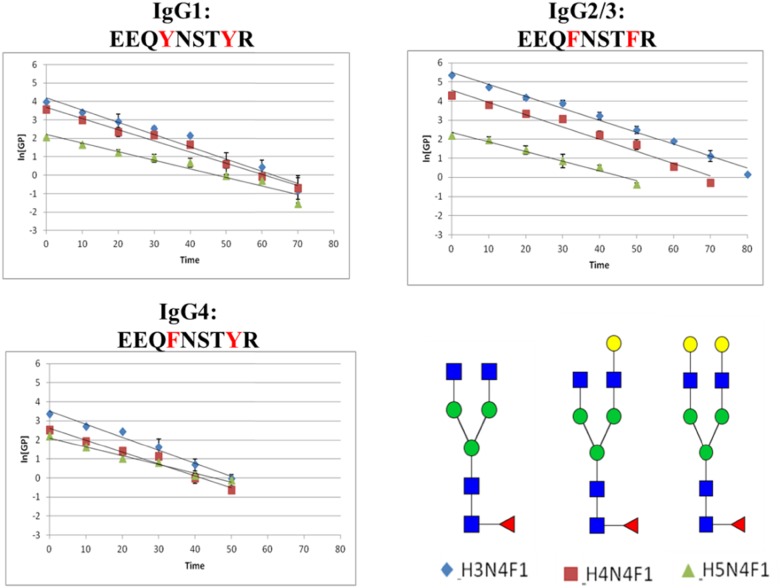
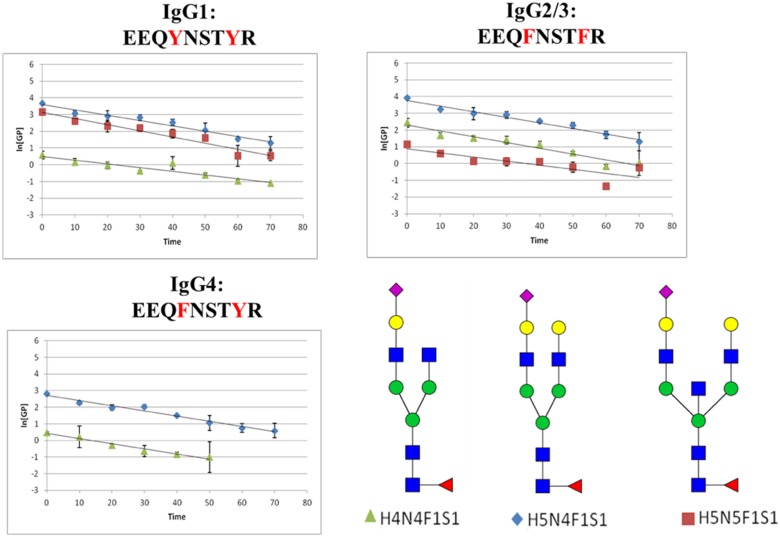
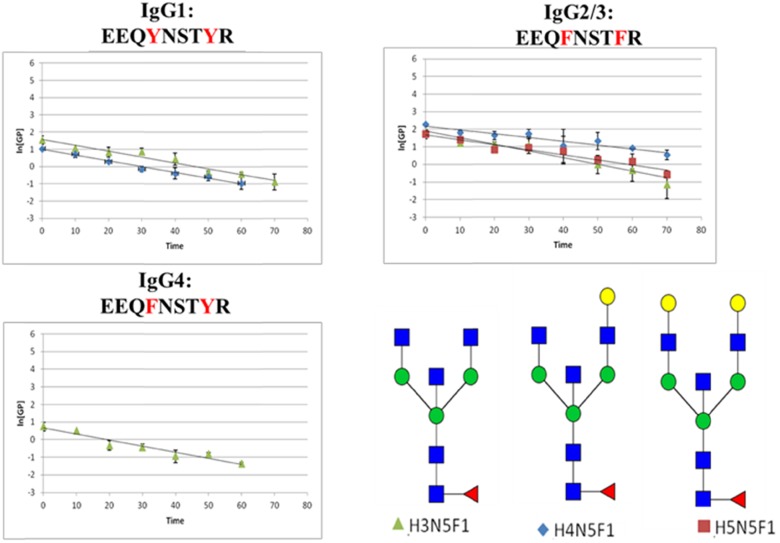
The plots of the ln[GP] for each category of glycoforms (fucosylated, nonfucosylated, bisecting-GlcNAc, and sialylated) with different peptide backbones are plotted as functions of time in Figs. 6–9, respectively. The slopes of the lines (ln[GP] vs. time), which are proportional to the rate constant of the PNGase F release, were calculated for each species, and these values are presented in Table 1. In these experiments, deglycosylation of glycopeptides with the same glycoform attached to different peptide backbones was found to have very similar slopes, which means their de-glycosylation rates are approximately the same. Consequently, these small changes in the amino acid sequence do not appear to alter the rate of deglycosylation significantly. For glycopeptides with same peptide backbones but different categorical glycoforms, fucosylated glycopeptides seem to have the highest de-glycosylation rate (steepest slope) compared with the other categories of glycopeptides.
FIGURE 6.
Plots of ln[GP] vs. time for the fucosylated glycopeptides. These data were obtained following the addition of PNGase F at a concentration of 2.5 U/μl. The [GP] signal was achieved by dividing the peak area of this glycopeptide by the integrated peak area of internal standard (GluFib) at each time point.
FIGURE 9.
Plots of ln[GP] vs. time for the sialylated glycopeptides. These data were obtained following the addition of PNGase F at a concentration of 2.5 U/μl. The [GP] signal was obtained by dividing the peak area of this glycopeptide by the integrated peak area of internal standard (GluFib) at each time point.
TABLE 1.
Summary of experimental rate constants found for each of the observed IgG glycopeptides
| IgG glycopeptide | Rate constant, k | IgG1 | IgG2/3 | IgG4 |
|---|---|---|---|---|
| Fucosylated | H3N4F1 | 0.0266 | 0.0250 | 0.0273 |
| H4N4F1 | 0.0244 | 0.0256 | 0.0250 | |
| H5N4F1 | 0.0186 | 0.0200 | 0.0187 | |
| Nonfucosylated | H3N4 | 0.0179 | 0.0206 | 0.0255 |
| H4N4 | 0.0245 | 0.0182 | 0.0204 | |
| H5N4 | 0.0174 | 0.0154 | 0.0158 | |
| Bisecting | H3N5F | NA | 0.0153 | NA |
| H4N5F | 0.0132 | 0.0088 | 0.0138 | |
| H5N5F1 | 0.0134 | 0.0116 | NA | |
| Sialylated | H4N4F1S1 | 0.0088 | 0.0099 | 0.0124 |
| H5N4F1S1 | 0.0129 | 0.0134 | 0.0125 | |
| H5N5F1S1 | 0.0148 | 0.0138 | NA |
These values were obtained by determining the slope of the line obtained when the ln[GP] is plotted as a function of time for each glycopeptide investigated. The slopes were then divided by the concentration of PNGase F (2.5 U/μl) to give a rate constant per unit of enzyme.
FIGURE 7.
Plots of ln[GP] vs. time for the nonfucosylated glycopeptides. These data were obtained following the addition of PNGase F at a concentration of 2.5 U/μl. The [GP] signal was achieved by dividing the peak area of this glycopeptide by the integrated peak area of internal standard (GluFib) at each time point.
FIGURE 8.
Plots of ln[GP] vs. time for the glycopeptides whose glycans contain a bisecting-GlcNAc. These data were obtained following the addition of PNGase F at a concentration of 2.5 U/μl. The [GP] signal was obtained by dividing the peak area of this glycopeptide by the integrated peak area of internal standard (GluFib) at each time point.
The Mann-Whitney test was used here to investigate if the differences in the de-glycosylation rate among the different categorical glycan structures, and peptide backbones are statistically significant. The Mann-Whitney test is a nonparametric test of the null hypothesis, where 2 samples have equal averages, vs. the alternative hypothesis, where the sample means from the 2 samples are not equal. Mann-Whitney was selected over the 2-sample t test, as the Mann-Whitney does not require the assumption of normal distributions. The results from these Mann-Whitney tests are listed in Table 2 for each comparison category. The smaller the P value, the more likely one can reject the null hypothesis that the difference between the 2 groups is a result of random sampling. Therefore, small P values lead one to conclude that the populations are distinct. For instance, a P value of 0.05 indicates a 5% risk of finding that a difference exists between 2 populations when there is no actual difference.
TABLE 2.
Results of Mann-Whitney test
| Comparison | P | Result |
|---|---|---|
| k(IgG1) vs. k(IgG2/3) | 0.83 | k(IgG1) = k(IgG2) |
| k(Fuc.) vs. k(non-Fuc.) | 0.002 | k(non-Fuc.) < k(Fuc.) |
| k(Fuc.) vs. k(Bisec.) | <0.001 | k(Bisec.) < k(Fuc.) |
| k(Fuc.) vs. k(Sia.) | <0.001 | k(Sia.) < k(Fuc.) |
Fuc., Fucosylated; non-Fuc., nonfucosylated; Bisec., bisecting; Sia., sialylated.
The results from every glycoform attached to the IgG1 peptide were compared with these glycoforms on the IgG2/3 peptide. IgG1 and IgG2/3 were compared, as they differed by 2 aa and thus, had the largest difference in peptide sequence in the glycopeptide mixture analyzed. The P value of 0.83 suggests that there is an 83% likelihood that any differences in rate constants observed between IgG1 and IgG2/3 are from random sampling and therefore, that these are not actual differences. Hence, it is concluded that the glycopeptides rates of de-glycosylation between the IgG1 glycopeptides are not statistically different from the rate of deglycosylation of the corresponding IgG2/3 glycopeptides. Consequently, the subtle difference in peptide sequence between these peptides does not have a detectable effect on the rate of de-glycosylation, although additional experiments are needed to evaluate if larger changes in the amino acid sequence and the length of the peptide are associated with alterations in the rate of deglycosylation.
The Mann-Whitney test revealed that the rates for deglycosylation of glycopeptides, possessing the fucosylated class of glycan, are statistically faster than de-glycosylation of glycopeptides with any of the other glycan categories. The 0.002 P value obtained when the fucosylated group is compared with the nonfucosylated group suggests that the observed differences in rate constants between these two groups have a 0.2% chance of arising from random sampling. Likewise, the value of P < 0.001, when the fucosylated group is compared with either the bisecting group or the sialylated group, suggests that the chances of these differences arising from random sampling are <0.1%. Hence, all of these structural attributes slow the rate of PNGase F release compared with the glycopeptides containing a fucosylated glycan.
CONCLUSIONS
Significant differences in the deglycosylation rate constants were observed among glycopeptides differing only in glycan structure (i.e., nonfucosylated, fucosylated, bisecting-GlcNAc, sialylated, etc.). For example, a single SA residue was found to decrease the rate by a factor of 3. Similar reductions in rate were associated with the presence of a bisecting-GlcNAc. These differences in release kinetics can lead to significant errors in the quantification of glycosylations of IgGs, particularly in instances where the deglycosylation reaction is not given the time to proceed to completion. Here, the glycans released at a faster rate would be over-represented in the released glycan population relative to the glycans that are released slower, leading to erroneous relative glycan ratios. The differences in deglycosylation rate based on glycan structure would suggest that the newer protocols advocating very short de-glycosylation times, often under 5 min, would be particularly prone to quantitative errors.
Supplementary Material
ACKNOWLEDGMENTS
Research reported in this publication was supported by the National Institute of General Medical Sciences of the U.S. National Institutes of Health (NIH) under NIH Grants R41GM093747 and R41GM113666.
Glossary
- ACN
acetonitrile
- Asn
asparagine
- Fc
crystallizable fragment
- GlcNAc
N-acetylglucosamine
- GluFib
[Glu1]-Fibrinopeptide B
- [GP]
concentration of glycopeptide
- LC
liquid chromatography
- ln[GP]
natural log of concentration of glycopeptide
- MS
mass spectrometry
- PNGase F
peptide N-glycosidase F
- SA
sialic acid
- SRM
selected reaction monitoring
REFERENCES
- 1.Mimura Y, Church S, Ghirlando R, et al. The influence of glycosylation on the thermal stability and effector function expression of human IgG1-Fc: properties of a series of truncated glycoforms. Mol Immunol 2000;37:697–706. [DOI] [PubMed] [Google Scholar]
- 2.Mimura Y, Sondermann P, Ghirlando R, et al. Role of oligosaccharide residues of IgG1-Fc in Fc γ RIIb binding. J Biol Chem 2001;276:45539–45547. [DOI] [PubMed] [Google Scholar]
- 3.Shields RL, Lai J, Keck R, et al. Lack of fucose on human IgG1 N-linked oligosaccharide improves binding to human Fcgamma RIII and antibody-dependent cellular toxicity. J Biol Chem 2002;277:26733–26740. [DOI] [PubMed] [Google Scholar]
- 4.Iida S, Misaka H, Inoue M, et al. Nonfucosylated therapeutic IgG1 antibody can evade the inhibitory effect of serum immunoglobulin G on antibody-dependent cellular cytotoxicity through its high binding to FcgammaRIIIa. Clin Cancer Res 2006;12:2879–2887. [DOI] [PubMed] [Google Scholar]
- 5.Kaneko Y, Nimmerjahn F, Ravetch JV. Anti-inflammatory activity of immunoglobulin G resulting from Fc sialylation. Science 2006;313:670–673. [DOI] [PubMed] [Google Scholar]
- 6.Abès R, Teillaud JL. Impact of glycosylation on effector functions of therapeutic IgG. Pharmaceuticals (Basel) 2010;3:146–157. [DOI] [PMC free article] [PubMed] [Google Scholar]
- 7.Huhn C, Selman MH, Ruhaak LR, Deelder AM, Wuhrer M. IgG glycosylation analysis. Proteomics 2009;9:882–913. [DOI] [PubMed] [Google Scholar]
- 8.Parekh RB, Dwek RA, Sutton BJ, et al. Association of rheumatoid arthritis and primary osteoarthritis with changes in the glycosylation pattern of total serum IgG. Nature 1985;316:452–457. [DOI] [PubMed] [Google Scholar]
- 9.Qian J, Liu T, Yang L, Daus A, Crowley R, Zhou Q. Structural characterization of N-linked oligosaccharides on monoclonal antibody cetuximab by the combination of orthogonal matrix-assisted laser desorption/ionization hybrid quadrupole-quadrupole time-of-flight tandem mass spectrometry and sequential enzymatic digestion. Anal Biochem 2007;364:8–18. [DOI] [PubMed] [Google Scholar]
- 10.Omtvedt LA, Royle L, Husby G, et al. Glycan analysis of monoclonal antibodies secreted in deposition disorders indicates that subsets of plasma cells differentially process IgG glycans. Arthritis Rheum 2006;54:3433–3440. [DOI] [PubMed] [Google Scholar]
- 11.Mechref Y, Muzikar J, Novotny MV. Comprehensive assessment of N-glycans derived from a murine monoclonal antibody: a case for multimethodological approach. Electrophoresis 2005;26:2034–2046. [DOI] [PMC free article] [PubMed] [Google Scholar]
- 12.Jacquemin M, Radcliffe CM, Lavend’homme R, et al. Variable region heavy chain glycosylation determines the anticoagulant activity of a factor VIII antibody. J Thromb Haemost 2006;4:1047–1055. [DOI] [PubMed] [Google Scholar]
- 13.Chen X, Flynn GC. Analysis of N-glycans from recombinant immunoglobulin G by on-line reversed-phase high-performance liquid chromatography/mass spectrometry. Anal Biochem 2007;370:147–161. [DOI] [PubMed] [Google Scholar]
- 14.Gennaro LA, Salas-Solano O. On-line CE-LIF-MS technology for the direct characterization of N-linked glycans from therapeutic antibodies. Anal Chem 2008;80:3838–3845. [DOI] [PubMed] [Google Scholar]
- 15.Harvey DJ, Crispin M, Scanlan C, et al. Differentiation between isomeric triantennary N-linked glycans by negative ion tandem mass spectrometry and confirmation of glycans containing galactose attached to the bisecting (β1-4-GlcNAc) residue in N-glycans from IgG. Rapid Commun Mass Spectrom 2008;22:1047–1052. [DOI] [PubMed] [Google Scholar]
- 16.Hodoniczky J, Zheng YZ, James DC. Control of recombinant monoclonal antibody effector functions by Fc N-glycan remodeling in vitro. Biotechnol Prog 2005;21:1644–1652. [DOI] [PubMed] [Google Scholar]
- 17.Kamoda S, Nomura C, Kinoshita M, et al. Profiling analysis of oligosaccharides in antibody pharmaceuticals by capillary electrophoresis. J Chromatogr A 2004;1050:211–216. [PubMed] [Google Scholar]
- 18.Yu YQ, Gilar M, Kaska J, Gebler JC. A rapid sample preparation method for mass spectrometric characterization of N-linked glycans. Rapid Commun Mass Spectrom 2005;19:2331–2336. [DOI] [PubMed] [Google Scholar]
- 19.Takegawa Y, Deguchi K, Nakagawa H, Nishimura S. Structural analysis of an N-glycan with “β1-4 bisecting branch” from human serum IgG by negative-ion MSn spectral matching and exoglycosidase digestion. Anal Chem 2005;77:6062–6068. [DOI] [PubMed] [Google Scholar]
- 20.Saba JA, Kunkel JP, Jan DC, et al. A study of immunoglobulin G glycosylation in monoclonal and polyclonal species by electrospray and matrix-assisted laser desorption/ionization mass spectrometry. Anal Biochem 2002;305:16–31. [DOI] [PubMed] [Google Scholar]
- 21.Matamoros Fernández LE, Kalume DE, Calvo L, Fernández Mallo M, Vallin A, Roepstorff P. Characterization of a recombinant monoclonal antibody by mass spectrometry combined with liquid chromatography. J Chromatogr B Biomed Sci Appl 2001;752:247–261. [DOI] [PubMed] [Google Scholar]
- 22.Majid FA, Butler M, Al-Rubeai M. Glycosylation of an immunoglobulin produced from a murine hybridoma cell line: the effect of culture mode and the anti-apoptotic gene, bcl-2. Biotechnol Bioeng 2007;97:156–169. [DOI] [PubMed] [Google Scholar]
- 23.Tarentino AL, Gómez CM, Plummer TH Jr. Deglycosylation of asparagine-linked glycans by peptide:N-glycosidase F. Biochemistry 1985;24:4665–4671. [DOI] [PubMed] [Google Scholar]
Associated Data
This section collects any data citations, data availability statements, or supplementary materials included in this article.


