

Abstract
Background
Gut microbiota is implied in obesity, because of its ability to harvest energy from diet, and in the regulation of behavior. Given the link between gut microbiota, body composition, obesity, and anxiety, the aim of this study was to evaluate the effects of a new psychobiotic formulation.
Methods
Eligible patients were randomly divided into three groups: psychobiotics oral suspension group (POSG); dietary treatment group (DTG); combined treatment group (CTG). All subjects underwent body composition and psychological profile evaluation.
Results
Significant changes in body composition parameters in each group were relieved after all treatments. Hamilton anxiety rating scale (HAM-A) highlighted a significant reduction of the total score for all study population after treatments in POSG (p = 0.01) and CTG (p = 0.04). A reduction of HAM-A total score in anxious subjects in POSG or CTG and a significant reduction of positive subjects for HAM-A in POSG (p = 0.03) and in CDG (p = 0.01) were shown.
Discussion
Three-week intake of selected POS represents a good approach to solve problems related to obesity and behavior disorders. However, new clinical trials need to be performed on a larger population and for a longer period of treatment before definitive conclusions can be made. This trial is registered with NCT01890070.
1. Introduction
Gut microbiota is an ensemble of 100 trillion microorganisms present in the gastrointestinal tract (GI), which belong to more than 1000 species and 700 strains [1], and plays a crucial role in human's physiology, due to its ability to maintain energy homeostasis and stimulate immunity as an endocrine organ, in a symbiotic relationship with the host [2]. Several factors like genetics, diet, infection, drug consumption, age, and sex could influence the nature of gut microbiota, both temporarily and definitely. An external change of its composition could induce a dramatic variation on the hosts' health [3, 4].
A growing body of evidence demonstrated the possible involvement of gut microbiota in fat mass accumulation and cardiometabolic disease onset. The World Health Organization described obesity as a disorder with an excessive body fat accumulation, abandoning the old definition, which restricted this condition to the simple body mass index (BMI) classification, to embrace a broader range of phenotypes, including subjects within the normal BMI range but with a critical percentage of body fat mass [5–10]. Obesity condition seems to be mostly caused by the obesogenic environment [11], which consists of a series of bad lifestyle habits from the disproportionate intake of calories, especially from simple carbohydrates, and the reduction of physical activity. Moreover, obese subjects could present some behavioral disorders [12], and some genetic profiles seem to be associated with the body weight regulation [13–16].
Gut microbiota seems to be implicated in obesity onset given its ability to harvest energy from the diet, through its influence on gut epithelium and motility [17], and increase triglyceride storage in the host adipocytes, inhibiting the fasting-induced adipose factors [18]. Furthermore, gut microbiota influences several metabolic processes such as lipogenesis, fatty acid oxidation, triglycerides, and cholesterol production [19]. Numerous in vivo studies observed that microbiota plays a strong role in adipose tissue accumulation. In fact, germ-free mice, although they ingest more calories than their littermates, result leaner than conventional mice. At the same time, microbiota transplantation from conventional to germ-free mice highlights a dramatic increase in body fat, triglyceride production, and insulin resistance, without changing their food habits [17, 20, 21].
In recent years, researchers focused their attention on the relationship between gut microbiota and brain development and function, discovering a bidirectional communication pathway between them, defined as microbiota-gut-brain axis.
Several studies highlighted the role of microbiota in the regulation of mood and behavior, like stress, anxiety, depression, and autism [22–24], as well as the potential therapeutic effects deriving from its modulation.
Due to the psychotropic effects in animal models and human clinical trials, the term “psychobiotics” was introduced [25]. In fact, it has been demonstrated that treatment with probiotics formulation, containing Lactobacillus acidophilus, Lactobacillus casei, and Bifidobacterium bifidum, showed positive effects on psychological distress [26, 27].
In vivo studies observed a relation between altered gut microbiota composition and anxiety related behavior, with increased exploration of aversive zones and improved serotoninergic function in germ-free mice when compared to specific pathogen-free counterparts [24, 28, 29].
Moreover, the anxiety-like behavior increases during pathogen infection and GI inflammation in animal models [30].
At the same time, anxiety and other psychological disorders seem to be related to body composition and obesity [31]. Several studies observed learning, memory, and function deficits in obese subjects, linking obesity to the exacerbation of depression and anxiety disorders [32–35]. Vice versa, depression disorders have a strong positive association with eating behaviors and fat mass, especially in subjects who do not follow a Mediterranean-like eating pattern [36].
Up today, very few studies demonstrated the beneficial effects of psychobiotics on the health status of obese subjects. An improvement of psychosocial behavior was seen in subjects with a fat mass surplus that underwent weight loss dietary treatments [37].
Given the link among gut microbiota, body composition, obesity, and the risk of developing anxiety, the aim of this study was to evaluate the differences deriving from the combination of 3-week administration of a new psychobiotic formulation, (psychobiotics oral suspension, POS) with or without dietary treatment (DT), consisting of a hypocaloric diet, on general population.
The evaluation was performed based on anthropometric, bioimpedance analysis (BIA), dual X-ray absorptiometry (DXA) measurements, and anxiety assessment with Hamilton anxiety rating scale (HAM-A).
2. Methods
2.1. Study Design and Subjects
This research was conducted using a prospective intervention study design, between January 2017 and April 2017. Forty-five subjects were recruited sequentially within a routine medical check-up program at the Section of Clinical Nutrition and Nutrigenomics, Department of Biomedicine and Prevention of the University of Rome “Tor Vergata.” POS was administrated 1 time/day, 2 h before lunch in order to ensure gastrointestinal transit and absorption.
Eligible patients were randomly divided into three groups (1 : 1 : 1 ratio): (1) psychobiotics oral suspension group (POSG), subjects took daily note 1 bag of 3 g of POS, and they did not change their ordinary diet; (2) dietary treatment group (DTG), subjects followed a hypocaloric diet; (3) combined treatment group (CTG), subjects followed the hypocaloric diet and took daily note 1 bag of 3 g of POS. Each group followed the assigned treatment consecutively for 3 weeks. At the beginning and at the end of each treatment, body composition evaluation and psychodiagnostic tests were performed.
Subjects were asked to maintain their usual lifestyle habits and to report any illness or abnormality arisen during the study.
The primary outcome of this study was the evaluation of nutritional status according to body composition changes measured by anthropometry, BIA, and DXA, due to the different treatments. The secondary outcome was the evaluation of anxiety disorder through the HAM-A test, pre- and posttreatment each.
All participants recruited in the study authorized their participation by reading and signing the informed consent, drafted in accordance with the provisions of the Ethics Committee of Medicine, University of Rome Tor Vergata and with the Helsinki Declaration of 1975 as revised in 1983. This trial is registered with NCT01890070, http://www.ClinicalTrials.gov.
2.2. Exclusion Criteria
Exclusion criteria included age < 20 y or >75 y, pregnancy, breastfeeding, type 1 diabetes, presence of intestinal bacterial overgrowth, characterized by high levels of hydrogen and methane production in the small bowel, acute diseases, endocrine disorders, liver, heart or kidney dysfunctions, history of chronic medication, antibiotic therapy up to ten days before enrollment, smoke, drug or alcohol abuse, and participation in another diet trial. No subjects with known alterations of intestinal transit following organic pathologies (abdominal surgery, diabetes mellitus, scleroderma, hypothyroidism, etc.) were included in the study. Subjects were advised not to consume any antibiotics or probiotics for the month prior to study initiation and to avoid using it for all the duration of the study.
2.3. Psychobiotics Oral Suspension Composition
1 bag of POS of 3 g contained: 1.5 × 10¹⁰ colony-forming unit CFU of Streptococcus thermophilus (CNCM strain number I-1630), 1.5 × 10¹⁰ colony-forming unit CFU of Lactobacillus bulgaricus (CNCM strain numbers I-1632 and I-1519); 1.5 × 10¹⁰ colony-forming unit CFU of Lactococcus lactis subsp. lactis (CNCM strain number I-1631); 1.5 × 10¹⁰ colony-forming unit CFU of Lactobacillus acidophilus; 1.5 × 10¹⁰ colony-forming unit CFU of Streptococcus thermophiles; 1.5 × 10¹⁰ colony-forming unit CFU of Lactobacillus plantarum; 1.5 × 10¹⁰ colony-forming unit CFU of Bifidobacterium lactis (CNCM I-2494); 1.5 × 1 1010 colony-forming unit CFU of Lactobacillus reuteri (DSM 17938), maltodextrin from corn, anticaking agent (silica), casein, lactose, and gluten < 3 ppm LLOQ (lower limit of quantitation), (Biocult strong, HOMEOSYN, Rome, Italy).
2.4. Anthropometric Analysis
According to the International Society for the Advancement of Kinanthropometry protocol and National Institute of Health Guidelines, waist circumference (WC) and hip circumference (HC) were taken using a flexible steel metric tape to the nearest 0.5 cm. Body weight (Kg) was measured to the nearest 0.1 Kg, using a technical balance (Invernizzi, Rome, Italy). Waist/hip ratio (WHR) was also evaluated in relation to clinical risk thresholds, that is, WHR > 1 for men and WHR > 0.9 for women. Height (m) was measured to the nearest 0.1 cm using a stadiometer (Invernizzi, Rome, Italy). BMI was calculated using the formula: BMI = body weight/height2 (Kg/m2).
2.5. Bioelectrical Impedance Analysis (BIA)
Resistance, reactance, impedance, phase angle, total body water (TBW), intracellular water (ICW), and extracellular water (ECW) were assessed by BIA phase sensitive system (BIA 101S, Akern/RJL Systems, Florence, Italy) [38, 39]. Impedance index (II) was evaluated with the following formula [40]:
| (1) |
Measurements were taken according to Di Renzo et al. [39].
2.6. Dual X-Ray Absorptiometry (DXA)
Body composition analysis was assessed by DXA (i-DXA, GE Medical Systems, Milwaukee, WI, USA) according to the previously described procedures [12].
Total body fat (TBFat), total body lean (TBLean), android body fat (ABF), and gynoid body fat (GBF) were expressed as a percentage (%) of the total body mass. TBFat percentage was estimated by the ratio between the TBFat (Kg) and the sum of TBFat (Kg), TBLean (Kg) and bone mineral content (BMC) (Kg) multiplied by 100. The intermuscular adipose tissue (IMAT) was evaluated according to Bauer et al. [41].
2.7. Dietary Intervention
The energy intake for DT was calculated based on basal metabolic rate (BMR) of each subject, with Weir's formula: BMR = [(3.94 × VO2) + (1.106 × VCO2)] × 1.44 VO2, where VO2 is the volume of oxygen uptake (mL/min), estimated by the following formulas:
| (2) |
and VCO2 is the volume of carbon dioxide output (mL/min), evaluated with the following formula:
| (3) |
Protein intake was determined considering 2 g of protein/Kg of TBLean, representing 21–26% of daily caloric intake. Carbohydrate intake was between 44% and 51% of total energy intake, and fat intake was between 27% and 31% of daily caloric intake (<10% of saturated fatty acids, <300 mg/day of cholesterol). The fiber intake was 30 g/day [42].
2.8. Psychodiagnostic Instruments
Hamilton anxiety rating scale (HAM-A) was administered by instructed physicians and was used to measure the severity of anxiety symptoms. The 14 items on the scale define several symptoms and measure psychic and somatic anxiety. Each item has a score from 0 to 4, respectively, from the absence to the severe presence of the related symptom. The total score, which has a range from 0 to 56, describes three different scenarios: <17 indicates mild anxiety severity, 18–24 from mild to moderate anxiety severity, and 25–30 from moderate to high anxiety severity. In this work, we considered anxious subjects those who had a score higher than or equal to 18 [43, 44].
2.9. Statistical Analysis
Nonparametric tests for asymmetrically distributed data were conducted in all analyses and presented as median (minimum and maximum). Kruskal Wallis test was carried out to compare the three groups at baseline. To evaluate differences before and after 21 days of treatment, Wilcoxon test was performed in each group. To describe, quantitatively, variable change after treatments, we used a ratio of the absolute variation to the baseline value (percent variation = Δ%). Categorical variables were compared among groups by Chi-square (χ2) or Fisher's test. McNemar test was used for the comparison between groups at baseline (T0) and after treatment (T1). Statistical analyses were carried out using IBM SPSS 21.0 for Windows (Armonk, NY: IBM Corp. USA). In all statistical tests performed, the null hypothesis was rejected at the 0.05 level of probability.
3. Results
Out of forty-five subjects recruited, twelve were excluded from the trial: five did not meet inclusion criteria, seven declined to participate, and other three subjects voluntarily stopped the treatment (Figure 1).
Figure 1.

Study flow diagram according to Consort, 2010.
During the trial, three subjects dropped out of the study and, finally, thirty patients between 21 and 72 years old with a BMI between 18.5 and 39.9 Kg/m2 and without metabolic complications met the inclusion criteria and completed the trial. No changes to trial outcomes occurred after it commenced. The median age of subjects was 45 years, 83.3% female and 16.7% male (Table 1). At baseline, no statistical significance was observed between groups (Table 2).
Table 1.
Overall description of anthropometric, body composition, and anxiety data.
| Overall | |
|---|---|
| n = 30 | |
| Median (min–max) | |
| Age (years) | 45.00 (21.00–72.00) |
| Weight (Kg) | 77.75 (50.30–121.00) |
| Height (cm) | 165.00 (150.00–186.00) |
| BMI (Kg/m2) | 26.87 (20.12–39.93) |
| WC (cm) | 89.25 (69.50–122.50) |
| HC (cm) | 108.50 (85.50–132.00) |
| WHR | 0.82 (0.69–1.09) |
| Phase angle (°) | 7.05 (5.10–930) |
| II (cm2/Ω) | 53.97 (39.35–94.28) |
| TBFat (Kg) | 28.45 (14.03–44.64) |
| ABFat (Kg) | 2.50 (0.70–4.38) |
| GBFat (Kg) | 5.20 (2.72–7.70) |
| IMAT | 1.21 (0.46–2.04) |
| TBLean (Kg) | 43.23 (35.63–58.13) |
| HAM-A (points) | 11.00 (0.00–30.00) |
All results were expressed as median (minimum–maximum). BMI: body mass index; WC: waist circumference; HC: hip circumference; WHR: waist-to-hip ratio; II: impedance index; TBFat: total body fat; ABFat: android body fat; GBFat: gynoid body fat; IMAT: intermuscular adipose tissue; TBLean: total body lean; HAM-A: Hamilton anxiety rating scale (negative test (nonanxious subjects) if total score < 18 and positive test (anxious subjects) if total score ≥ 18).
Table 2.
Anthropometric, body composition, and anxiety analysis of the 3 groups.
| POSG | DTG | CTG | ||
|---|---|---|---|---|
| n = 11 | n = 10 | n = 9 | p | |
| Median (min–max) | Median (min–max) | Median (min–max) | ||
| Age (years) | 42.00 (26.00–65.00) | 36.50 (21.00–72.00) | 51.00 (44.00–72.00) | 0.12 |
| Weight (Kg) | 67.80 (50.30–111.80) | 77.00 (62.20–99.00) | 79.50 (57.20–121.00) | 0.45 |
| Height (cm) | 166.00 (155.00–186.00) | 166.50 (150.00–173.00) | 165.00 (161.00–185.00) | 0.81 |
| BMI (Kg/m2) | 25.11 (20.12–39.45) | 28.60 (26.10–38.60) | 29.20 (22.07–39.93) | 0.10 |
| WC (cm) | 77.00 (69.50–121.00) | 94.25 (85.00–106.50) | 90.00 (74.00–122.50) | 0.27 |
| HC (cm) | 104.50 (85.50–132.00) | 108.00 (102.00–120.00) | 112.25 (89.00–132.00) | 0.27 |
| WHR | 0.77 (0.69–1.05) | 0.86 (0.80–0.94) | 0.82 (0.71–1.09) | 0.25 |
| Phase Angle (°) | 6.50 (4.60–10.20) | 7.05 (5.10–9.30) | 6.90Z (4.90–9.00) | 0.71 |
| II (cm2/Ω) | 61.54 (39.35–69.05) | 57.12 (42.79–82.53) | 52.76 (45.40–94.28) | 0.91 |
| TBFat (Kg) | 23.29 (14.03–24.57) | 29.52 (23.00–44.64) | 34.39 (15.05–44.19) | 0.13 |
| ABFat (Kg) | 1.36 (0.70–2.40) | 2.60 (1.29–4.23) | 2.53 (0.82–4.38) | 0.17 |
| GBFat (Kg) | 3.90 (2.97–4.95) | 5.70 (4.35–7.70) | 5.86 (2.72–7.05) | 0.25 |
| IMAT | 0.89 (0.46–2.00) | 1.22 (0.87–1.79) | 1.47 (0.50–2.04) | 0.25 |
| TBLean (Kg) | 35.88 (34.43–51.36) | 43.23 (35.63–58.13) | 41.58 (39.59–54.96) | 0.35 |
| HAM-A (points) | 11.00 (3.00–28.00) | 13.50 (7.00–30.00) | 6.00 (00.00–23.00) | 0.06 |
All parameters were evaluated at baseline among the 3 groups, by Kruskal Wallis test. All results were expressed as median (minimum–maximum). Statistical significance attributed to results with ∗p < 0.05. POSG: psychobiotics oral suspension group; DTG: dietary treatment group; CTG: combined treatment group; BMI: body mass index; WC: waist circumference; HC: hip circumference; WHR: waist-to-hip ratio; II: impedance index; TBFat: total body fat; ABFat: android body fat; GBFat: gynoid body fat; IMAT: intermuscular adipose tissue; TBLean: total body lean; HAM-A: Hamilton anxiety rating scale (negative test (nonanxious subjects) if total score < 18 and positive test (anxious subjects) if total score ≥ 18).
Significant changes in body composition parameters in each group were relieved after all treatments. In fact, POSG and CTG showed a significant reduction in II (p = 0.03 and p = 0.01, resp.), whereas both DTG and CTG highlighted a significant reduction in weight (p = 0.01), BMI (p = 0.01), waist circumference (p = 0.01 and p = 0.04, resp.), TBFat (Kg) (p = 0.03 and p = 0.04, resp.), and IMAT (p = 0.03; p = 0.04, resp.). Significant reduction in hip circumference (p = 0.02) and TBLean (Kg) (p = 0.02) were observed only in DTG, whereas waist/hip ratio (p = 0.04), PA (p = 0.02), ABFat (Kg) (p = 0.04), and GBFat (Kg) (p = 0.04) parameters were significantly reduced in CTG (Table 3).
Table 3.
Comparison between before and after treatment in each group.
| POSG (n = 11) | DTG (n = 10) | CTG (n = 9) | |||||||
|---|---|---|---|---|---|---|---|---|---|
| T0 | T1 | p | T0 | T1 | p | T0 | T1 | p | |
| Median (min–max) | Median (min–max) | Median (min–max) | Median (min–max) | Median (min–max) | Median (min–max) | ||||
| Weight (Kg) | 67.80 (50.30–111.80) | 66.30 (49.70–107.90) | 0.39 | 77.00 (62.20–99.00) | 75.25 (60.50–93.30) | 0.01∗ | 79.50 (57.20–121.00) | 76.50 (56.10–119.50) | 0.01∗ |
| BMI (Kg/m2) | 25.11 (20.12–39.45) | 24.75 (20.12–38.52) | 0.39 | 28.60 (26.10–38.60) | 27.57 (23.90–35.80) | 0.01∗ | 29.20 (22.07–39.93) | 28.10 (21.64–38.58) | 0.01∗ |
| WC (cm) | 77.00 (69.50–121.00) | 78.00 (68.00–121.00) | 0.07 | 94.25 (85.00–106.50) | 88.50 (80.00–100.00) | 0.01∗ | 90.00 (74.00–122.50) | 86.50 (71.00–115.00) | 0.04∗ |
| HC (cm) | 104.50 (85.50–132.00) | 105.00 (87.00–121.50) | 0.40 | 108.00 (102.00–120.00) | 104.50 (96.00–116.00) | 0.02∗ | 112.25 (89.00–132.00) | 109.50 (88.00–119.00) | 0.17 |
| WHR | 0.77 (0.69–1.05) | 0.76 (0.66–1.05) | 0.28 | 0.86 (0.80–0.94) | 0.84 (0.76–0.93) | 0.09 | 0.82 (0.71–1.09) | 0.81 (0.74–1.00) | 0.04∗ |
| Phase angle (°) | 6.50 (4.60–10.20) | 6.30 (4.90–8.60) | 0.15 | 7.05 (5.10–9.30) | 6.50 (4.70–8.60) | 0.06 | 6.90 (4.90–9.00) | 5.70 (5.10–6.60) | 0.02∗ |
| II (cm2/Ω) | 51.52 (39.35–69.05) | 50.53 (39.35–66.92) | 0.03∗ | 57.12 (42.79–82.53) | 53.43 (40.99–76.08) | 0.06 | 55.11 (45.40–94.28) | 51.93 (43.42–91.02) | 0.01∗ |
| TBFat (Kg) | 23.29 (14.03–24.57) | 22.70 (14.43–25.50) | 0.59 | 29.52 (23.00–44.64) | 29.13 (22.76–40.33) | 0.03∗ | 34.39 (15.05–44.19) | 28.18 (13.60–43.05) | 0.04∗ |
| ABFat (Kg) | 1.36 (0.70–2.40) | 1.24 (0.67–2.33) | 0.11 | 2.60 (1.29–4.23) | 2.65Z (1.23–3.60) | 0.07 | 2.53 (0.82–4.38) | 1.81 (0.61–4.23) | 0.04∗ |
| GBFat (Kg) | 3.90 (2.97–4.95) | 3.91 (2.90–4.87) | 0.28 | 5.70 (4.35–7.70) | 4.90 (4.10–7.77) | 0.07 | 5.86 (2.72–7.05) | 5.20 (2.43–6.76) | 0.04∗ |
| IMAT | 0.89 (0.46–2.00) | 0.85 (0.47–1.18) | 0.59 | 1.22 (0.87–1.79) | 1.20 (0.86–1.69) | 0.03∗ | 1.47 (0.50–2.04) | 1.15 (0.44–1.72) | 0.04∗ |
| TBLean (Kg) | 35.88 (34.43–51.36) | 35.87 (35.39–50.63) | 1.00 | 43.23 (35.63–58.13) | 42.61 (35.62–57.21) | 0.02∗ | 41.58 (39.59–54.96) | 40.42 (39.51–54.11) | 0.22 |
| HAM-A | 11.00 (3.00–28.00) | 7.00 (1.00–28.00) | 0.01∗ | 13.50 (7.00–30.00) | 10.00 (6.00–31.00) | 0.72 | 6.00 (00.00–23.00) | 5.00 (0.00–19.00) | 0.04∗ |
All parameters were evaluated before and after treatments by Wilcoxon test. All results were expressed as median (minimum–maximum). Statistical significance attributed to results with ∗p < 0.05 between T0 and T1. POSG: psychobiotics oral suspension group; DTG: dietary treatment group; CTG: combined treatment group; BMI: body mass index; WC: waist circumference; HC: hip circumference; WHR: waist-to-hip ratio; II: impedance index; TBFat: total body fat; ABFat: android body fat; GBFat: gynoid body fat; IMAT: intermuscular adipose tissue; TBLean: total body lean; Ham-A: Hamilton anxiety rating scale (negative test (nonanxious subjects) if total score < 18 and positive test (anxious subjects) if total score ≥ 18).
The HAM-A test performed on POSG and CTG highlighted a significant reduction in the total score for all study population after both treatments (p = 0.01 and p = 0.04, resp.). No significant difference was seen in the HAM-A of DTG (Table 3). However, according to the total score, the sample was divided into anxious (total score ≥ 18) and nonanxious subjects (total score< 18) within each group. At baseline, no statistical significance was observed between POSG, DTG, and CTG for anxious and nonanxious subjects (p = 0.06). A notable reduction in the HAM-A total score in anxious subjects that had undergone the POS or combined treatment (Δ = −5 points and Δ = −9.5 points, resp.) was highlighted, while anxious DTG patients had HAM-A total score increased (Figure 2).
Figure 2.

Hamilton anxiety rating scale (HAM-A) score variation before and after treatments in anxious and nonanxious subjects. Nonanxious subjects (negative test) if total score < 18 and anxious subjects (positive test) if total score ≥ 18. Variation score is shown as median, minimum, and maximum. 609 statistical significance attributed to results with p < 0.05 by Kruskal Wallis test. Anxious variation score among groups: p = 0.10 and nonanxious variation score among groups: p = 0.67. POSG: psychobiotics oral suspension group; DTG: dietary treatment group; CTG: combined treatment group.
Table 4 shows absolute numbers of anxious and nonanxious subjects in the 3 groups, before and after treatment. Furthermore, a significant reduction in the number of anxious subjects was observed in POSG (p = 0.03; Δ% = −39.3%), as well as in CTG, where all anxious subjects became nonanxious (p = 0.01; Δ% = −100%) (Figure 3).
Table 4.
Absolute numbers of anxious and nonanxious subjects in all groups, before and after treatment.
| POSG | DTG | CTG | ||||
|---|---|---|---|---|---|---|
| HAM-A score | n = 11 | n = 10 | n = 9 | |||
| T0 | T1 | T0 | T1 | T0 | T1 | |
| HAM-A < 18 | 7 | 9 | 8 | 7 | 8 | 9 |
| HAM-A ≥ 18 | 4 | 2 | 2 | 3 | 1 | 0 |
Frequency of anxiety subjects was evaluated before and after treatment in POSG, DGT, and CTG. Negative test (nonanxious subjects) if total score < 18 and positive test (anxious subjects) if total score ≥ 18. HAM-A: Hamilton anxiety rating scale; POSG: psychobiotics oral suspension group; DTG: dietary treatment group; CTG: combined treatment group.
Figure 3.

Frequency change of anxious subjects in POSG, DTG, and CTG after treatment. Frequency of anxiety was evaluated before and after treatment in POSG, DTG, and CTG. Negative test (nonanxious 619 subjects) if total score < 18 and positive test (anxious subjects) if total score ≥ 18. Statistical significance attributed to results with ∗p < 0.05 between T0 and T1 by McNemar test. POSG:p = 0.03∗; DTG: p = 0.10; CTG: p = 0.01∗. POSG: psychobiotics oral suspension group; DTG: dietary treatment group; CTG: combined treatment group.
4. Discussion
Neurotransmitters and neuromodulators, secreted by bacteria, are able to modulate the state of the hosts' mood: gamma-aminobutyric acid is produced by certain Lactobacillus and Bifidobacterium species; norepinephrine is released by Escherichia, Bacillus, and Saccharomyces spp.; 5-hydroxytryptamine is released by Candida, Streptococcus, Escherichia, and Enterococcus spp.; and dopamine is produced by Bacillus and acetylcholine by Lactobacillus [45].
Fat mass increase in humans is related to several environmental factors, especially bad lifestyle habits, like sedentary living and excess of daily caloric, carbohydrate, and fat intake [11]. It is well known that the increase of body fat mass represents a strong risk factor for the development of metabolic and cardiovascular diseases [46–48].
Gut microbiota could play an essential role in fat mass increase and obesity development by invading the intestinal mucosa and causing systemic inflammation. On the other hand, the integrity of the intestinal barrier and a healthy intestinal microflora induce an anti-inflammatory effect that causes a consequent reduction in fat mass body composition [49].
Gut microbiota has been studied for decades in order to evaluate its impact on different aspects of human health and body composition [18–20], and recently, the role of probiotics with or without diet has been evaluated in terms of changing the overall health status [50, 51], body weight, body composition, and obesity [52, 53].
In our study, we enrolled normal weight, preobese, and obese up to the second-degree patients based on BMI, and, at the same time, we performed DXA to evaluate body composition. At baseline, the population resulted homogeneous in the three groups for the studied variables as reported in Table 2. On average, the population chosen had a TBFat percentage over 30%, who are considered obese according to De Lorenzo et al. [54].
The statistical comparison among the three groups exhibited that the subjects who belong to POSG did not report significant differences between time T0 and T1, in weight, waist and hip circumference, and body composition, except for the II (p = 0.03, Δ% = −1.92%). In accordance with the literature [55], the DTG demonstrated significant reductions in weight (p = 0.01; Δ% = −2.27%), BMI (p = 0.01; Δ% = −3.60%), waist circumference (p = 0.01; Δ% = −6.10%), hip circumference (p = 0.02, Δ% = −3.24%), TBFat (Kg) (p = 0.03, Δ% = −.32%), IMAT (p = 0.03; Δ% = −1.64%), and TBLean (Kg) (p = 0.02, Δ% = −1.64).
In the CTG, a higher variation of TBFat loss (p = 0.04, Δ% = −18.06%) and a statistically significant difference in the reduction of android (Δ% = −28.46%) and gynoid fat mass (Δ% = −11.46%) (p = 0.04) were highlighted. This preliminary data underlines the role of probiotics as a supplement for diet, as described by Kim et al. [56]. The 21-day period treatment is probably not enough to point out the positive effect of probiotic treatment alone on the improvement of weight and body composition, taking into account that most pharmacological treatments for obesity have a duration of at least three months, and in all cases, it is advised that they are coupled with lifestyle changes [57].
IMAT was significantly reduced in subjects treated only with diet (p = 0.03, Δ% = −1.64%), whereas the group under diet with probiotic intake showed a greater IMAT reduction (p = 0.04, Δ% = −21.77%). This result is the first evidence reported in the literature, and we speculate that it could be attributed to the capacity of probiotics to decrease the intestinal permeability with a consequent reduction of lipopolysaccharide and inflammatory cytokine levels [58].
The improvement of inflammatory state and oxidative status induced by probiotics administration [59, 60] could be able to contribute to the proper fatty acids and glucose metabolism, with the improvement of insulin resistance related to a better IMAT [61]. In CTG, the significant reduction of ABFat and waist/hip ratio, both related to insulin resistance and cardiovascular risk [62], could be due to an improvement of insulin profile.
BIA results show that POS intervention led to a significant reduction in II and, consequently, a resistance increase. The same trend was marked by Valentini Neto et al. [63], even if not significant.
However, a significant decrease of phase angle was observed in CTG, probably due to body water loss which translates into a resistance increase, despite of TBFat loss. Since in POSG we observed a phase angle reduction and a significant reduction of II, we can hypothesize a synergic action between diet and POS.
Multiple studies have demonstrated the existence of a clear link between gut microbiota and brain function. Given this, the gut microbiota appears to be a key regulator of mood and behavior [22]. Moreover, probiotics due to their effects on gut microbiota seem to have a positive impact on the management of psychological disorders, such as anxiety. In our study, POS supplementation led to a significant decrease of HAM-A score both in POSG than in CTG. This could be attributed to the effects of POS on molecular pathways in the central nervous system, which could also act on gut microbiota [23, 24]. We did not observe any significant difference in DTG on HAM-A score. This confirms that POS might have played a role in anxiety rather than only diet.
Based on the positive anxious score (total score ≥ 18), we observed that in both groups with POS, there was a significant decrease in the number of subjects that had a positive HAM-A test, with a score improvement of 5 points in POSG and 9.5 points in CTG. These results confirm that POS supplementation is associated with a reduction of anxiety, as shown by Wang et al. [64]. However, a balanced diet, associated with POS, seems to have a greater effect on the improvement of anxiety symptoms (Figure 4).
Figure 4.
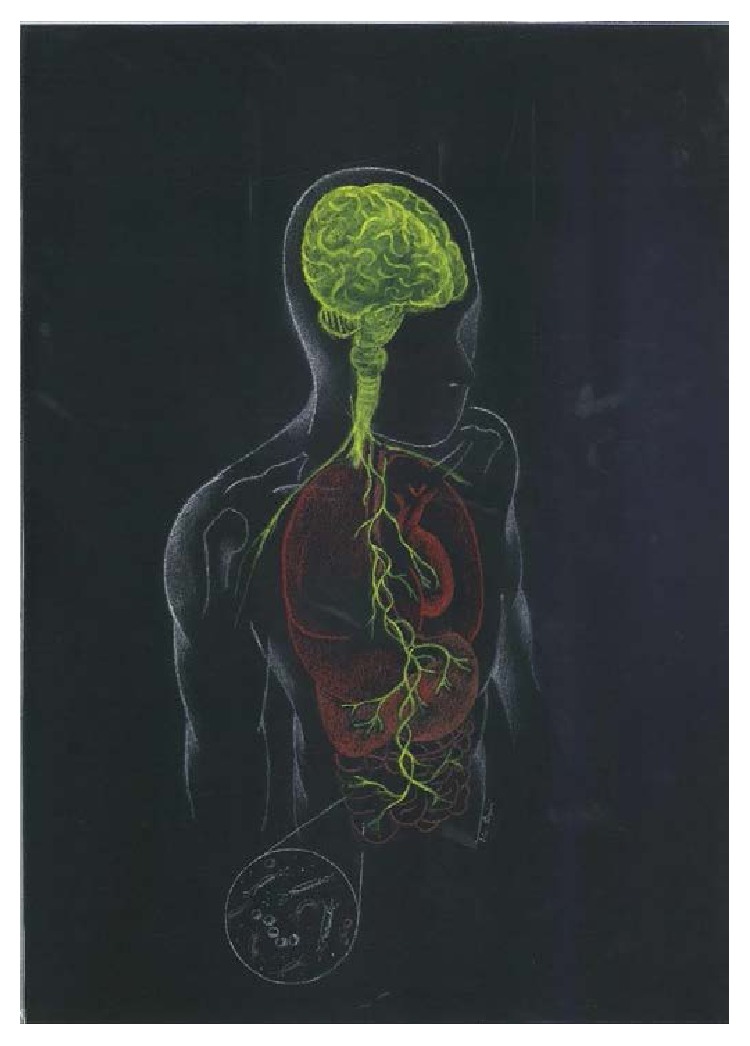
Gut-microbiota axis.
5. Conclusions
Despite the limitations of our study, related to the study design and the low sample size, our results highlighted that a three-week intake of selected psychobiotics represents a good approach to solve the problems related to obesity and behavior disorders. However, new clinical trials need to be performed on a larger population and for a longer period of treatment before definitive conclusions can be made.
Acknowledgments
The authors are indebted to all the subjects who volunteered in the study. The authors thank the entire medical team from the Section of Clinical Nutrition and Nutrigenomic, University of Rome Tor Vergata, Rome: Gemma Lou De Santis, Lorenzo Romano, Paola Gualtieri, Giorgia Cioccoloni, Magda Kavvadia, and Benedetta Primiceri. The authors also thank Mario Bigioni for painting Figure 4. This study was supported by grants from the Ministry of Agriculture, Food and Forestry (D.M.: 2017188 03/24/2011).
Abbreviations
- BMI:
Body mass index
- POS:
Probiotics oral suspension
- DT:
Dietary treatment
- BIA:
Bioimpedance analysis
- DXA:
Dual X-ray absorptiometry
- HAM-A:
Hamilton anxiety rating scale
- POSG:
Psychobiotics oral suspension group
- DTG:
Dietary treatment group
- CTG:
Combined treatment group
- WC:
Waist circumference
- HC:
Hip circumference
- WHR:
Waist-to-hip ratio
- II:
Impedance index
- TBFat:
Total body fat
- TBLean:
Total body lean
- ABF:
Android body fat
- GBF:
Gynoid body fat
- BMC:
Bone mineral content
- IMAT:
Intermuscular adipose tissue
- BMR:
Basal metabolic rate.
Conflicts of Interest
The authors declare that there is no conflict of interest regarding the publication of this article.
Authors' Contributions
Carmela Colica contributed to the interpretation of the data and drafted the manuscript. Patrizio Bollero, Ennio Avolio, Simona Ferarro, and Paola Sinibaldi Salimei collected the data and performed the experiments. Renata Costa de Miranda analyzed the data. Antonino De Lorenzo had primary responsibility for the final content. Laura Di Renzo conceived, designed the experiments, and drafted the manuscript. All the authors read and approved the final manuscript.
References
- 1.Qin J., Li R., Raes J., et al. A human gut microbial gene catalogue established by metagenomic sequencing. Nature. 2010;464(7285):59–65. doi: 10.1038/nature08821. [DOI] [PMC free article] [PubMed] [Google Scholar]
- 2.Clarke G., Stilling R. M., Kennedy P. J., Stanton C., Cryan J. F., Dinan T. G. Minireview: gut microbiota: the neglected endocrine organ. Molecular Endocrinology. 2014;28(8):1221–1238. doi: 10.1210/me.2014-1108. [DOI] [PMC free article] [PubMed] [Google Scholar]
- 3.Penders J., Thijs C., Vink C., et al. Factors influencing the composition of the intestinal microbiota in early infancy. Pediatrics. 2006;118(2):511–521. doi: 10.1542/peds.2005-2824. [DOI] [PubMed] [Google Scholar]
- 4.Yatsunenko T., Rey F. E., Manary M. J., et al. Human gut microbiome viewed across age and geography. Nature. 2012;486(7402):222–227. doi: 10.1038/nature11053. [DOI] [PMC free article] [PubMed] [Google Scholar]
- 5.Niedermaier T., Behrens G., Schmid D., Schlecht I., Fischer B., Leitzmann M. F. Body mass index, physical activity, and risk of adult meningioma and glioma: a meta-analysis. Neurology. 2015;85(15):1342–1350. doi: 10.1212/WNL.0000000000002020. [DOI] [PubMed] [Google Scholar]
- 6.Harvie M., Howell A., Vierkant R. A., et al. Association of gain and loss of weight before and after menopause with risk of postmenopausal breast cancer in the Iowa women’s health study. Cancer Epidemiology, Biomarkers & Prevention. 2005;14(3):656–661. doi: 10.1158/1055-9965.EPI-04-0001. [DOI] [PubMed] [Google Scholar]
- 7.Hall J. E., do Carmo J. M., da Silva A. A., Wang Z., Hall M. E. Obesity-induced hypertension: interaction of neurohumoral and renal mechanisms. Circulation Research. 2015;116(6):991–1006. doi: 10.1161/CIRCRESAHA.116.305697. [DOI] [PMC free article] [PubMed] [Google Scholar]
- 8.Grover S. A., Kaouache M., Rempel P., et al. Years of life lost and healthy life-years lost from diabetes and cardiovascular disease in overweight and obese people: a modelling study. The Lancet Diabetes and Endocrinology. 2015;3(2):114–122. doi: 10.1016/S2213-8587(14)70229-3. [DOI] [PubMed] [Google Scholar]
- 9.Blagojevic M., Jinks C., Jeffery A., Jordan K. P. Risk factors for onset of osteoarthritis of the knee in older adults: a systematic review and meta-analysis. Osteoarthritis and Cartilage. 2010;18(1):24–33. doi: 10.1016/j.joca.2009.08.010. [DOI] [PubMed] [Google Scholar]
- 10.Di Renzo L., Del Gobbo V., Bigioni M., Premrov M. G., Cianci R., De Lorenzo A. Body composition analyses in normal weight obese women. European Review for Medical and Pharmacological Sciences. 2006;10(4):191–196. [PubMed] [Google Scholar]
- 11.Swinburn B., Egger G., Raza F. Dissecting obesogenic environments: the development and application of a framework for identifying and prioritizing environmental interventions for obesity. Preventive Medicine. 1999;29, 6, Part 1:563–570. doi: 10.1006/pmed.1999.0585. [DOI] [PubMed] [Google Scholar]
- 12.Di Renzo L., Tyndall E., Gualtieri P., et al. Association of body composition and eating behavior in the normal weight obese syndrome. Eating and Weight Disorders. 2016;21(1):99–106. doi: 10.1007/s40519-015-0215-y. [DOI] [PubMed] [Google Scholar]
- 13.Speliotes E. K., Willer C. J., Berndt S. I., et al. Association analyses of 249,796 individuals reveal 18 new loci associated with body mass index. Nature Genetics. 2010;42(11):937–948. doi: 10.1038/ng.686. [DOI] [PMC free article] [PubMed] [Google Scholar]
- 14.Hindorff L. A., Sethupathy P., Junkins H. A., et al. Potential etiologic and functional implications of genome-wide association loci for human diseases and traits. Proceedings of the National Academy of Sciences of the United States of America. 2009;106(23):9362–9367. doi: 10.1073/pnas.0903103106. [DOI] [PMC free article] [PubMed] [Google Scholar]
- 15.Di Renzo L., Gloria-Bottini F., Saccucci P., et al. Role of interleukin-15 receptor alpha polymorphisms in normal weight obese syndrome. International Journal of Immunopathology and Pharmacology. 2009;22(1):105–113. doi: 10.1177/039463200902200112. [DOI] [PubMed] [Google Scholar]
- 16.Di Renzo L., Bertoli A., Bigioni M., et al. Body composition and -174G/C interleukin-6 promoter gene polymorphism: association with progression of insulin resistance in normal weight obese syndrome. Current Pharmaceutical Design. 2008;14(26):2699–2706. doi: 10.2174/138161208786264061. [DOI] [PubMed] [Google Scholar]
- 17.Turnbaugh P. J., Ley R. E., Mahowald M. A., Magrini V., Mardis E. R., Gordon J. I. An obesity-associated gut microbiome with increased capacity for energy harvest. Nature. 2006;444(7122):1027–1031. doi: 10.1038/nature05414. [DOI] [PubMed] [Google Scholar]
- 18.Samuel B. S., Shaito A., Motoike T., et al. Effects of the gut microbiota on host adiposity are modulated by the short-chain fatty-acid binding G protein-coupled receptor, Gpr41. Proceedings of the National Academy of Sciences of the United States of America. 2008;105(43):16767–16772. doi: 10.1073/pnas.0808567105. [DOI] [PMC free article] [PubMed] [Google Scholar]
- 19.Boulange C. L., Neves A. L., Chilloux J., Nicholson J. K., Dumas M. E. Impact of the gut microbiota on inflammation, obesity, and metabolic disease. Genome Medicine. 2016;8(1):p. 42. doi: 10.1186/s13073-016-0303-2. [DOI] [PMC free article] [PubMed] [Google Scholar]
- 20.Piya M. K., McTernan P. G., Kumar S. Adipokine inflammation and insulin resistance: the role of glucose, lipids and endotoxin. The Journal of Endocrinology. 2013;216(1):T1–15. doi: 10.1530/JOE-12-0498. [DOI] [PubMed] [Google Scholar]
- 21.Larsson E., Tremaroli V., Lee Y. S., et al. Analysis of gut microbial regulation of host gene expression along the length of the gut and regulation of gut microbial ecology through MyD88. Gut. 2012;61(8):1124–1131. doi: 10.1136/gutjnl-2011-301104. [DOI] [PMC free article] [PubMed] [Google Scholar]
- 22.Cryan J. F., Dinan T. G. Mind-altering microorganisms: the impact of the gut microbiota on brain and behavior. Nature Reviews Neuroscience. 2012;13(10):701–712. doi: 10.1038/nrn3346. [DOI] [PubMed] [Google Scholar]
- 23.Park A. J., Collins J., Blennerhassett P. A., et al. Altered colonic function and microbiota profile in a mouse model of chronic depression. Neurogastroenterology and motility: the official journal of the European Gastrointestinal Motility Society. 2013;25(9):733–e575. doi: 10.1111/nmo.12153. [DOI] [PMC free article] [PubMed] [Google Scholar]
- 24.Bested A. C., Logan A. C., Selhub E. M. Intestinal microbiota, probiotics and mental health: from Metchnikoff to modern advances: part II - contemporary contextual research. Gut Pathogens. 2013;5(1):p. 3. doi: 10.1186/1757-4749-5-3. [DOI] [PMC free article] [PubMed] [Google Scholar]
- 25.Dinan T. G., Stanton C., Cryan J. F. Psychobiotics: a novel class of psychotropic. Biological Psychiatry. 2013;74(10):720–726. doi: 10.1016/j.biopsych.2013.05.001]. doi: 10.1016/j.biopsych.2013.05.001]. [DOI] [PubMed] [Google Scholar]
- 26.Messaoudi M., Lalonde R., Violle N., et al. Assessment of psychotropic-like properties of a probiotic formulation (Lactobacillus helveticus R0052 and Bifidobacterium longum R0175) in rats and human subjects. The British Journal of Nutrition. 2011;105(5):755–764. doi: 10.1017/S0007114510004319. [DOI] [PubMed] [Google Scholar]
- 27.Benton D., Williams C., Brown A. Impact of consuming a milk drink containing a probiotic on mood and cognition. European Journal of Clinical Nutrition. 2007;61(3):355–361. doi: 10.1038/sj.ejcn.1602546. [DOI] [PubMed] [Google Scholar]
- 28.Diaz Heijtz R., Wang S., Anuar F., et al. Normal gut microbiota modulates brain development and behavior. Proceedings of the National Academy of Sciences of the United States of America. 2011;108(7):3047–3052. doi: 10.1073/pnas.1010529108. [DOI] [PMC free article] [PubMed] [Google Scholar]
- 29.Neufeld K. A., Kang N., Bienenstock J., Foster J. A. Effects of intestinal microbiota on anxiety-like behavior. Communicative & Integrative Biology. 2011;4(4):492–494. doi: 10.4161/cib.4.4.15702. [DOI] [PMC free article] [PubMed] [Google Scholar]
- 30.Lyte M., Li W., Opitz N., Gaykema R. P., Goehler L. E. Induction of anxiety-like behavior in mice during the initial stages of infection with the agent of murine colonic hyperplasia Citrobacter rodentium. Physiology & Behavior. 2006;89(3):350–357. doi: 10.1016/j.physbeh.2006.06.019. [DOI] [PubMed] [Google Scholar]
- 31.Bruce-Keller A. J., Keller J. N., Morrison C. D. Obesity and vulnerability of the CNS. Biochimica et Biophysica Acta. 2009;1792(5):395–400. doi: 10.1016/j.bbadis.2008.10.004. [DOI] [PMC free article] [PubMed] [Google Scholar]
- 32.Elias M. F., Elias P. K., Sullivan L. M., Wolf P. A., D'Agostino R. B. Lower cognitive function in the presence of obesity and hypertension: the Framingham heart study. International Journal of Obesity and Related Metabolic Disorders. 2003;27(2):260–268. doi: 10.1038/sj.ijo.802225. [DOI] [PubMed] [Google Scholar]
- 33.Waldstein S. R., Wendell C. R., Lefkowitz D. M., et al. Interactive relations of blood pressure and age to subclinical cerebrovascular disease. Journal of Hypertension. 2012;30(12):2352–2356. doi: 10.1097/HJH.0b013e3283595651. [DOI] [PMC free article] [PubMed] [Google Scholar]
- 34.Needham B. L., Epel E. S., Adler N. E., Kiefe C. Trajectories of change in obesity and symptoms of depression: the CARDIA study. American Journal of Public Health. 2010;100(6):1040–1046. doi: 10.2105/AJPH.2009.172809. [DOI] [PMC free article] [PubMed] [Google Scholar]
- 35.Ma J., Xiao L. Obesity and depression in US women: results from the 2005-2006 National Health and Nutritional Examination Survey. Obesity (Silver Spring) 2010;18:347–353. doi: 10.1038/oby.2009.213. [DOI] [PubMed] [Google Scholar]
- 36.Denoth F., Scalese M., Siciliano V., Di Renzo L., De Lorenzo A., Molinaro S. Clustering eating habits: frequent consumption of different dietary patterns among the Italian general population in the association with obesity, physical activity, sociocultural characteristics and psychological factors. Eating and Weight Disorders. 2016;21(2):257–268. doi: 10.1007/s40519-015-0225-9. [DOI] [PubMed] [Google Scholar]
- 37.El Ghoch M., Calugi S., Dalle Grave R. The effects of low-carbohydrate diets on psychosocial outcomes in obesity/overweight: a systematic review of randomized, controlled studies. Nutrients. 2016;8(7) doi: 10.3390/nu8070402. [DOI] [PMC free article] [PubMed] [Google Scholar]
- 38.Di Renzo L., Carbonelli M. G., Bianchi A., et al. Body composition changes after laparoscopic adjustable gastric banding: what is the role of -174G>C interleukin-6 promoter gene polymorphism in the therapeutic strategy? International Journal of Obesity. 2012;36(3):369–378. doi: 10.1038/ijo.2011.132. [DOI] [PubMed] [Google Scholar]
- 39.Di Renzo L., Carbonelli M. G., Bianchi A., et al. Impact of the -174 G > C IL-6 polymorphism on bioelectrical parameters in obese subjects after laparoscopic adjustable gastric banding. Journal of Obesity. 2012;2012:7. doi: 10.1155/2012/208953.208953 [DOI] [PMC free article] [PubMed] [Google Scholar]
- 40.Kushner R. F., Schoeller D. A., Fjeld C. R., Danford L. Is the impedance index (ht2/R) significant in predicting total body water? The American Journal of Clinical Nutrition. 1992;56(5):835–839. doi: 10.1093/ajcn/56.5.835. [DOI] [PubMed] [Google Scholar]
- 41.Bauer J., Thornton J., Heymsfield S., et al. Dual-energy X-ray absorptiometry prediction of adipose tissue depots in children and adolescents. Pediatric Research. 2012;72(4):420–425. doi: 10.1038/pr.2012.100. [DOI] [PMC free article] [PubMed] [Google Scholar]
- 42.De Lorenzo A., Noce A., Bigioni M., et al. The effects of Italian Mediterranean organic diet (IMOD) on health status. Current Pharmaceutical Design. 2010;16(7):814–824. doi: 10.2174/138161210790883561. [DOI] [PubMed] [Google Scholar]
- 43.Hamilton M. The assessment of anxiety states by rating. The British Journal of Medical Psychology. 1959;32(1):50–55. doi: 10.1111/j.2044-8341.1959.tb00467.x. [DOI] [PubMed] [Google Scholar]
- 44.Thompson E. Hamilton rating scale for anxiety (HAM-A) Occupational Medicine (London) 2015;65(7):p. 601. doi: 10.1093/occmed/kqv054. [DOI] [PubMed] [Google Scholar]
- 45.Dinan T. G., Stilling R. M., Stanton C., Cryan J. F. Collective unconscious: how gut microbes shape human behavior. Journal of Psychiatric Research. 2015;63:1–9. doi: 10.1016/j.jpsychires.2015.02.021. [DOI] [PubMed] [Google Scholar]
- 46.Cao H. Adipocytokines in obesity and metabolic disease. The Journal of Endocrinology. 2014;220(2):T47–T59. doi: 10.1530/JOE-13-0339. [DOI] [PMC free article] [PubMed] [Google Scholar]
- 47.Jokinen E. Obesity and cardiovascular disease. Minerva Pediatrica. 2015;67(1):25–32. [PubMed] [Google Scholar]
- 48.De Lorenzo A., Soldati L., Sarlo F., Calvani M., Di Lorenzo N., Di Renzo L. New obesity classification criteria as a tool for bariatric surgery indication. World Journal of Gastroenterology. 2016;22(2):681–703. doi: 10.3748/wjg.v22.i2.681. Review. [DOI] [PMC free article] [PubMed] [Google Scholar]
- 49.Winer D. A., Winer S., Dranse H. J., Lam T. K. Immunologic impact of the intestine in metabolic disease. The Journal of Clinical Investigation. 2017;127(1):33–42. doi: 10.1172/JCI88879. [DOI] [PMC free article] [PubMed] [Google Scholar]
- 50.Singh V. P., Sharma J., Babu S., Rizwanulla, Singla A. Role of probiotics in health and disease: a review. The Journal of the Pakistan Medical Association. 2013;63(2):253–257. [PubMed] [Google Scholar]
- 51.Lin C. S., Chang C. J., Lu C. C., et al. Impact of the gut microbiota, prebiotics, and probiotics on human health and disease. Biomed Journal. 2014;37(5):259–268. doi: 10.4103/2319-4170.138314. [DOI] [PubMed] [Google Scholar]
- 52.Osterberg K. L., Boutagy N. E., McMillan R. P., et al. Probiotic supplementation attenuates increases in body mass and fat mass during high-fat diet in healthy young adults. Obesity (Silver Spring) 2015;23(12):2364–2370. doi: 10.1002/oby.21230. [DOI] [PubMed] [Google Scholar]
- 53.Stenman L. K., Lehtinen M. J., Meland N., et al. Probiotic with or without fiber controls body fat mass, associated with serum zonulin, in overweight and obese adults-randomized controlled trial. eBioMedicine. 2016;13:190–200. doi: 10.1016/j.ebiom.2016.10.036. [DOI] [PMC free article] [PubMed] [Google Scholar]
- 54.De Lorenzo A., Bianchi A., Maroni P., et al. Adiposity rather than BMI determines metabolic risk. International Journal of Cardiology. 2013;166(1):111–117. doi: 10.1016/j.ijcard.2011.10.006. [DOI] [PubMed] [Google Scholar]
- 55.Di Daniele N., Petramala L., Di Renzo L., et al. Body composition changes and cardiometabolic benefits of a balanced Italian Mediterranean diet in obese patients with metabolic syndrome. Acta Diabetologica. 2013;50(3):409–416. doi: 10.1007/s00592-012-0445-7. [DOI] [PubMed] [Google Scholar]
- 56.Kim M., Kim M., Kang M., et al. Effects of weight loss using supplementation with Lactobacillus strains on body fat and medium-chain acylcarnitines in overweight individuals. Food & Function. 2017;8(1):250–261. doi: 10.1039/c6fo00993j. [DOI] [PubMed] [Google Scholar]
- 57.Clements J. N., Shealy K. M. Liraglutide: an injectable option for the management of obesity. The Annals of Pharmacotherapy. 2015;49(8):938–944. doi: 10.1177/1060028015586806. [DOI] [PubMed] [Google Scholar]
- 58.Miraghajani M., Dehsoukhteh S. S., Rafie N., Hamedani S. G., Sabihi S., Ghiasvand R. Potential mechanisms linking probiotics to diabetes: a narrative review of the literature. São Paulo Medical Journal. 2017;135(2):169–178. doi: 10.1590/1516-3180.2016.0311271216. [DOI] [PMC free article] [PubMed] [Google Scholar]
- 59.Tabuchi M., Ozaki M., Tamura A., et al. Antidiabetic effect of Lactobacillus GG in streptozotocin-induced diabetic rats. Bioscience, Biotechnology, and Biochemistry. 2003;67(6):1421–1424. doi: 10.1271/bbb.67.1421. [DOI] [PubMed] [Google Scholar]
- 60.Ejtahed H. S., Mohtadi-Nia J., Homayouni-Rad A., Niafar M., Asghari-Jafarabadi M., Mofid V. Probiotic yogurt improves antioxidant status in type 2 diabetic patients. Nutrition. 2012;28(5):539–543. doi: 10.1016/j.nut.2011.08.013. [DOI] [PubMed] [Google Scholar]
- 61.Miljkovic I., Cauley J. A., Wang P. Y., et al. Abdominal myosteatosis is independently associated to hyperinsulinemia and insulin resistance among older men without diabetes. Obesity (Silver Spring, Md) 2013;21(10):2118–2125. doi: 10.1002/oby.20346. [DOI] [PMC free article] [PubMed] [Google Scholar]
- 62.Yang X. J., Yao X. H., Yan K., et al. Relationship between body fat distribution and insulin resistance, islet β cell function and metabolic disorders in adults. Zhonghua Yi Xue Za Zhi. 2013;93(36):2867–2870. [PubMed] [Google Scholar]
- 63.Valentini Neto J., de Melo C. M., Lima Ribeiro S. M. Effects of three-month intake of synbiotic on inflammation and body composition in the elderly: a pilot study. Nutrients. 2013;5(4):1276–1286. doi: 10.3390/nu5041276. [DOI] [PMC free article] [PubMed] [Google Scholar]
- 64.Wang H., Lee I.-S., Braun C., Enck P. Effect of probiotics on central nervous system functions in animals and humans: a systematic review. Journal of Neurogastroenterology and Motility. 2016;22(4):589–605. doi: 10.5056/jnm16018. [DOI] [PMC free article] [PubMed] [Google Scholar]