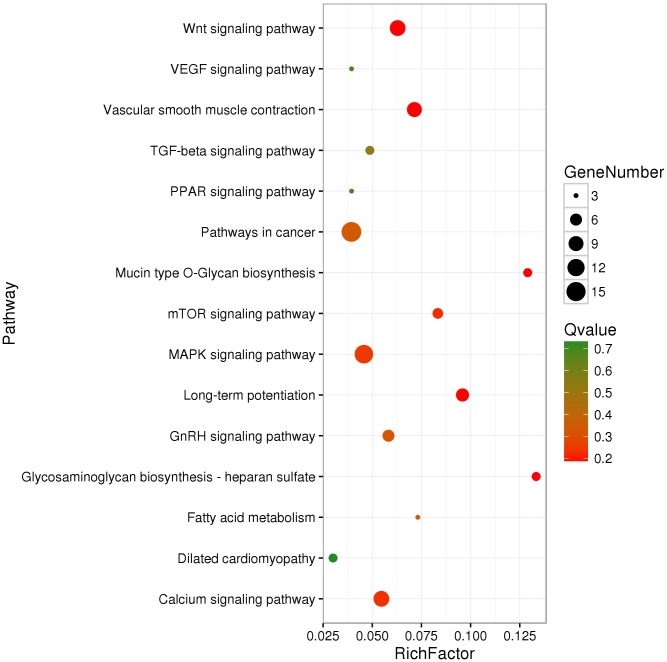
Figure 3. KEGG-enriched scatter plot of DMGs between Tibetan chicken (TC) and Chahua chicken (CH).
The x-axis represents the rich factor. The rich factor is the ratio of differentially methylated gene (DMG) numbers annotated in this pathway term to the total gene numbers annotated in this pathway term. The y-axis shows the pathway enrichment terms. The Q-value represents the corrected p value, where a smaller Q-value indicates a higher significance.

