

Abstract
Aberrant proliferation and activation of lung fibroblasts contribute to the initiation and progression of idiopathic pulmonary fibrosis (IPF). However, the mechanisms responsible for the proliferation and activation of fibroblasts are not fully understood. The objective of this study was to investigate the role of miR-101 in the proliferation and activation of lung fibroblasts. miR-101 expression was determined in lung tissues from patients with IPF and mice with bleomycin-induced pulmonary fibrosis. The regulation of miR-101 and cellular signaling was investigated in pulmonary fibroblasts in vitro. The role of miR-101 in pulmonary fibrosis in vivo was studied using adenovirus-mediated gene transfer in mice. The expression of miR-101 was down-regulated in fibrotic lungs from patients with IPF and bleomycin-treated mice. The down-regulation of miR-101 occurred via the E26 transformation-specific (ETS) transcription factor. miR-101 suppressed the WNT5a-induced proliferation of lung fibroblasts by inhibiting NFATc2 signaling via targeting Frizzled receptor 4/6 and the TGF-β-induced activation of lung fibroblasts by inhibition of SMAD2/3 signaling via targeting the TGF-β receptor 1. Adenovirus-mediated miR-101 gene transfer in the mouse lung attenuated bleomycin-induced lung fibrosis and improved lung function. Our data suggest that miR-101 is an anti-fibrotic microRNA and a potential therapeutic target for pulmonary fibrosis.
Keywords: fibroblast, pulmonary fibrosis, transforming growth factor β (TGF-β), Wnt pathway, Wnt signaling
Introduction
Idiopathic pulmonary fibrosis (IPF)2 is a lethal fibrotic lung disease characterized by enhanced fibroblast proliferation, collagen synthesis, extracellular matrix deposition, and alveolar epithelial type II cell hyperplasia. The IPF fibroblastic focus consists of activated fibroblasts in a collagen-rich matrix. Several cell types have been posited as a source for IPF fibroblasts, including (i) local resident pulmonary fibroblasts (1, 2), (ii) epithelial–to–mesenchymal transition (3–5), and (iii) circulating fibrocytes (6, 7). Recently, mesenchymal progenitor cells, isolated from human IPF lung tissue, have been shown to serve as a cell-of-origin for disease-mediating IPF fibroblasts (8). However, the relative contribution of each of these sources to the fibroproliferative process remains unclear. Nevertheless, the abnormal proliferation and activation of fibroblasts are thought to be the major factors driving fibrotic progression in IPF (9, 10).
MicroRNAs (miRNAs) have been implicated in a number of lung diseases, including lung cancer, asthma, lung inflammation, chronic obstructive pulmonary diseases, and IPF. Let-7 is expressed in alveolar epithelial cells and is down-regulated in IPF. The inhibition of let-7 results in epithelial–to–mesenchymal transition and collagen deposition (11). However, whether restoration of let-7 can prevent or reverse pulmonary fibrosis in animal models is unknown. Another down-regulated miRNA in IPF is miR-29, which is localized in interstitial cells and regulates fibrotic genes in fibroblasts in vitro (12). miR-29 is also a key player in the remodeling of the extracellular matrix in IPF (13) and has recently been shown to inhibit bleomycin-induced lung fibrosis (14). miR-21 is up-regulated in myofibroblasts in IPF, and antisense miR-21 attenuates bleomycin-mediated pulmonary fibrosis (15). Notably, let-7, miR-29, and miR-21 target TGF-β signaling and/or are regulated by TGF-β (11, 12, 15). Hypoxia-inducible miR-210 enhances fibroblast proliferation (16). miR-326 directly targets TGF-β, thereby reducing pulmonary fibrosis (17). Our recent studies have shown that miR-424 promotes myofibroblast differentiation during epithelial–to–mesenchymal transition (18). Because the expression of many miRNAs is altered in IPF, these studies underscore the need for further investigations to identify critical miRNAs that regulate key pathways for pulmonary fibrosis.
In this study, we identified miR-101 as one of the most down-regulated miRNAs in IPF patients. miR-101 inhibited the proliferation and activation of lung fibroblasts by targeting the receptors of the non-canonical Wnt and TGF-β signaling pathways. Adenovirus-mediated gene transfer of miR-101 to the lung reduced pulmonary fibrosis in a pre-clinical mouse model. Thus, our studies demonstrated that miR-101 is an anti-fibrotic miRNA.
Results
miR-101 is down-regulated in IPF
Using an miRNA microarray, we analyzed global miRNA expression profiles of the lung tissues from 28 IPF patients obtained from the Lung Tissue Research Consortium. The IPF patient specimens were classified into three groups according to the pre-bronchodilator forced vital capacity (FVC) % value: group 1, normal lung function (FVC% >80); group 2, mild lung restriction (FVC 50–80%); and group 3, severe lung restriction (FVC <50%). We found 29 miRNAs that were significantly altered between at least two groups (Table 1 and Fig. 1a). We verified the changes of 14 selected miRNAs using real-time PCR (Figs. 1b and 2).
Table 1.
Significantly dysregulated miRNAs in IPF samples
Twenty eight IPF lung samples were classified as three groups according to the pre-bronchodilator forced vital capacity (FVC) % values: <50% predicted FVC group; 50–80% predicted FVC group, and >80% predicted FVC group. The numbers are ratios of miRNA expression of two groups. The statistical significance was determined by two-tailed Student's t test considering unequal variance.
| miRNA | 50–80% FVC to >80% FVC group | <50% FVC to >80% FVC group | <50% FVC to 50% >80% FVC group |
|---|---|---|---|
| hsa-miR-124 | 1.9 | 5.0a | 2.6a |
| hsa-miR-215 | 1.2 | 3.3a | 2.7a |
| hsa-miR-1300 | 1.6 | 2.7a | 1.7 |
| hsa-miR-668 | 1.6 | 2.6a | 1.6 |
| hsa-miR-552 | 6.3a | 2.5a | 0.4a |
| hsa-miR-766 | 1.0 | 2.0a | 1.9 |
| hsa-miR-7 | 1.2 | 2.0a | 1.7 |
| hsa-miR-1,249 | 2.9a | 1.8 | 0.6 |
| hsa-miR-493a | 0.4 | 1.4 | 3.7a |
| hsa-miR-181a-2a | 0.6 | 1.3 | 2.1a |
| hsa-miR-1297 | 2.3a | 0.9 | 0.4 |
| hsa-miR-101 | 0.85 | 0.21a | 0.24a |
| hsa-miR-597 | 0.68 | 0.22a | 0.33 |
| hsa-miR-887 | 0.52 | 0.32a | 0.62 |
| hsa-miR-27b | 0.55 | 0.33a | 0.60 |
| hsa-miR-487b | 0.54 | 0.34a | 0.63 |
| hsa-miR-5,688 | 0.44 | 0.35a | 0.8 |
| hsa-miR-142-5p | 0.48a | 0.37a | 0.76 |
| hsa-let-7a-2 | 0.45a | 0.39a | 0.86 |
| hsa-miR-1,274b | 0.51 | 0.41a | 0.81 |
| hsa-miR-491-3p | 0.45 | 0.42a | 0.94 |
| hsa-miR-1,298 | 0.73 | 0.45a | 0.62 |
| hsa-miR-888a | 0.52 | 0.50a | 0.96 |
| hsa-miR-519d | 0.60 | 0.52a | 0.85 |
| hsa-miR-141 | 1.01 | 0.53a | 0.53a |
| hsa-miR-877 | 1.32 | 0.57 | 0.43a |
| hsa-miR-589 | 1.35 | 0.60 | 0.44a |
| hsa-miR-299-3p | 2.12 | 0.69 | 0.32a |
| hsa-miR-195 | 1.55 | 0.81 | 0.52a |
a p < 0.05.
Figure 1.

miR-101 expression is down-regulated in fibrotic lungs. a, heat map of miRNA expression in IPF patients. Heat map of these dysregulated miRNAs was built by using GenePattern software (http://www.broadinstitute.org/cancer/software/genepattern).3 b, miR-101 expression in IPF lungs. miRNA microarray and real-time PCR were performed using total RNA isolated from the lung tissues of IPF patients. n = 10 for the <50% FVC group, n = 10 for the 50–80% FVC group, and n = 8 for the >80% predicted FVC group. Real-time PCR results were normalized to U6. Data were expressed as a ratio over the >80% FVC group. c and d, real-time PCR analysis showing the down-regulation of mature miR-101a, pri-miR-101a, and pri-miR-101b expression in the lungs (n = 6) and mature miR-101a expression in the fibroblasts (n = 3) isolated from saline (Sal)- and bleomycin (Bleo)-treated mice. The expression levels were normalized to U6 (for mature miR-101) or GAPDH (for pri-miR-101) and were expressed as a ratio of saline. The results are presented as the mean ± S.E. ANOVA followed by Tukey's HSD test was performed for multiple comparisons. *, p < 0.05; **, p < 0.01; ***, p < 0.001.
Figure 2.

Verification of the miRNA microarray data. miRNA microarray and real-time PCR were performed using total RNA isolated from the lung tissues of IPF patients. n = 10 for the <50% FVC group, n = 10 for the 50–80% FVC group, and n = 8 for the >80% predicted FVC group. Real-time PCR results were normalized to U6. Data were expressed as a ratio over the >80% FVC group. The results are presented as the mean ± S.E. *, p < 0.05 versus >80% FVC group in the microarray analysis. #, p < 0.05 versus >80% FVC group in the real-time PCR analysis.
We performed miRNA-target predictions and pathway analysis using TargetScan and KEGG. miR-101 had predicted targets in TGF-β and Wnt signaling that are involved in fibroblast proliferation and activation (Table 2). Furthermore, miR-101 had the greatest change in IPF lungs among the down-regulated miRNAs. Therefore, we chose miR-101 for further study.
Table 2.
Signaling pathways predicted to be regulated by miR-101
Mapping miR-101 to signaling pathways was accomplished using DIANA-miRpath software. The KEGG pathway targeted by miR-101 with false discovery rate corrected p value less than 0.05 were listed in the table.
| KEGG pathway | p value | No. of genes |
|---|---|---|
| Fatty acid biosynthesis | 1.18E-20 | 2 |
| Proteoglycans in cancer | 8.88E-07 | 31 |
| Adherens junction | 1.07E-05 | 19 |
| Hippo signaling pathway | 1.42E-05 | 24 |
| Colorectal cancer | 0.000223 | 15 |
| Renal cell carcinoma | 0.002687 | 15 |
| Pathways in cancer | 0.002989 | 47 |
| Circadian entrainment | 0.005853 | 10 |
| TGF-β signaling pathway | 0.006452 | 12 |
| Oocyte meiosis | 0.018362 | 19 |
| Viral carcinogenesis | 0.018362 | 28 |
| Axon guidance | 0.019612 | 15 |
| Protein processing in endoplasmic reticulum | 0.026431 | 23 |
| Ubiquitin-mediated proteolysis | 0.027623 | 23 |
| Glioma | 0.027623 | 11 |
| MAPK-signaling pathway | 0.029187 | 35 |
| Cell cycle | 0.030573 | 23 |
| p53 signaling pathway | 0.030573 | 14 |
| Endocytosis | 0.030573 | 22 |
| Transcriptional misregulation in cancer | 0.030573 | 24 |
| Lysine degradation | 0.030705 | 6 |
| Pancreatic cancer | 0.031679 | 13 |
| Fatty acid metabolism | 0.034377 | 2 |
| Bladder cancer | 0.043925 | 9 |
| Amyotrophic lateral sclerosis (ALS) | 0.043925 | 8 |
| Pantothenate and CoA biosynthesis | 0.045609 | 3 |
| Dorso-ventral axis formation | 0.045609 | 7 |
| Progesterone-mediated oocyte maturation | 0.047813 | 14 |
| Chronic myeloid leukemia | 0.047813 | 13 |
| Adrenergic signaling in cardiomyocytes | 0.047813 | 17 |
| Wnt signaling pathway | 0.047813 | 20 |
| Focal adhesion | 0.047813 | 28 |
There are two miR-101 isoforms, miR-101-1 and miR-101-2 in humans and miR-101a and miR-101b in mice. All of the miR-101 isoforms have the same mature sequence, with the exception of miR-101b, which has one base difference. Real-time PCR analyses in this study were based on the human miR-101 or mouse miR-101a mature sequences. Consistent with our findings using human lung tissue, we found that mouse miR-101a expression was reduced in the lung tissue from an experimental mouse model of bleomycin-induced pulmonary fibrosis (Fig. 1c). miR-101a down-regulation was also observed in fibroblasts isolated from bleomycin-treated mice (Fig. 1c).
It was reported that there is an miRNA processing defect in IPF, which may cause a more global decrease in multiple miRNAs (19). However, similar to mature miRNAs, the expression levels of pri-miR-101-a and pri-miR-101-b in the lung tissues of the bleomycin-treated mice were also lower than these of the control groups (Fig. 1d), suggesting that the miRNA processing defect is not the major mechanism for the down-regulation of miR-101 in IPF.
miR-101 is regulated by the ETS transcription factor
Human miR-101-2 is intragenic and located within the protein-coding RCL1 gene on chromosome 9, suggesting that it is co-regulated with the host RCL1 gene. In contrast, human miR-101-1 is intergenic and located in chromosome 1. Therefore, we examined the transcription start site of miR-101-1 using the RACE assay. We chose six primers at different positions upstream of precursor miR-101 for the 5′-RACE reaction (Table 5). Only one PCR product (500 bp) was obtained using the primer PROM-MIR-101-1-RE4 (GTGTCGGTCAACGGCATCCTTTCT) among all of the primers tested. Sequencing analysis revealed that the amplified RACE cDNA product was located upstream of miR-101-1. Then, the sequence of the RACE product was used to search the NCBI and UCSC genome databases. We found several ESTs (including BU786820, BX476649, and AI275070) located downstream of the RACE product. These ESTs were assembled into a transcript and aligned with the human genome. The assembled transcript was primary miR-101-1, with a length of 1,183 bp. Primary miR-101-1 consists of three exons, with miR-101-1 located in exon 3 (Fig. 3a). The sizes of three exons are 129, 175, and 879 bp. Primary miR-101-1 has a typical poly(A) tail signal (AATAAA). The host miR-101-1 gene is 9,944 bp. The transcription start site is located at position chr1:65067704 (genome version hg38). The transcriptional start site distance to the pre-miR-101-1 is 9,224 bp.
Table 5.
Primers for 5′-RACE reaction
| Primer name | Sequence | Position to pre-hsa-miR-101-1 |
|---|---|---|
| PROM-MIR-101-1-RE1 | CTTGGGTCCCTGCTCTTCCTCTGT | −7094 |
| PROM-MIR-101-1-RE2 | AAATGCCACTGACGGACCCCTCTT | −8067 |
| PROM-MIR-101-1-RE3 | AACAACAAACCCAGTCCGGCAACA | −8576 |
| PROM-MIR-101-1-RE4 | GTGTCGGTCAACGGCATCCTTTCT | −14 |
| PROM-MIR-101-1-RE5 | CTGACTTTGAGCACTGGCCCTAAT | −3472 |
| PROM-MIR-101-1-RE6 | TGAAACACGAGAGGGCAACGAAGA | −1596 |
Figure 3.

Regulation of miR-101 expression by ETS. a, genomic structure of human miR-101-1 and the schematic presentation of potential ETS-binding sites in the upstream regions of the human miR-101-1 and miR-101-2 promoters. TSS, transcription start site. b and c, effects of ETS1/2 on human miR-101-1 and miR-101-2 promoter activities without or with ETS-binding site mutations in fibroblasts. Conserved ETS-binding site 1 (CCGGAAG) and site 5 (TTTCCTA) in human miR-101-1 promoter were mutated to site 1 (CCactgG) and site 5 (TTTagaA). Conserved ETS-binding site 2 (ATTCCTC) in human miR-101-2 promoter was mutated to site 2 (ATagcaC). HFL1 cells were transfected with 50 ng of the promoter reporter construct of miR-101-1 wild type (WT), miR-101-1-mute1, miR-101-1-mute5, miR-101-2 WT, and miR-101-2-mute2, 100 ng of the pCMV-ETS1, pCMV-ETS2 or control (CON) vector, and the normalization TK vector for 48 h. Firefly and Renilla luciferase activities were measured. ETS1 and ETS2 protein levels were determined by Western blotting. Data were expressed as a fold change over the control vector. n = 3. d and e, miR-101 expression in ETS1/2 knockdown CCD-8Lu fibroblasts. Fibroblasts were treated with lentiviral ETS1 or ETS2 shRNA or the virus control at an m.o.i. of 100 for 48 h. ETS1 and ETS2 protein levels were determined by Western blotting. miR-101 expression was determined by real-time PCR and normalized to U6 snRNA, n = 4. f, down-regulation of ETS1 and ETS2 mRNA expression in saline (Sal)- and bleomycin (Bleo)-treated mouse lung tissues. The expression of ETS1/2 was relative to GAPDH. n = 3. The results are presented as the mean ± S.E. ANOVA followed by Tukey's HSD test was performed for multiple comparisons. *, p < 0.05; **, p < 0.01; ***, p < 0.001.
Promoter analysis using TRANSFAC 8.3 revealed that there were six and five predicted ETS transcription-binding sites in the 2.5-kb region upstream from the transcription start site of human miR-101-1 and miR-101-2, respectively (Fig. 3a). Therefore, we determined whether ETS1/2 affected miR-101 promoter activity. ETS1/2 increased the promoter activities of both miR-101-1 and miR-101-2 in HFL1 fibroblasts although their effects on miR-101-1 were bigger. (Fig. 3b). The overexpression of ETS1 and ETS2 was confirmed by Western blot analysis (Fig. 3c).
To determine which predicated ETS-binding sites are functional, we tested whether the mutation of selected ETS-binding sites abolished the ETS-induced miR-101 promoter activity. Considering that the conserved binding sites of a transcription factor are usually functional, we only mutated the conserved ETS-binding sites: binding sites 1 and 5 in the human miR-101-1 promoter and binding site 2 in the human miR-101-2 promoter. We found that ETS1- or ETS2-induced miR-101-1 promoter activities were significantly suppressed by the mutation of binding site 1, but not binding site 5, suggesting that ETS1/2 likely binds the binding site 1 in the miR-101-1 promoter. The mutation of binding site 2 in the miR-101-2 promoter had no effects on ETS1- or ETS2-induced miR-101-2 promoter activities (Fig. 3b). The ETS-binding sites that are responsible for the effects of ETS1/2 on miR-101-2 promoter activity remain to be determined.
To determine whether endogenous miR-101 expression was regulated by ETS1/2, we reduced the ETS1/2 protein level in CCD-8Lu fibroblasts using lentiviral shRNAs (Fig. 3d). Silencing of either ETS1 or ETS2 inhibited miR-101 expression by 50–60% (Fig. 3e). The ETS1 and ETS2 mRNA expression levels were significantly down-regulated in fibrotic lungs (Fig. 3f).
miR-101 inhibits fibroblast proliferation through WNT5a-NFATc2 signaling
The proliferation of fibroblasts is postulated to be one of the major contributors to the increase in the number of fibroblasts in the fibroblastic foci. A prior study has found that WNT5a is up-regulated in IPF and promotes fibroblast proliferation (20). We found that WNT5a and -5b were the major WNT ligands expressed in pulmonary fibroblasts from normal human lungs (HFL1) and IPF lungs (LL29) (Fig. 4a). Gain of function of WNT5a increased the proliferation of HFL1 and LL29 fibroblasts, whereas loss of function of WNT5a decreased their proliferation (Fig. 4, b–d); this result is consistent with a previous report (20).
Figure 4.

WNT5a increases fibroblast proliferation. a, real-time PCR analysis showing the high expression of WNT5a and WNT5b mRNAs in HFL1 and LL29 cells. The expression levels were relative to GAPDH from two cell preparations, each performed in duplicate. b, WNT5a induces fibroblast proliferation. HFL1 and LL29 cells were serum-starved for 24 h and then stimulated for 12 h with 1 μg/ml WNT5a. Cell proliferation was determined using the BrdU cell proliferation kit. n = 3. c and d, knockdown of WNT5a suppresses fibroblast proliferation. HFL1 and LL29 cells were treated with a lentivirus expressing shRNA targeting WNT5a or the virus control (siCON) at an m.o.i. of 50 for 48 h. Cell proliferation was determined using a BrdU cell proliferation kit. n = 3. WNT5a protein expression was determined by Western blotting. The results are presented as the mean ± S.D. ***, p < 0.001.
WNT5a binds with the Frizzled receptor/Ror and activates the heterotrimeric G-protein and phospholipase C, leading to the generation of inositol 1,4,5-trisphosphate and an increase in Ca2+ (21). This activates calcineurin, which dephosphorylates NFAT and results in the translocation of NFAT into the nucleus (22). Treatment of LL29 cells with recombinant WNT5a led to NFATc2 nuclear translocation, as determined by immunofluorescence analysis (Fig. 5a). Cyclosporin A (CsA), an inhibitor of calcineurin, reduced WNT5a-induced fibroblast proliferation (Fig. 5b). Knockdown of FzD4, FzD6, and NFATc2 also inhibited WNT5a-induced fibroblast proliferation (Fig. 5, c and d). Real-time PCR showed that WNT5a mRNA level was increased in IPF patients (Fig. 5e). This result is consistent with a previous report (20). NFATc2 mRNA level was also increased in the severe IPF groups, but it did not reach a significant level (Fig. 5f). These data indicate that WNT5a-induced fibroblast proliferation occurs through NFATc2 signaling in pulmonary fibroblasts.
Figure 5.

WNT5a induces fibroblast proliferation via WNT5a-FZD4/6-NFATc2 signaling. a, NFATc2 nuclear localization in fibroblasts induced by WNT5a. LL29 cells were serum-starved for 24 h and then stimulated with none (CON) or WNT5a (1 μg/ml) for 4 h. The cells were fixed for immunocytochemical analysis using anti-NFATc2 antibodies and Alexa Fluor 488-conjugated secondary antibodies. Nuclei were stained with DAPI. Scale bar, 50 μm. b, inhibition of fibroblast proliferation by CsA. LL29 cells were treated with CsA (1 μg/ml) for 24 h and then stimulated with 1 μg/ml WNT5a for 12 h. Cell proliferation was determined by the BrdU assay. n = 3. c and d, effects of silencing FZD4, FZD6, and NFATc2 on fibroblast proliferation. LL29 cells were infected with a lentivirus expressing shRNA targeting FZD4, FZD6, or NFATc2 (siFZD4, siFZD6, or siNFACTc2, respectively) or a virus control (siCON) at an m.o.i. of 50 for 48 h. Protein levels were determined by Western blotting. The silenced cells were serum-starved for 24 h and then stimulated with 1 μg/ml WNT5a for 12 h. Cell proliferation was determined by the BrdU assay. n = 3–6. e and f, WNT5a and NFATc2 expression in IPF patients. Real-time PCR were performed using total RNA isolated from the lung tissues of IPF patients. n = 10 for the <50% FVC group, n = 10 for the 50–80% FVC group, and n = 8 for the >80% predicted. The expression level was relative to GAPDH. The results are presented as the mean ± S.E. ANOVA followed by Tukey's HSD test was performed for multiple comparisons. *, p < 0.05; **, p < 0.01; ***, p < 0.001.
To examine the effects of miR-101 on fibroblast proliferation, we overexpressed human miR-101 in LL29 fibroblasts with a miR-101-1 lentivirus and then stimulated them with WNT5a. miR-101 inhibited WNT5a-induced fibroblast proliferation by using the BrdU cell proliferation assay (Fig. 6a). This result was further confirmed by histological staining of BrdU, which showed the increased stained cell numbers and intensity in the WNT5a-treated cells (Fig. 6b). Moreover, miR-101 also suppressed NFATc2 signaling based on the observation that it decreased WNT5a-induced NFATc2 nuclear translocation and NFATc2 mRNA levels (Fig. 6, c and d). Silencing FZD4 and FZD6 suppressed the WNT5a-induced NFATc2 nuclear translocation (Fig. 6e). These results suggest that miR-101 inhibits WNT5a-stimulated cell proliferation through WNT5a/NFATc2 signaling.
Figure 6.

miR-101 inhibits WNT5a-induced fibroblast proliferation. a, effect of overexpression of miR-101 on fibroblast proliferation. LL29 cells were treated with a lentivirus expressing miR-101-1 or the virus control (VC) at an m.o.i. of 50 for 48 h. The cells were serum-starved for 24 h and then stimulated for 12 h with 1 μg/ml WNT5a. Cell proliferation was determined by the BrdU assay (n = 5). b, histological staining of BrdU showing the effect of WNT5a and miR-101 on fibroblast proliferation. Scale bar, 50 μm. c, nuclear amount of NFATc2 was decreased by the overexpression of miR-101. LL29 cells were treated with a lentivirus expressing miR-101-1 and then stimulated with WNT5a (1 μg/ml). Nuclei were extracted using the NE-PER nuclear and cytoplasmic extraction reagents (Thermo Fisher Scientific, Waltham, MA) to determine the expression of the NFATc2 and H1 proteins by Western blotting. d, overexpression of miR-101-1 suppressed WNT5a-induced NFATc2 mRNA expression in LL29 cells by real-time PCR analysis. The expression levels were relative to GAPDH. n = 3. e, NFATc2 nuclear localization in the absence of FZD4 and FZD6. LL29 cells were split into a chamber slide at 2,000 cells per chamber. After a 24-h culture, cells were infected with lentiviral shFZD4 and shFZD6 (m.o.i. 25 for each) or shCon at m.o.i. = 50 for 48 h. Cells were serum-starved for another 24 h and stimulated with WNT5a (1 μg/ml) for 4 h. The cells were fixed for immunocytochemical analysis using anti-NFATc2 antibodies and Alexa Fluor 488-conjugated secondary antibodies. Nuclei were stained with DAPI. Scale bar, 50 μm. The results are represented as the mean ± S.E. ANOVA followed by Tukey's HSD test was performed for multiple comparisons. , p < 0.05; **, p < 0.01.
miR-101 inhibits fibroblast activation via TGF-β/Smad2/3 signaling
Myofibroblasts are a cellular major component of fibroblastic foci. They are characterized by induced α-SMA expression and stress fiber formation, an enhanced contractile ability, and an increase in collagen synthesis and deposition (23, 24). Fibroblasts are stimulated to differentiate to myofibroblasts via TGF-β/Smad2/3 signaling. Overexpressing miR-101 in LL29 IPF fibroblasts inhibited TGF-β1-induced protein expression of α-SMA and the collagens COL1A1 and COL3A1 (Fig. 7a) and mRNA expression of α-SMA and the collagens COL1A1, COL3A1, and COL4A1 (Fig. 7b). In contrast, anti-miR-101 increased the protein and mRNA levels of α-SMA and the collagens in CCD-8 Lu normal lung fibroblasts (Fig. 7, c and d). Furthermore, miR-101 reduced TGF-β1-induced contractile activity as determined by the collagen gel assay and stress fiber formation (Fig. 7, e and f). ELISA showed that phosphorylated Smad2/3 were induced by TGF-β1 treatment and reached a peak at 30 min. miR-101 inhibited TGF-β1-induced Smad2/3 phosphorylation (Fig. 8a). Real-time PCR showed that the mRNA expression of SMAD2 and SMAD3 was not significantly altered in the lung tissues of IPF patients (Fig. 8b). These results suggest that miR-101 inhibits TGF-β-mediated fibroblast differentiation to myofibroblasts via SMAD2/3 signaling.
Figure 7.

miR-101 controls α-SMA and collagen expression in lung fibroblasts. a and b, effect of miR-101 overexpression on TGF-β1-induced α-SMA and collagen protein and mRNA expression. LL29 cells were treated with lentiviral miR-101 or the virus control (vc) at an m.o.i. of 50 for 48 h. Then, the cells were stimulated with 5 ng/ml TGF-β1 for 48 h. Western blotting and real-time PCR were performed to determine the protein and mRNA expression levels. The expression levels were relative to GAPDH. n = 3 cell preparations. c and d, effect of miR-101 knockdown on the protein and mRNA expression of α-SMA, COL1A1, and COL3A1. CCD-8Lu fibroblasts were treated with lentiviral anti-miR-101 or the virus control at an m.o.i. of 50 for 72 h, and protein and mRNA expression was determined by Western blotting and real-time PCR. The expression levels were relative to GAPDH from two cell preparations, each performed in duplicate. e, miR-101 suppresses TGFβ-1-induced collagen gel contraction in LL29 cells. f, LL29 cells were treated with lentiviral miR-101 or the virus control at an m.o.i. of 50 for 48 h. Then, the cells were stimulated with 5 ng/ml TGF-β1 for 48 h. The cells were fixed for immunocytochemical analysis with the anti-α-SMA antibody and Alexa Fluor 546-conjugated second antibody. Nuclei were stained with DAPI. Scale bar, 50 μm. The results are presented as the mean ± S.E. ANOVA followed by Tukey's HSD test was performed for multiple comparisons. *, p < 0.05; **, p < 0.01.
Figure 8.

miR-101 inhibits fibroblast activation through TGF-β-Smad2/3 signaling. a, ELISA analysis showing increased Smad2/3 phosphorylation by TGF-β1 treatment in LL29 cells. miR-101 suppressed the TGFβ1-induced Smad2/3 phosphorylation. The results are presented as the mean ± S.E. n = 4–6. *, p < 0.05. b, SMAD2/3 expression in IPF patients. Real-time PCR were performed using total RNA isolated from the lung tissues of IPF patients. n = 10 for the <50% FVC group, n = 10 for the 50–80% FVC group, and n = 8 for the >80% predicted. The expression level was relative to GAPDH.
FZD4, FZD6, and TGFBR1 are the targets of miR-101
TargetScan predicts FZD4, FZD6, and TGFBR1 as potential targets of miR-101. There are two miR-101-binding sites in the 3′-UTRs of human FZD4 and TGFBR1 and one in FZD6. The binding sites of miR-101 in the 3′-UTRs of FZD4, FZD6, and TGFBR1 are conserved in humans, mice, cows, and dogs (http://www.targetscan.org).3 We cloned each of the binding sites with flanking sequences downstream of the firefly luciferase gene under the control of the PGK promoter in the pmirGLO reporter. Transfection of miR-101 into HEK 293T cells inhibited the reporter activities of both FzD4-S1-UTR and FzD4-S2-UTR (Fig. 9a), indicating that miR-101 bound to both sites. However, miR-101 inhibited the TGFBR1-S2-UTR but not the TGFBR1-S1-UTR reporter activities, suggesting that miR-101 only bound to site 2, but not site 1, in the 3′-UTR of TGFBR1. miR-101 also inhibited the reporter activity of FZD6 3′-UTR (nucleotides 1–1,356). Infection of HLF1 fibroblasts with a lentivirus expressing miR-101 reduced the endogenous protein and mRNA levels of FZD4, FZD6, and TGFBR1 (Fig. 9, b and d), whereas anti-miR-101 increased the protein and mRNA expression of all three targets (Fig. 9, c and e). The mRNA levels of FZD4, FZD6, and TGFBR1 were up-regulated in the lungs of IPF patients (Fig. 9, f–h) and were inversely correlated with miR-101 expression (Fig. 1b). Knockdown of TGFBR1 inhibited the TGF-β1-induced mRNA expression of α-SMA, COL1A1, COL3A1, and COL4A1 (Fig. 10, a–d). Furthermore, overexpression of FZD4 or FZD6 rescued the inhibition of miR-101 on fibroblast proliferation (Fig. 10, e and f). The overexpression of TGFBR1 also rescued the inhibition of miR-101 on the mRNA expression of α-SMA, COL1A1, and COL3A1 in LL29 fibroblasts (Fig. 10, g–j). These results suggest that FZD4, FZD6, and TGFBR1 are miR-101 targets.
Figure 9.

Identification of FZD4, FZD6, and TGFBR1 as miR-101 targets. a, 3′-UTR reporter assay: FZD4-UTR-S1 (position 1–1,432) containing miR-101-binding site 1 (position 537–543), FZD4-UTR-S2 (position 4,178–5,463) containing miR-101-binding site 2 (position 1,240–1,246), full length of FZD6-UTR, TGFBR1-UTR-S1 (position 66–1,524) containing miR-101-binding site 1 (position 460–466), or TGFBR1-UTR-S2 (position 3,210–4,749) containing miR-101-binding site 2 (position 3,993–3,999) were co-transfected into HEK 293T cells with miR-101-1. The relative luciferase activities were measured using the Dual-Luciferase® reporter assay system. n = 3. b and c, effect of overexpressing or knockdown miR-101 on the protein expression of FZD4, FZD6, and TGFBR1 in fibroblasts. LL29 cells were treated with a lentivirus expressing miR-101-1 or the virus control (VC) at an m.o.i. of 50 for 48 h (b) or CCD-8Lu fibroblasts were treated with a lentivirus expressing anti-miR-101 or the virus control (Anti-CON) at an m.o.i. of 50 for 72 h. c, Western blotting was performed to determine the protein expression of FZD4, FZD6, and TGFBR1. The protein samples used here were the same as mentioned in Fig. 7c. The GAPDH immunoblot shown in Fig. 7c was used again here. d, overexpression of miR-101 inhibits FZD4, FZD6, and TGFBR1 mRNA expression in fibroblasts. LL29 cells were treated with lentiviral miR-101 or the virus control at an m.o.i. of 50 for 48 h. The mRNA expression of FZD4, FZD6, and TGFBR1 was determined by real-time PCR and normalized to GAPDH. The results are presented as the mean ± S.E. n = 3. e, real-time PCR showing the increased mRNA levels of FZD4, FZD6, and TGFBRR1 by anti-miR-101. CCD-8Lu fibroblasts were treated with lentiviral anti-miR-101 or the virus control at an m.o.i. of 50 for 72 h. The expression levels were relative to GAPDH from two cell preparations, each performed in duplicate. f–h, mRNA expression of FZD4, FZD6, and TGFBR1 in IPF patient lungs. The mRNA levels of FZD4, FZD6, and TGFBR1 were determined by real-time PCR and normalized to β-actin. n = 8–10. The results are presented as the mean ± S.E. Statistical analyses were performed by using Student's t test. *, p < 0.05; **, p < 0.01; ***, p < 0.001.
Figure 10.

Overexpression of FZD4, FZD6, or TGFBR1 rescues miR-101-mediated inhibition of fibroblast proliferation and activation. a–d, knockdown of TGFBR1 repressed the TGF-β1-induced mRNA expression of α-SMA, COL1A1, COL3A1, and COL4A1 in fibroblasts. LL29 cells were treated with lentivirus shRNA-TGFBR1 or the virus control at an m.o.i. of 50 for 48 h. Then, the cells were stimulated with 5 ng/ml TGF-β1 for 48 h. The α-SMA, COL1A1, COL3A1, and COL4A1 mRNA expression levels were determined by real-time PCR. The expression levels were relative to GAPDH from two cell preparations, each performed in duplicate. The results are presented as the mean ± S.D. **, p < 0.01. e and f, overexpression of FZD4 or FZD6 rescues the miR-101-mediated inhibition of fibroblast proliferation. LL29 cells were split into 96-well plates at 3,000 cells per well. After a 24-h culture, cells were infected with lentiviruses at a total of m.o.i. = 50 (miR-Con miR-101, GFP, FZD4, and FZD6 at m.o.i. = 25 each, virus control (VC) = miR-Con + GFP) for 48 h. Cells were starved for another 24 h and stimulated with WNT5a (1 μg/ml) for 12 h. FZD4 and FZD6 expression was determined by Western blotting by using anti-GFP antibody. Cell proliferation was determined by BrdU assay. Data were presented as mean ± S.E. Statistical analysis was performed by ANOVA and followed by Tukey's HSD test. n = 4. **, p < 0.01. g–j, overexpression of TGFBR1 rescues miR-101-mediated inhibition of α-SMA, COL1A1, and COL3A1 mRNA expression. LL29 cells were infected with lentiviruses at a total of m.o.i. = 50 (miR-Con, miR-101, GFP, and TGFBR1 at m.o.i. = 25 each, virus control = miR-Con + GFP) for 48 h. Cells were then stimulated with TGFβ1 (5 ng/ml) for 48 h. Cells were collected for real-time PCR. The results are presented as the mean ± S.E., n = 3. ANOVA followed by Tukey's HSD test was performed. *, p < 0.05; **, p < 0.01; ***, p < 0.001.
miR-101 attenuates bleomycin-induced pulmonary fibrosis in mice
We have found that miR-101 inhibits WNT5a-induced fibroblast proliferation and TGF-β1-induced fibroblast activation. Therefore, we hypothesized that inhibition of fibroblast proliferation and activation by miR-101 gain of function would reduce excessive extracellular matrix deposition and prevent the development of pulmonary fibrosis in response to bleomycin. To test this hypothesis, we examined the effect of overexpression of miR-101 in mouse lungs using adenovirus-mediated gene transfer on bleomycin-induced pulmonary fibrosis. The gene transfer resulted in an ∼2-fold increase in miR-101 expression in the lung (Fig. 11a). H&E analysis revealed reduced fibrosis in the miR-101-treated group (Fig. 11b), which was confirmed by quantitation of lung fibrosis using an Ashcroft score (Fig. 11c). miR-101 also inhibited lung collagen content as measured by hydroxyproline assay (Fig. 11d). Furthermore, miR-101 reduced bleomycin-induced COL1A1 and COL3A1 expression (Fig. 11, e and f). Importantly, lung function was improved in the miR-101-treated group, as evidenced by the decrease in elastance (Ers) and tissue elastance (H) (Fig. 11, g and h). The mRNA levels of NFATc2, FZD6, and TGFBR1 were increased in the lungs of mice with bleomycin-induced fibrosis, and miR-101 suppressed the increases (Fig. 11, i and j). The similar changes were observed for the FZD4 mRNA level but did not reach a significant level.
Figure 11.

Adenovirus-mediated miR-101 gene transfer attenuates bleomycin-induced pulmonary fibrosis. On day 1, an adenovirus expressing miR-101-1 or the control adenovirus (VC) (5 × 10⁹ pfu per mouse) was delivered into the lungs of 6–8-week-old C57BL/6 mice by nasal instillation. On day 2, bleomycin (Bleo) (0.06 units per mouse) or the same volume of saline (Sal) was intranasally instilled into the lungs. On day 15, the mice were subjected to the analysis of respiratory mechanics by Flexivent and then sacrificed. The left lungs were collected for RNA and protein analysis, and the right lungs were fixed for histological analysis. a, real-time PCR analysis showing adenovirus-mediated overexpression of miR-101 in the mouse lung. The expression levels were relative to U6. b, H&E staining showing the fibrotic changes in the mouse lung induced by bleomycin. miR-101 attenuated the fibrotic changes in bleomycin-treated mouse lungs. Scale bar, 100 μm. c, Ashcroft score grade of pulmonary fibrosis. d, lung collagen content as determined using the QuickZyme hydroxyproline assay kit. e and f, real-time PCR analysis showing the increased COL1A1 and COL3A1 mRNA levels in bleomycin-treated mouse lungs and miR-101 suppression of the increase of COL1A1 and COL3A1 mRNA levels. The expression levels were relative to GAPDH. g and h, analysis of lung mechanics by Flexivent analysis. Elastance (Ers) was measured in a single-compartment model. h was measured in the Constant-Phase model. i and j, NFATc2, FZD4, FZD6, and TGFBR1 mRNA expression was increased in bleomycin-treated mouse lungs, and the increase was suppressed by miR-101 treatment as determined by real-time PCR analysis. The expression level was relative to GAPDH. n = 5 for saline + VC and saline + miR-101; n = 7–10 for bleomycin + VC and bleomycin + miR-101. The results are presented as the mean ± S.E. Statistical analyses were performed by using Student's t test. *, p < 0.05; **, p < 0.01; ***, p < 0.001.
Discussion
In this study, we discovered that the miR-101 level was reduced in the lungs of patients with IPF. miR-101 expression was regulated by the ETS transcription factor. Notably, miR-101 reduced pulmonary fibrosis by inhibiting fibroblast proliferation and differentiation via the WNT5a/NFATc2 and TGF-β/Smad2/3 pathways (Fig. 12).
Figure 12.
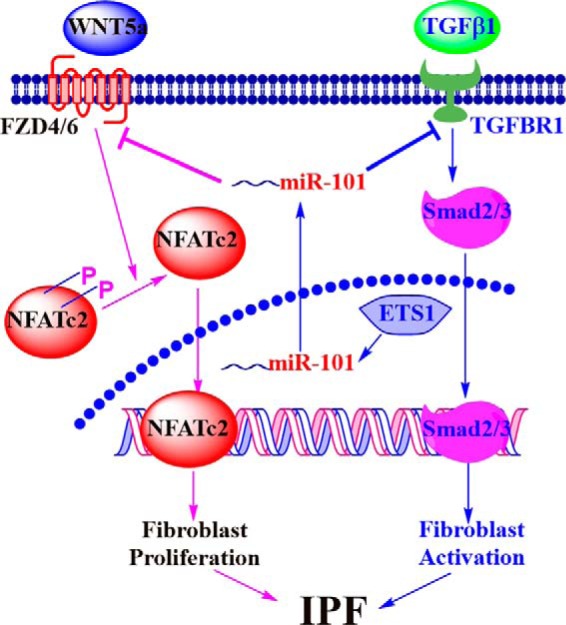
Schematic representation of a mechanistic model.
miR-101 was originally identified as a tumor suppressor, and its expression was reduced in many cancers due to genomic loss. miR-101 inhibited cell proliferation and invasion in cancer cells by targeting EZH2 (25) and inhibited autophagy and sensitized cancer cells to chemotherapeutic drug-induced cell death (26, 27). The effect of miR-101 on angiogenesis is contradictory, and both pro- and anti-angiogenic effects have been reported (28, 29). miR-101 enhanced LPS-induced pro-inflammatory cytokine production in macrophages via the activation of MAPK by targeting MAPK phosphatase-1 (30). Finally, miR-101 has been shown to inhibit liver and cardiac fibrosis (31, 32).
We identified the transcription start site of miR-101-1 using the RACE assay. Further analysis revealed that the primary miR-101-1 transcript was composed of three exons, and the mature miR-101 was located in exon 3. However, a recent report showed that the human primary miR-101-1 transcript consisted of two exons in hepatocyte-derived cells (33). The transcription start site in hepatocytes was located five nucleotides upstream of the transcription start site that we identified in lung cells. Alternative splicing and the transcription start site of the miR-101 gene in different cells may account for these differences. The presence of multiple ETS-binding sites in the miR-101-1 and miR-101-2 promoters and the decrease in ETS1/2 expression in bleomycin-treated lungs suggest that the ETS transcription factors may regulate miR-101 expression. ETS2 has been shown to be involved in the pathogenesis of pulmonary fibrosis (34).
Non-canonical Wnt signaling has been relatively less studied in IPF. We found that WNT5a and -5b served as the WNT ligands in pulmonary fibroblasts and that WNT5a induced fibroblast proliferation, which was consistent with a previous report (20). WNT5a induced fibroblast proliferation via the NFATc2 transcription factor, which was supported by the following observations: (i) WNT5a induced the nuclear translocation of NFATc2; (ii) inhibition of calcineurin decreased WNT5a-stimulated fibroblast proliferation; and (iii) reduction of FzD4/6 and NFATc2 protein levels by RNAi inhibited WNT5a-induced fibroblast proliferation.
Importantly, we discovered that miR-101 suppressed WNT5a-induced pulmonary fibroblast proliferation. The following evidence supports that the miR-101 inhibition of fibroblast proliferation is the result of the repression of WNT5a/NFATc2 signaling: (i) FZD4/6 are the direct targets of miR-101; (ii) miR-101 inhibits NFATc2 nuclear translocation; (iii) miR-101 reduced WNT5a-induced NFATc2 mRNA levels; and (iv) miR-101 levels were inversely correlated with FZD4 and FZD6 expression in the lungs of IPF patients. Our studies revealed that the molecular mechanism underlying the control of fibroblast expansion by miR-101 was the regulation of WNT5a-FZD4/6-NFATc2 signaling.
TGF-β stimulates collagen synthesis and extracellular matrix deposition (1, 2). TGF-β transduces its signals by binding to the transmembrane receptor TGFBR1, and it regulates the expression of numerous genes through their downstream effectors (the SMAD proteins). miR-101 inhibited TGF-β-induced fibroblast activation, as evidenced by the inhibition of collagen synthesis, reduced α-SMA mRNA and protein expression, decreased stress fiber formation, and enhanced contractile ability. The effect of miR-101 on fibroblast activation was due to its inhibition of TGF-β/SMAD2/3 signaling, which was supported by the following observations. (i) TGFBR1 was identified as the target of miR-101 by the 3′-UTR reporter assay, and the endogenous TGFBR1 protein levels changed due to the manipulation of the miR-101 levels. This is consistent with a recent report in hepatic stellate cells (31). (ii) Silencing of TGFFBR1 had similar effects to miR-101 on fibroblast activation. (iii) miR-101 inhibited the phosphorylation of SMAD2/3 induced by TGF-β1.
Emerging evidence suggests that suppressing up-regulated miRNAs or restoring the activities of the down-regulated miRNAs associated with disease could become a novel therapeutic strategy. Adeno-associated viruses have been used for the delivery of miRNAs in vivo to restore their activity; its therapeutic potential has been validated in a mouse model of lung carcinoma (35). Therapeutic delivery of miR-29 mimics by intravenous injections in the tail vein reversed pulmonary fibrosis in the bleomycin-induced mouse fibrosis model (14). In this study, adenovirus-mediated miR-101 lung delivery reduced the fibrotic changes in bleomycin-treated mouse lungs and also improved pulmonary function. Thus, miR-101 may be a potential therapeutic miRNA for the treatment of pulmonary fibrosis.
Experimental procedures
IPF lung tissues and RNA isolation
Twenty eight IPF patient lung tissue samples were obtained from the Lung Tissue Research Consortium. All of the samples were submerged in RNAlater solution and stored at −80 °C prior to use. Total RNA was isolated from these lung tissues using TRI Reagents (Molecular Research Center, Cincinnati, OH). The RNA concentration and quality were determined with the NanoDrop ND-1000 spectrophotometer (NanoDrop Tech., Rockland, DE) with an A260/A280 ratio of >1.8 and an A260/A230 ratio of >1.7.
miRNA microarray analysis
miRNA microarray slides were printed in-house using the miRCURY LNATM ready-to-spot probe set 11.0 (Exiqon, Woburn, MA) composed of 1,282 human mature miRNAs. Total RNA was isolated from IPF lung tissues using TRI Reagents (Molecular Research Center, Cincinnati, OH). A common reference containing total RNAs pooled from 20 normal human tissues was purchased from Ambion (Grand Island, NY) (catalogue no. AM6000). Microarray hybridization and data analyses were performed as described previously (36). In brief, 400 ng of total RNAs from IPF lung tissues or the common reference were labeled with Hy3 or Hy5 using the miRCURY LNATM microRNA power labeling kit (Exiqon, Woburn, MA). A dye swap was performed to eliminate dye bias. Each IPF sample was hybridized to an miRNA microarray slide with the common reference for 16–18 h at 56 °C. The hybridized slides were scanned with ScanArray Express (PerkinElmer Life Sciences). The images were analyzed using GenePix 5.0 pro (Axon Instruments, Inc., Union City, CA) for data extraction. The images and raw data were imported into the RealSpot software that was developed in our laboratory for quality control and Lowess normalization (37). miRNAs with an average quality index of less than 1 were filtered. A two-tailed Student's t test assuming unequal variance was performed to identify differentially expressed miRNAs in the lung tissues of IPF patients. p < 0.05 was considered to be significant.
Real-time PCR
The miRNA expression levels were determined by SYBR Green I-based real-time PCR as described previously (38). One microgram of DNase-treated total RNA was poly(A)-tailed and purified by phenol/chloroform extraction. The poly(A)-tailed RNAs were reverse-transcribed into cDNA with an miRNA-specific primer (Table 3). The real-time PCR thermal conditions were 95 °C for 10 min, followed by 40 cycles of 95 °C for 15 s and 60 °C for 60 s. Data were analyzed by the comparative ΔCt method using U6 small nucleolar RNA as an endogenous reference gene. The mRNA expression levels were also determined using real-time PCR. Glyceraldehyde-3-phosphate dehydrogenase (GAPDH) was used as the internal control. The sequences of the primers used for real-time PCR are shown in Table 4.
Table 3.
Real-time PCR primers for miRNAs
FW is forward, and RE is reverse.
| Primer name | Primer sequence |
|---|---|
| hsa-miR-101-RT | GCGAGCACAGAATTAATACGACTCACTATAGGTTTTTTTTTTTTTTCAGT |
| hsa-miR-124-RT | GCGAGCACAGAATTAATACGACTCACTATAGGTTTTTTTTTTTTGGCATT |
| hsa-miR-1249-RT | GCGAGCACAGAATTAATACGACTCACTATAGGTTTTTTTTTTTTTGAAGA |
| hsa-miR-1274b-RT | GCGAGCACAGAATTAATACGACTCACTATAGGTTTTTTTTTTTTTGGCGC |
| hsa-miR-141-RT | GCGAGCACAGAATTAATACGACTCACTATAGGTTTTTTTTTTTTCCATCT |
| hsa-miR-142–5p-RT | GCGAGCACAGAATTAATACGACTCACTATAGGTTTTTTTTTTTTAGTAGT |
| hsa-miR-195-RT | GCGAGCACAGAATTAATACGACTCACTATAGGTTTTTTTTTTTTGCCAAT |
| hsa-miR-27b-RT | GCGAGCACAGAATTAATACGACTCACTATAGGTTTTTTTTTTTTGCAGAA |
| hsa-miR-493*-RT | GCGAGCACAGAATTAATACGACTCACTATAGGTTTTTTTTTTTTAATGAA |
| hsa-miR-519d-RT | GCGAGCACAGAATTAATACGACTCACTATAGGTTTTTTTTTTTTCACTCT |
| hsa-miR-597-RT | GCGAGCACAGAATTAATACGACTCACTATAGGTTTTTTTTTTTTACAGTG |
| hsa-miR-877-RT | GCGAGCACAGAATTAATACGACTCACTATAGGTTTTTTTTTTTTCCCTGC |
| hsa-miR-887-RT | GCGAGCACAGAATTAATACGACTCACTATAGGTTTTTTTTTTTTCCTCGG |
| hsa-miR-888*-RT | GCGAGCACAGAATTAATACGACTCACTATAGGTTTTTTTTTTTTTTCACC |
| hsa-miR-101-FW | GCGCGGTACAGTACTGTGATAAC |
| hsa-miR-124-FW | TGAATTAAGGCACGCGGTG |
| hsa-miR-1249-FW | TATAAACGCCCTTCCCCCC |
| hsa-miR-1274b-FW | TAAATTCCCTGTTCGGGCG |
| hsa-miR-141-FW | CGCCTAACACTGTCTGGTAAAG |
| hsa-miR-142–5p-FW | CGACCCATAAAGTAGAAAGCAC |
| hsa-miR-195-FW | GCGTCTAGCAGCACAGAAATAT |
| hsa-miR-27b-FW | CGTTGTTCACAGTGGCTAAGTT |
| hsa-miR-493*-FW | AGGCTTTGTACATGGTAGGCTT |
| hsa-miR-519d-FW | TGAACAAAGTGCCTCCCTTTA |
| hsa-miR-597-FW | TCTGTGTGTCACTCGATGACC |
| hsa-miR-877-FW | CTGGTAGAGGAGATGGCGC |
| hsa-miR-887-FW | ATTAGTGAACGGGCGCCAT |
| hsa-miR-888*-FW | TGCTGACTGACACCTCTTTGG |
| pri-mmu-miR-101a-FW | TGCCCTGGCTCAGTTATCAC |
| pri-mmu-miR-101a-RE | CCTGCTGTGATGAGACTTCTC |
| pri-mmu-miR-101b-FW | CGATGCTGTAGCTCTGAAAGG |
| pri-mmu-miR-101b-RE | TCCCACTGCCAACTCTAAAAAG |
| U6-FW (human and mouse) | GCAAGGATGACACGCAAATTC |
| General-RE | GCGAGCACAGAATTAATACGAC |
| Poly(T) adapter | GCGAGCACAGAATTAATACGACTCACTATAGGTTTTTTTTTTTTVN (N = A + C + G + T, V = G + A + C) |
Table 4.
Real-time PCR primers for mRNAs
h is human; m is mouse. FW is forward, and RE is reverse.
| Primer name | Primer sequence | Primer name | Primer sequence |
|---|---|---|---|
| hCOL1A1-FW | CGAAGACATCCCACCAATCAC | hWNT7b-FW | GCGTTACGGCATCGACTTCT |
| hCOL1A1-RE | CAGATCACGTCATCGCACAAC | hWNT7b-RE | GCTGCATCCGGTCCTCTAGA |
| hCOL3A1-FW | TGGCTACTTCTCGCTCTGCTT | hWNT9a-FW | GCAGCAAGTTCGTCAAGGAAT |
| hCOL3A1-RE | TTCCAGACATCTCTATCCGCATAG | hWNT9a-RE | GTCTCCACCCCAGCCTTGAT |
| hCOL4A1-FW | CTCTGGCTGTGGCAAATGTG | hWNT1-FW | CAAGTGGCAGTTCCGGAATC |
| hCOL4A1-RE | CCTCAGGTCCTTGCATTCCA | hWNT1-RE | GCGGAGGTGATAGCGAAGATA |
| hASMA-FW | GTGTTGCCCCTGAAGAGCAT | hNFATC2-FW | CGGGCCCACTATGAGACAGA |
| hASMA-RE | CGCCTGGATAGCCACATACAT | hNFATC2-RE | CCAGAGGCTTGTTTTCCATGTAG |
| hGAPDH-FW | GAAGGTGAAGGTCGGAGTCAAC | hTGFBR1-FW | GGTTCCGTGAGGCAGAGATTTA |
| hGAPDH-RE | CATGGGTGGAATCATATTGGAA | hTGFBR1-RE | CTGACACCAACCAGAGCTGAGT |
| hFZD4-FW | TTTCACACCGCTCATCCAGTAC | hETS1-FW | GGACCGTGCTGACCTCAATAA |
| hFZD4-RE | GGGTTCACAGCTCTCTTGACT | hETS1-RE | TTCCAGAAGAAACTGCCATAGCT |
| hFZD6-FW | CGGATGTTACGTCTATGAGCAAGT | hETS2-FW | CAGCGGCAGGATGAATGATT |
| hFZD6-RE | CTGGTCGAGCTTTTGCTTTTG | hETS2-RE | GACCCATCAAAGGTGTCAAAGG |
| hEZH2-FW | TCCTACATCCTTTTCATGCAACAC | mCOL1A1-FW | ACGCATGGCCAAGAAGACAT |
| hEZH2-RE | CCCTCCAAATGCTGGTAACAC | mCOL1A1-RE | TTGTGGCAGATACAGATCAAGCA |
| hWNT11-FW | AAGGACTCGGAACTCGTCTATCTG | mCOL3A1-FW | CACCCTTCTTCATCCCACTCTT |
| hWNT11-RE | CCGTTGGATGTCTTGTTGCA | mCOL3A1-RE | TGACATGGTTCTGGCTTCCA |
| hWNT2-FW | TGGCTCCCTCTGCTCTTGAC | mGAPDH-F | CTCGTCCCGTAGACAAAATGGT |
| hWNT2-RE | TGGCACATTATCGCACATCAC | mGAPDH-R | TGATGGCAACAATCTCCACTTT |
| hWNT3a-FW | ATGGCCCCACTCGGATACTT | mNFATC2-FW | GAACTTCACAGCGGAGTCCAA |
| hWNT3a-RE | GAGGAATACTGTGGCCCAACA | mNFATC2-RE | GCATGTTAGGCTGGCTCTTGT |
| hWNT4-FW | CTCGTCTTCGCCGTCTTCTC | mETS1-FW | CGACTCTCACCATCATCAAGACA |
| hWNT4-RE | GGATCAGGCCCTTGAGTTTCT | mETS1-RE | TCTTTGCTGCTCGGAGTTAACA |
| hWNT5a-FW | GAGTGCTCGCATCCTCATGA | mETS2-FW | CGCGATGAATGACTTTGGAAT |
| hWNT5a-RE | CTGCAGCCAGCATGTCTTCA | mETS2-RE | GCCATCGAAGGTGTCAAAGG |
| hWNT5b-FW | AGGAATGCCAGCACCAGTTC | mFZD4-FW | CCAGCCAGCTGCAGTTCTTC |
| hWNT5b-RE | GGTCTCTCGGCTGCCTATCTG | mFZD4-RE | TCACAGCGTCTCTTGACTGAAAG |
| hSMAD2-FW | AAGCCATCACCACTCAAAACTGT | mFZD6-FW | CCCTAACCTGATGGGTCATTATG |
| hSMAD2-RE | GGCCTGTTGTATCCCACTGATC | mFZD6-RE | AGCTTGGCAAAGGAACATTTCA |
| hSMAD3-FW | CCACCAGATGAACCACAGCAT | mTGFBR1-FW | GCAATCAGGACCACTGCAATAA |
| hSMAD3-RE | CCGGCTCGCAGTAGGTAACT | mTGFBR1-RE | GCAGACTGGACCAGCAATGAC |
RACE analysis
5′-RACE analysis was performed using the RExactSTART eukaryotic mRNA 5′- and 3′-RACE kit (EPICENTRE, Madison, WI) (catalogue no. ES80910) according to the manufacturer's instructions. PCR amplification of the 5′-end of human primary miR-101-1 was performed using the Racer 5′-primer and a gene-specific reverse primer (Table 5). The amplified RACE product was subjected to sequence analysis.
Construction of plasmids
3′-Untranslational region (3′-UTR) reporter vectors
The 3′-UTR of FZD4, FZD6, and TGFBR1 were amplified by PCR using specific primers (Table 6) from human genomic DNA (Promega, Madison, WI). The 3′-UTR fragments were inserted downstream of the firefly luciferase gene using the pmirGLO Dual-Luciferase miRNA target expression vector (Promega, Madison, WI) at the NheI and SalI sites. pmirGLO also contains the Renilla luciferase gene for normalization.
Table 6.
Primers for the construction of plasmids
FW is forward, and RE is reverse.
| 3′-UTR reporter vectors (human) | |
| pmiRGLO-FZD4-UTR-S1-FW | TATTGCTAGCAGTGAGACTGTGGTATAAGGCT |
| pmiRGLO-FZD4-UTR-S1-RE | TTATGTCGACCTGGGCTATTAGAGTTTGCAGT |
| pmiRGLO-FZD4-UTR-S2-FW | ATAAGCTAGCAAAGTGCTGGGATTACAAGTGTG |
| pmiRGLO-FZD4-UTR-S2-RE | AATAGTCGACATGCCAAGTCACACACAACCTAAC |
| pmiRGLO-FZD6-UTR-FW | TATTGCTAGCAGGTGGTTGTCATTCAGATACTTG |
| pmiRGLO-FZD6-UTR-RE | TAATGTCGACGCCAGAACTACTATACCTAACCAC |
| pmiRGLO-TGFBR1-S1-UTR-FW | TATGCTAGCTCAATTGTTCTACCTCACTGAGAG |
| pmiRGLO-TGFBR1-S1-UTR-RE | TTTGTCGACTAAGAAGACCATGACAAGTTTGC |
| pmiRGLO-TGFBR1-S2-UTR-FW | TTTCTCGAGATTTTGTAGTACATGCATGAGT |
| pmiRGLO-TGFBR1-S2-UTR-RE | AACTCTAGAGCAATCCTATTCACAAAGCC |
| shRNAs (human) | |
| FZD4, NM_012193 | GCATGTGTCTTTCAGTCAAGA |
| FZD6, NM_003506 | GCTGAAGGTCATTTCCAAATC |
| WNT5a, NM_003392 | GGTCGCTAGGTATGAATAACC |
| TGFBR1, NM_001130916 | GCTTGTTCAGAGAACAATTGC |
| NFATc2, NM_012340 | GGGATCTTGAAGCTTAGAAAC |
| ETS1-shRNA1, NM_001143820.1 | GCAGATGTCCCACTATTAACT |
| ETS1-shRNA2, NM_001143820.1 | GCAGAAAGAGGATGTGAAACC |
| ETS2-shRNA1, NM_012340 | GCCTCAATAAGCCAACCATGT |
| ETS2-shRNA2, NM_012340 | GGGAACATCTGGAGCAAATGA |
| miR-101 | AGTTATCACAGTGCTGATGC |
| miR-101 overexpression vectors (human) | |
| miR-101-1-FW | AGTCTCGAGATAAGTCATGTGTTCATCTTTCAT |
| miR-101-1-RE | ACAGAATTCTATATGTTCACTCAGCACAACATG |
| miR-control-FW | ATACTCGAGCAAATGAGAGAGTATGGTGTGGT |
| miR-control-RE | ATAGAATTCCCAAACTTGCCCATAACCATAGG |
| Promoter reporter vectors (human) | |
| prom-miR-101-1-FW | AATACGCGTTTAAAATCAGTTTGGGTCCTG |
| prom-miR-101-1-RE | ATACTCGAGAATAGACAGCATCAGCACTGT |
| prom-miR-101-2-FW | TATACGCGTCCATCATTCTGTTCTTCCTTCCT |
| prom-miR-101-2-RE | TATCTCGAGCCGAAAAAGGACAGTTCAGTCTC |
| prom-miR-101-1-Mute1-FW | TGTTTTTCTCCCTTCCCGGTCATGAGACCCACTGGTTT |
| prom-miR-101-1-Mute1-RE | AAAAACCAGTGGGTCTCATGACCGG |
| prom-miR-101-1-Mute5-FW | CACCAGAAACATGCAAGGAATTTAGAAGGATGGAATTATG |
| prom-miR-101-1-Mute5-RE | GGATCTTTTCCATAATTCCATCCTTCTAAATTCCTTGCAT |
| prom-miR-101-2-Mute2-FW | CTGCCACTGTCAGCTTTGCAATATAGCACGAGCCTTTATC |
| prom-miR-101-2-Mute2-RE | TACTCATGGATAAAGGCTCGTGCTATATTGCAAAGCTGAC |
| FZD4, FZD6, and TGFBR1 overexpression vectors (mouse) | |
| FZD6-FW | TATCTCGAGATGGAAAGGTCCCCGTTTCTGTTG |
| FZD6-RE | TATGAATTCAAGCGTCGGAATGGCTGCCAG |
| FZD4-FW | TTTCTCGAGATGGCCTGGCCGGGCACAG |
| FZD4-RE | TTTGCTAGCTTATACCACAGTCTCGTTGCCT |
| TGFBR1-FW | TTATGCGGCCGCGTCACCATGGAGGCGGCAGCTGCAGCT |
| TGFBR1-RE | TTTGAATTCCATTTTGATGCCTTCCTGTTGGCT |
miRNA expression vectors
Mature miR-101-1 plus ∼200-bp flanking sequences at each end were amplified by PCR using specific primers (Table 6) from human genomic DNA. The fragments were inserted into adenoviral and lentiviral vectors at the XhoI and EcoRI sites as described previously (39, 40). The control vector was constructed with a similar size of genomic DNA that did not contain any miRNAs or stem-loop structures.
shRNA vectors
All of the shRNAs were designed by the BLOCK-iTTM RNAi designer software from Invitrogen. shRNAs were inserted into the pSIH-H1 vector (System Biosciences, Mountain View, CA), which utilizes the H1 promoter to drive shRNA expression. The shRNA sequences are listed in Table 6. A control vector containing scrambled shRNA was purchased from System Biosciences.
FZD4, FZD6, and TGFBR1 expression vectors
The open reading frame of FZD4, FZD6, and TGFBR1 was amplified by PCR using specific primers (Table 6) from mouse cDNA clones purchased from OriGene (FZD4, catalogue no. MC203860; FZD6, catalogue no. MC204555; TGFBR1, catalogue no. MR20891). The fragments were inserted into the lentiviral vector as used for miR-101 expression above at the XhoI and NheI sites for FZD4, XhoI and EcoRI sites for FZD6, and NotI and EcoRI sites for TGFBR1. The 3′ terminus of open reading frame of FZD4, FZD6, and TGFBR1 was fused with the 5 terminus of GFP, resulting in FZD4-GFP, FZD6-GFP, or TGFBR1-GFP fusion protein. A lentiviral vector containing GFP was used as a control.
Anti-miR-101 vector
The shRNA against miR-101 was constructed as described above. The sequence for anti-miR-101 was AGTTATCACAGTGCTGATGC, which is partially complementary to mature miR-101.
miR-101 promoter vectors
The 5′-flanking region of miR-101-1 (−2388 to +80) and RCL1/miR-101-2 (−2187 to +107) was amplified by PCR using specific primers (Table 6) from human genomic DNA. The fragments were inserted into the luciferase reporter vector pGL3-Basic (Promega, Madison, WI). Overlapping PCR was used to construct the mutant miR-101 promoters on the ETS-binding sites. The conserved ETS-binding site 1 (CCGGAAG) and site 5 (TTTCCTA) in human miR-101-1 promoter and ETS-binding site 2 (ATTCCTC) in human miR-101-2 promoter were mutated. Two fragments of a promoter with overlapping mutation sites were first PCR-amplified using two primer sets. The annealing two fragments were then used as a template to amplify the mutant promoter. The primer sequences are listed in Table 6. All of the inserts in the plasmid constructs described above were confirmed by DNA sequencing.
Production of lentiviruses and adenovirus
Lentiviruses were produced using the Lenti-XTM HTX packaging vectors (Clontech) in HEK 293T cells. For the production of the adenovirus, a pENTR vector was switched into the adenoviral vector pAd/PL-DEST using the gateway technique (Invitrogen). The obtained adenoviral vector was linearized by PacI and transfected into HEK 293A cells to produce virus. Adenovirus was further amplified by re-infecting HEK 293A cells. The adenoviruses were concentrated and purified with the Adenovirus Standard Purification ViralKitTM (VIRAPUR, San Diego). The virus titer was determined by infecting HEK 293T or HEK 293A cells with a series of dilutions of the viral stock and counting the virus-infected green fluorescent protein (GFP)-positive cells.
Cell culture
HEK 293T cells and lung fibroblasts (IMR-90, HFL1, CCD-8Lu, and LL29) were purchased from the American Type Culture Collection (ATCC) (Manassas, VA). HEK 293A cells were purchased from Invitrogen. IMR-90 and HFL1 cells were human diploid fibroblasts derived from fetal lungs. CCD-8Lu and LL29 cells were human fibroblasts isolated from the lungs of a normal adult and an IPF patient, respectively. The cells were grown and maintained with the following media supplemented with 10% fetal bovine serum (FBS): HFL1 and LL29 cells, F12K medium (Kaighn's modification of Ham's F-12 medium); and IMR-90 and CCD-8Lu, Eagle's minimum essential medium.
Isolation of mouse lung fibroblasts
Primary lung fibroblasts were isolated from the lungs of saline or bleomycin-treated mice according to the previously described protocol (41). The cells were cultured in DMEM containing 10% FBS and used at passages 3–9.
Dual-Luciferase assay
For the 3′-UTR luciferase reporter assay, HFL1 cells were seeded onto a 96-well plate at a density of 2 × 10⁴ cells per well and transfected with 5 ng of a 3′-UTR luciferase reporter plasmid and 100 ng of an miRNA overexpression vector using LipofectamineTM 2000 (Invitrogen). For the promoter luciferase reporter assay, HFL1 cells were seeded onto a 96-well plate at a density of 2 × 10⁴ cells per well and transfected with 50 ng of the miR-101 promoter reporter vector and 100 ng of the pCMV-ETS1 vector, pCMV-ETS2 vector, or control vector (OriGene, Rockville, MD) using LipofectamineTM 2000. The TK plasmid, which expresses Renilla luciferase, was used as an internal control for normalization. The cells were collected 48 h after transfection, and firefly and Renilla luciferase activities were measured using the Dual-Luciferase® reporter assay system (Promega, Madison, WI). The results were presented as the ratio of firefly to Renilla luciferase activities.
Cell proliferation
LL29 cells were split into a 96-well plate. On the 2nd day, the cells were infected with a lentivirus expressing miR-101, shRNA, or the control at a multiplicity of infection (m.o.i.) of 50. After 48 h of virus infection, the cells were serum-starved for 24 h and then stimulated for 12 h with 1 μg/ml of WNT5a. Cell proliferation was determined using the BrdU cell proliferation kit (Millipore, Billerica, MA). For BrdU staining, 10 μm BrdU (Abcam, Cambridge, MA) was added to the culture medium for 24 h. The cultures were fixed in 4% paraformaldehyde for 30 min, treated with 2 n HCl for 30 min, and then proceeded to immunocytochemical analysis. The primary antibody was mouse anti-BrdU monoclonal antibody (1:100, Abcam). Secondary antibody was goat Alexa Fluor 546-conjugated anti-mouse IgG (1:300) (Molecular Probes, Eugene, OR). Nuclei were stained with DAPI.
Gel contraction activity
LL29 cells were infected with a lentivirus expressing miR-101 or the control at an m.o.i. of 50 for 48 h. The cells were treated with TGF-β1 (5 ng/ml) for 72 h. Then, the cells were mixed with collagen I to a final density of 1 × 10⁵ cells per ml and a final concentration of 1 mg/ml collagen I. Gel images were taken at 48 h and quantitatively analyzed using ImageJ software.
Western blotting
Protein samples were separated on 12% SDS-polyacrylamide gels and transferred onto nitrocellulose membranes. Primary antibodies and dilutions used for Western blotting included the following: goat anti-FZD4 (catalogue no. sc-66450, 1:1,000 dilution), rabbit anti-COL1A1 (catalogue no. sc-8784-R, lot no. J3013, 1:500 dilution), rabbit anti-COL3A1 (catalogue no. sc-8780-R, lot no. L1010, 1:500 dilution), rabbit anti-NFATc2 (catalogue no. c-23815, lot no. A1510, 1:200 dilution), rabbit anti-TGFBR1(catalogue no. sc-398, lot no. H1310, 1:500 dilution), rabbit anti-H1(catalogue no. sc10806, 1:1,000 dilution), and mouse anti-ETS2 (catalogue no. sc-365666, 1:1,000 dilution) (Santa Cruz Biotechnology); rabbit anti-FZD6 (catalogue no. ab98933, lot no. GR61807-1, 1:1,000 dilution), rabbit anti-WNT5a (catalogue no. ab72583, 1:1,000 dilution), mouse anti-ETS1 (catalogue no. ab96478, lot no. GR92236-1, 1:1,000 dilution), and mouse anti-GAPDH (catalogue no. ab181602, 1:4,000 dilution) (Abcam, Boston, MA); mouse anti-αSMA (catalogue no. A2547, 1:1,000 dilution) (Sigma) (Cell Signaling, Beverly, MA); anti-β-actin (catalogue no. A2066, lot no. 029k4838, 1:2,000 dilution) (Sigma). Secondary antibody (horseradish peroxidase-conjugated Immuno-Pure anti-IgG; H+L) was used at a dilution of 1:5,000. The blots were developed with Super Signal West Pico Luminol Enhancer solution and Super Signal West Pico stable peroxidase solution.
Immunocytochemistry
LL29 cells were split into an 8-chamber slide at a density of 2,000 cells per chamber. The cells were fixed for immunocytochemical analysis. The primary antibody was rabbit anti-NFATc2 (catalogue no. sc-23815, lot no. A1510, 1:300 dilution) (Santa Cruz Biotechnology, Santa Cruz, CA). The secondary antibody was Alexa Fluor 488-conjugated anti-rabbit IgG (1:300) (Molecular Probes, Eugene, OR).
Enzyme-linked immunosorbent assay
LL29 cells were split into a 6-well plate at a density of 200,000 cells per well. After 24 h of culture, the cells were infected with a miR-101 lentivirus at an m.o.i. of 50 for 48 h. Then, the cells were stimulated with TGF-β1 (5 ng/ml) for 0, 5, 15, 30, 60, and 120 min. The cells were lysed for an enzyme-linked immunosorbent assay (ELISA) performed using the PathScan® Phospho-Smad2 (Ser-465/467)/Smad3 (Ser-423/425) Sandwich and PathScan® Total Smad2/3 Sandwich ELISA Kit (Cell Signaling) according to the manufacturer's instructions.
Mouse model of bleomycin-induced pulmonary fibrosis
The animal procedures were approved by the Institutional Animal Care and Use Committee at Oklahoma State University. C57BL/6 male mice (6–8 weeks old) were divided into four groups: saline and control virus; saline and miR-101 virus; bleomycin and control virus; and bleomycin and miR-101 virus. On day 0, 60 μl of miR-101 adenovirus or control virus (5 × 10⁹ infectious units (IU) per mouse) were delivered into the lung intranasally. On day 1, 60 μl of bleomycin (0.06 units/mouse) or saline was delivered intranasally. On day 14, respiratory mechanics were determined using the FlexiVent (Scireq, Montreal, Canada). Then, the left lung was collected for the RNA, protein, and collagen content analyses. The right lung was fixed in 4% paraformaldehyde for histological analysis. The degree of fibrosis in the mouse lung was determined following the published method (42).
Hydroxyproline assay
The amount of collagen in the lung tissues was determined by the hydroxyproline assay according to the manufacturer's protocol (QuickZyme Biosciences, Netherlands) and expressed as micrograms per mg of lung tissue.
Statistical analysis
The data presented in the figures are the means ± S.E. or standard deviation. Statistical analyses were performed using Student's t test for two group comparisons, and analysis of variance (ANOVA), followed by Tukey's HSD test for multiple comparisons. A p value <0.05 was considered to be significant.
Author contributions
C. H. and L. L. developed study concept and design. C. H., X. X., Y. Y., A. M., Y. L., Y. Y., X. Z., X. Y., and D. X. performed experiments. C. H. and L. L. wrote the manuscript and M. R. B. and C. A. H. provided critical review of the manuscript.
Acknowledgments
This study utilized biological specimens and data provided by the Lung Tissue Research Consortium supported by the National Heart, Lung, and Blood Institute, National Institutes of Health.
This work was supported by National Institutes of Health Grants R01HL116876, R03HL95383, and P20GM103648 (to L. L.) and R01HL125227 and P01HL 091775 (to C. A. H.). The authors declare that they have no conflicts of interest with the contents of this article. The content is solely the responsibility of the authors and does not necessarily represent the official views of the National Institutes of Health.
Please note that the JBC is not responsible for the long-term archiving and maintenance of this site or any other third party hosted site.
- IPF
- idiopathic pulmonary fibrosis
- RACE
- rapid amplification of cDNA ends
- m.o.i.
- multiplicity of infection
- miRNA
- microRNA
- FVC
- forced vital capacity
- ANOVA
- analysis of variance
- NFAT
- nuclear factor of activated T-cell
- CsA
- cyclosporin A
- α-SMA
- α-smooth muscle actin.
References
- 1. Ramos C., Montano M., García-Alvarez J., Ruiz V., Uhal B. D., Selman M., and Pardo A. (2001) Fibroblasts from idiopathic pulmonary fibrosis and normal lungs differ in growth rate, apoptosis, and tissue inhibitor of metalloproteinases expression. Am. J. Respir. Cell Mol. Biol. 24, 591–598 [DOI] [PubMed] [Google Scholar]
- 2. Hecker L., Vittal R., Jones T., Jagirdar R., Luckhardt T. R., Horowitz J. C., Pennathur S., Martinez F. J., and Thannickal V. J. (2009) NADPH oxidase-4 mediates myofibroblast activation and fibrogenic responses to lung injury. Nat. Med. 15, 1077–1081 [DOI] [PMC free article] [PubMed] [Google Scholar]
- 3. Willis B. C., Liebler J. M., Luby-Phelps K., Nicholson A. G., Crandall E. D., du Bois R. M., and Borok Z. (2005) Induction of epithelial-mesenchymal transition in alveolar epithelial cells by transforming growth factor-beta1: potential role in idiopathic pulmonary fibrosis. Am. J. Pathol. 166, 1321–1332 [DOI] [PMC free article] [PubMed] [Google Scholar]
- 4. Kim K. K., Kugler M. C., Wolters P. J., Robillard L., Galvez M. G., Brumwell A. N., Sheppard D., and Chapman H. A. (2006) Alveolar epithelial cell mesenchymal transition develops in vivo during pulmonary fibrosis and is regulated by the extracellular matrix. Proc. Natl. Acad. Sci. U.S.A. 103, 13180–13185 [DOI] [PMC free article] [PubMed] [Google Scholar]
- 5. Tanjore H., Xu X. C., Polosukhin V. V., Degryse A. L., Li B., Han W., Sherrill T. P., Plieth D., Neilson E. G., Blackwell T. S., and Lawson W. E. (2009) Contribution of epithelial-derived fibroblasts to bleomycin-induced lung fibrosis. Am. J. Respir. Crit. Care Med. 180, 657–665 [DOI] [PMC free article] [PubMed] [Google Scholar]
- 6. Phillips R. J., Burdick M. D., Hong K., Lutz M. A., Murray L. A., Xue Y. Y., Belperio J. A., Keane M. P., and Strieter R. M. (2004) Circulating fibrocytes traffic to the lungs in response to CXCL12 and mediate fibrosis. J. Clin. Invest. 114, 438–446 [DOI] [PMC free article] [PubMed] [Google Scholar]
- 7. Moore B. B., Murray L., Das A., Wilke C. A., Herrygers A. B., and Toews G. B. (2006) The role of CCL12 in the recruitment of fibrocytes and lung fibrosis. Am. J. Respir. Cell Mol. Biol. 35, 175–181 [DOI] [PMC free article] [PubMed] [Google Scholar]
- 8. Xia H., Bodempudi V., Benyumov A., Hergert P., Tank D., Herrera J., Braziunas J., Larsson O., Parker M., Rossi D., Smith K., Peterson M., Limper A., Jessurun J., Connett J., Ingbar D., Phan S., Bitterman P. B., and Henke C. A. (2014) Identification of a cell-of-origin for fibroblasts comprising the fibrotic reticulum in idiopathic pulmonary fibrosis. Am. J. Pathol. 184, 1369–1383 [DOI] [PMC free article] [PubMed] [Google Scholar]
- 9. Steele M. P., and Schwartz D. A. (2013) Molecular mechanisms in progressive idiopathic pulmonary fibrosis. Annu. Rev. Med. 64, 265–276 [DOI] [PubMed] [Google Scholar]
- 10. Wolters P. J., Collard H. R., and Jones K. D. (2014) Pathogenesis of idiopathic pulmonary fibrosis. Annu. Rev. Pathol. 9, 157–179 [DOI] [PMC free article] [PubMed] [Google Scholar]
- 11. Pandit K. V., Corcoran D., Yousef H., Yarlagadda M., Tzouvelekis A., Gibson K. F., Konishi K., Yousem S. A., Singh M., Handley D., Richards T., Selman M., Watkins S. C., Pardo A., Ben-Yehudah A., et al. (2010) Inhibition and role of let-7d in idiopathic pulmonary fibrosis. Am. J. Respir. Crit. Care Med. 182, 220–229 [DOI] [PMC free article] [PubMed] [Google Scholar]
- 12. Cushing L., Kuang P. P., Qian J., Shao F., Wu J., Little F., Thannickal V. J., Cardoso W. V., and Lü J. (2011) MIR-29 is a major regulator of genes associated with pulmonary fibrosis. Am. J. Respir. Cell Mol. Biol. 45, 287–294 [DOI] [PMC free article] [PubMed] [Google Scholar]
- 13. Parker M. W., Rossi D., Peterson M., Smith K., Sikström K., White E. S., Connett J. E., Henke C. A., Larsson O., and Bitterman P. B. (2014) Fibrotic extracellular matrix activates a profibrotic positive feedback loop. J. Clin. Invest. 124, 1622–1635 [DOI] [PMC free article] [PubMed] [Google Scholar]
- 14. Montgomery R. L., Yu G., Latimer P. A., Stack C., Robinson K., Dalby C. M., Kaminski N., and van Rooij E. (2014) MicroRNA mimicry blocks pulmonary fibrosis. EMBO Mol. Med. 6, 1347–1356 [DOI] [PMC free article] [PubMed] [Google Scholar]
- 15. Liu G., Friggeri A., Yang Y., Milosevic J., Ding Q., Thannickal V. J., Kaminski N., and Abraham E. (2010) miR-21 mediates fibrogenic activation of pulmonary fibroblasts and lung fibrosis. J. Exp. Med. 207, 1589–1597 [DOI] [PMC free article] [PubMed] [Google Scholar]
- 16. Bodempudi V., Hergert P., Smith K., Xia H., Herrera J., Peterson M., Khalil W., Kahm J., Bitterman P. B., and Henke C. A. (2014) miR-210 promotes IPF fibroblast proliferation in response to hypoxia. Am. J. Physiol. Lung Cell Mol. Physiol 307, L283–L294 [DOI] [PMC free article] [PubMed] [Google Scholar]
- 17. Das S., Kumar M., Negi V., Pattnaik B., Prakash Y. S., Agrawal A., and Ghosh B. (2014) MicroRNA-326 regulates profibrotic functions of transforming growth factor-β in pulmonary fibrosis. Am. J. Respir. Cell Mol. Biol. 50, 882–892 [DOI] [PMC free article] [PubMed] [Google Scholar]
- 18. Xiao X., Huang C., Zhao C., Gou X., Senavirathna L. K., Hinsdale M., Lloyd P., and Liu L. (2015) Regulation of myofibroblast differentiation by miR-424 during epithelial-to-mesenchymal transition. Arch. Biochem. Biophys. 566, 49–57 [DOI] [PMC free article] [PubMed] [Google Scholar]
- 19. Oak S. R., Murray L., Herath A., Sleeman M., Anderson I., Joshi A. D., Coelho A. L., Flaherty K. R., Toews G. B., Knight D., Martinez F. J., and Hogaboam C. M. (2011) A micro RNA processing defect in rapidly progressing idiopathic pulmonary fibrosis. PLoS ONE 6, e21253. [DOI] [PMC free article] [PubMed] [Google Scholar]
- 20. Vuga L. J., Ben-Yehudah A., Kovkarova-Naumovski E., Oriss T., Gibson K. F., Feghali-Bostwick C., and Kaminski N. (2009) WNT5A is a regulator of fibroblast proliferation and resistance to apoptosis. Am. J. Respir. Cell Mol. Biol. 41, 583–589 [DOI] [PMC free article] [PubMed] [Google Scholar]
- 21. Sato A., Yamamoto H., Sakane H., Koyama H., and Kikuchi A. (2010) Wnt5a regulates distinct signalling pathways by binding to Frizzled2. EMBO J. 29, 41–54 [DOI] [PMC free article] [PubMed] [Google Scholar]
- 22. Dejmek J., Safholm A., Kamp Nielsen C., Andersson T., and Leandersson K. (2006) Wnt-5a/Ca2+-induced NFAT activity is counteracted by Wnt-5a/Yes-Cdc42-casein kinase 1α signaling in human mammary epithelial cells. Mol. Cell Biol. 26, 6024–6036 [DOI] [PMC free article] [PubMed] [Google Scholar]
- 23. Thannickal V. J., Lee D. Y., White E. S., Cui Z., Larios J. M., Chacon R., Horowitz J. C., Day R. M., and Thomas P. E. (2003) Myofibroblast differentiation by transforming growth factor-β1 is dependent on cell adhesion and integrin signaling via focal adhesion kinase. J. Biol. Chem. 278, 12384–12389 [DOI] [PubMed] [Google Scholar]
- 24. Sime P. J., Xing Z., Graham F. L., Csaky K. G., and Gauldie J. (1997) Adenovector-mediated gene transfer of active transforming growth factor-β1 induces prolonged severe fibrosis in rat lung. J. Clin. Invest. 100, 768–776 [DOI] [PMC free article] [PubMed] [Google Scholar]
- 25. Varambally S., Cao Q., Mani R. S., Shankar S., Wang X., Ateeq B., Laxman B., Cao X., Jing X., Ramnarayanan K., Brenner J. C., Yu J., Kim J. H., Han B., Tan P., et al. (2008) Genomic loss of microRNA-101 leads to overexpression of histone methyltransferase EZH2 in cancer. Science 322, 1695–1699 [DOI] [PMC free article] [PubMed] [Google Scholar]
- 26. Frankel L. B., Wen J., Lees M., Høyer-Hansen M., Farkas T., Krogh A., Jäättelä M., and Lund A. H. (2011) microRNA-101 is a potent inhibitor of autophagy. EMBO J. 30, 4628–4641 [DOI] [PMC free article] [PubMed] [Google Scholar]
- 27. Xu Y., An Y., Wang Y., Zhang C., Zhang H., Huang C., Jiang H., Wang X., and Li X. (2013) miR-101 inhibits autophagy and enhances cisplatin-induced apoptosis in hepatocellular carcinoma cells. Oncol. Rep. 29, 2019–2024 [DOI] [PubMed] [Google Scholar]
- 28. Smits M., Mir S. E., Nilsson R. J., van der Stoop P. M., Niers J. M., Marquez V. E., Cloos J., Breakefield X. O., Krichevsky A. M., Noske D. P., Tannous B. A., and Würdinger T. (2011) Down-regulation of miR-101 in endothelial cells promotes blood vessel formation through reduced repression of EZH2. PLoS ONE 6, e16282. [DOI] [PMC free article] [PubMed] [Google Scholar]
- 29. Kim J. H., Lee K. S., Lee D. K., Kim J., Kwak S. N., Ha K. S., Choe J., Won M. H., Cho B. R., Jeoung D., Lee H., Kwon Y. G., and Kim Y. M. (2014) Hypoxia-responsive microRNA-101 promotes angiogenesis via heme oxygenase-1/vascular endothelial growth factor axis by targeting cullin 3. Antioxid. Redox. Signal. 21, 2469–2482 [DOI] [PMC free article] [PubMed] [Google Scholar]
- 30. Zhu Q. Y., Liu Q., Chen J. X., Lan K., and Ge B. X. (2010) MAPK phosphatase-1 to regulate the activation of MAPKs in macrophages. J. Immunol. 185, 7435–7442 [DOI] [PubMed] [Google Scholar]
- 31. Tu X., Zhang H., Zhang J., Zhao S., Zheng X., Zhang Z., Zhu J., Chen J., Dong L., Zang Y., and Zhang J. (2014) MicroRNA-101 suppresses liver fibrosis by targeting the TGFβ signalling pathway. J. Pathol. 234, 46–59 [DOI] [PubMed] [Google Scholar]
- 32. Pan Z., Sun X., Shan H., Wang N., Wang J., Ren J., Feng S., Xie L., Lu C., Yuan Y., Zhang Y., Wang Y., Lu Y., and Yang B. (2012) MicroRNA-101 inhibited postinfarct cardiac fibrosis and improved left ventricular compliance via the FBJ osteosarcoma oncogene/transforming growth factor-β1 pathway. Circulation 126, 840–850 [DOI] [PubMed] [Google Scholar]
- 33. Wang L., Zhang X., Jia L. T., Hu S. J., Zhao J., Yang J. D., Wen W. H., Wang Z., Wang T., Zhao J., Wang R. A., Meng Y. L., Nie Y. Z., Dou K. F., Chen S. Y., Yao L. B., Fan D. M., Zhang R., and Yang A. G. (2014) c-Myc-mediated epigenetic silencing of microRNA-101 contributes to dysregulation of multiple pathways in hepatocellular carcinoma. Hepatology 59, 1850–1863 [DOI] [PubMed] [Google Scholar]
- 34. Baran C. P., Fischer S. N., Nuovo G. J., Kabbout M. N., Hitchcock C. L., Bringardner B. D., McMaken S., Newland C. A., Cantemir-Stone C. Z., Phillips G. S., Ostrowski M. C., and Marsh C. B. (2011) Transcription factor ets-2 plays an important role in the pathogenesis of pulmonary fibrosis. Am. J. Respir. Cell Mol. Biol. 45, 999–1006 [DOI] [PMC free article] [PubMed] [Google Scholar]
- 35. Kasinski A. L., and Slack F. J. (2010) Potential microRNA therapies targeting Ras, NFκB and p53 signaling. Curr. Opin. Mol. Ther. 12, 147–157 [PubMed] [Google Scholar]
- 36. Chen Z., Chintagari N. R., Guo Y., Bhaskaran M., Chen J., Gao L., Jin N., Weng T., and Liu L. (2007) Gene expression of rat alveolar type II cells during hyperoxia exposure and early recovery. Free Radic. Biol. Med. 43, 628–642 [DOI] [PMC free article] [PubMed] [Google Scholar]
- 37. Chen Z., and Liu L. (2005) RealSpot: software validating results from DNA microarray data analysis with spot images. Physiol. Genomics. 21, 284–291 [DOI] [PubMed] [Google Scholar]
- 38. Huang C., Xiao X., Chintagari N. R., Breshears M., Wang Y., and Liu L. (2014) MicroRNA and mRNA expression profiling in rat acute respiratory distress syndrome. BMC. Med. Genomics 7, 46. [DOI] [PMC free article] [PubMed] [Google Scholar]
- 39. Bhaskaran M., Wang Y., Zhang H., Weng T., Baviskar P., Guo Y., Gou D., and Liu L. (2009) MicroRNA-127 modulates fetal lung development. Physiol. Genomics 37, 268–278 [DOI] [PMC free article] [PubMed] [Google Scholar]
- 40. Zhao C., Huang C., Weng T., Xiao X., Ma H., and Liu L. (2012) Computational prediction of microRNAs targeting GABA receptors and experimental verification of miR-181, miR-216 and miR-203 targets in GABA-A receptor. BMC. Res. Notes 5, 91. [DOI] [PMC free article] [PubMed] [Google Scholar]
- 41. Bruce M. C., Honaker C. E., and Cross R. J. (1999) Lung fibroblasts undergo apoptosis following alveolarization. Am. J. Respir. Cell Mol. Biol. 20, 228–236 [DOI] [PubMed] [Google Scholar]
- 42. Ashcroft T., Simpson J. M., and Timbrell V. (1988) Simple method of estimating severity of pulmonary fibrosis on a numerical scale. J. Clin. Pathol. 41, 467–470 [DOI] [PMC free article] [PubMed] [Google Scholar]