

Abstract
Early-childhood biomonitoring of persistent organic pollutants (POPs) is challenging due to the logistic and ethical limitations associated with blood sampling. We investigated using faeces as a non-invasive matrix to estimate internal exposure to POPs. The concentrations of selected POPs were measured in matched plasma and faecal samples collected from 20 infants/toddlers (aged 13 ± 4.8 months), including a repeat sample time point for 13 infants (~5 months apart). We observed higher rates of POP quantification in faeces (2 g dry weight) than in plasma (0.5 mL). Among the five chemicals that had quantification frequencies over 50% in both matrices, except for HCB, log concentration in faeces (Cf) and blood (Cb) were correlated (r > 0.74, P < 0.05) for p.p′-dichlorodiphenyldichloroethylene (p,p′-DDE), 2,3′,4,4′,5-pentachlorobiphenyl (PCB118), 2,2′,3,4,4′,5′-penta-chlorobiphenyl (PCB138) and 2,2′,4,4′,5,5′-pentachlorobiphenyl (PCB153). We determined faeces:plasma concentration ratios (Kfb), which can be used to estimate Cb from measurements of Cf for infants/toddlers. For a given chemical, the variation in Kfb across individuals was considerable (CV from 0.46 to 0.70). Between 5% and 50% of this variation was attributed to short-term intra-individual variability between successive faecal samples. This variability could be reduced by pooling faeces samples over several days. Some of the remaining variability was attributed to longer-term intra-individual variability, which was consistent with previously reported observations of a decrease in Kfb over the first year of life. The strong correlations between Cf and Cb demonstrate the promise of using faeces for biomonitoring of these compounds. Future research on the sources of variability in Kfb could improve the precision and utility of this technique.
Keywords: POPs, Non-invasive bio-monitoring, Infants, Toddlers, Faeces, Blood
1. Introduction
The burden of chronic diseases has been rapidly increasing during the past decades (IHME, 2013) and risk factors occurring during the developmental period are now recognized to play an important role (Barker, 2004). The mechanisms implicated in developmental programming of chronic disorders are poorly understood, but epigenetic mechanisms are likely involved (Hanson and Gluckman, 2015). Exposure to environmental xenobiotics is suggested to be one of the triggers for epigenetic changes, especially during sensitive early life stages (Nickerson, 2006; Kortenkamp et al., 2011; Vaiserman, 2015). Persistent organic pollutants (POPs) including polychlorinated biphenyls (PCBs), organochlorine pesticides (OCPs) and polybrominated diphenyl ethers (PBDEs), are a group of environmental xenobiotics that are resistant to degradation and bioaccumulate in humans, and have been shown to induce epigenetic changes (Herbstman et al., 2010; Valvi et al., 2012; Eskenazi et al., 2013).
All POPs that are listed on the Stockholm Convention have been banned or substantially restricted in their use in many countries. For many POPs like PCBs, OCPs, tetrabromodiphenyl ether and pentabromodiphenyl ether, a decrease in exposure and associated body burden has been observed in some parts of the world (Law et al., 2014; Mikeš et al., 2012). Nonetheless, exposure and accumulation will continue for decades to come (Hung et al., 2016; Ryan and Rawn, 2014; Sharma et al., 2014; Toms et al., 2012). Therefore, research continues into whether adverse effects from POPs are occurring at the current levels of exposure and whether extra actions should be taken to reduce exposure (Nickerson, 2006). In order to answer these questions, it is vital to be able to quantify exposure during critical exposure windows, including during the early stages of life (La Merrill et al., 2013).
For infants and toddlers, individual and longitudinal data on POP concentrations in blood samples are scarce, due to the logistic and ethical constraints regarding sampling blood in these age groups (Needham et al., 2005). Faeces can be obtained from infants/toddlers less invasively and more conveniently than blood, and therefore may be useful for early-life biomonitoring. In toddlers, significant correlations between congener-specific concentrations in faeces and serum were found for seven of nine PBDE congeners studied (Sahlstrom et al., 2015). Concentrations of p,p′ DDE and PCB153 in faeces collected from one infant over a period of one year were reported to be more reflective of estimated body burden than of rate of dietary intake at the time of faecal sample collection (Chen et al., 2016). Those results are in accordance with findings from studies of POPs in adults that showed that POP levels in faeces are not influenced by current dietary intake levels, but are instead governed by levels in the body (Rohde et al., 1999; To-Figueras et al., 2000; Moser and McLachlan, 2001).
Furthermore, it has been demonstrated in adults that the POP concentration in faeces is highly correlated with the POP concentration in blood, while the influence of the mass of faeces excreted each day on POP concentration in faeces is minor in comparison (Moser and McLachlan, 2001). On the basis of this work, Moser and McLachlan (2001) suggested that the ratio of POP concentrations in faeces to blood (Kfb) is a parameter of considerable practical value for estimating the concentrations of POPs in the body. However, before this method can be reliably used to estimate infants and toddlers POP body burden, more data regarding how Kfb varies during the early years are required. Although variations in Kfb have been observed between individuals (Sahlstrom et al., 2015), between chemicals and between pre- and post-weaning in the same individual (Chen et al., 2016), no studies have quantified the relative contributions of intra- and inter-individual variability to the overall variation in Kfb.
In this study, the concentrations of several OCPs, PCB congeners and PBDE congeners were measured in matched plasma and faecal samples from 20 infants/toddlers at two time points. The relationship between the concentrations in plasma (Cb) and the concentrations in faeces (Cf) was then assessed via both linear regression and variability analysis of Kfb. The study was designed to allow comparison of the intra- and inter-individual variation in Kfb, with the goal of investigating further the potential utility of faeces as a non-invasive matrix for biomonitoring POPs in infants and toddlers.
2. Methods
2.1. Study participants
The participants (infants/toddlers [n = 20]) in this study were recruited from the ongoing study “A phase 2, single-centre, double blind, randomized, placebo-controlled study testing the primary prevention of persistent asthma in high risk children by protection against acute respiratory infections during early childhood using OM-85” (OMPAC). The inclusion/exclusion criteria for the OMPAC study are shown in Table S1.
For the analysis of the long-term variation in Kfb, participants were asked to donate samples twice for the present study. The first sample collection occurred in April 2014 while the second occurred in September 2014. At each sampling time, one plasma sample of ~0.5 mL and faecal samples from 1 to 2 bowel movements (~2 g dry weight [dw]) were collected from each participant, and a questionnaire regarding living and eating habits was completed by their parents. Participants were not required to fast before the blood samples were conducted. Thirteen participants completed two sample periods. Four participants provided a sample only in the first sample period, while three participated only in the second.
If a faeces sample was smaller than 1 g dw, it was combined with the other faeces sample from the same sampling day prior to extraction. Otherwise the two faeces samples from the same sampling day (from participants No. 5, 20 and 22 from the first sampling, and participants No. 2, 3, 8, 10, 15 and 16 from the second sampling) were analysed separately to provide information regarding the short-term variation in Kfb.
This study received ethics approval by the University of Queensland Ethics Committee (approval number H/308NRCET/00) and Children’s Health Services Queensland Human Research Ethics Committee (HREC reference number: HREC/12/QRCH/119). The Centers for Disease Control and Prevention (CDC) were determined not to be engaged in human subject research since no personally identifiable information was made available to CDC researchers.
2.2. Sampling
Blood was collected into a polypropylene tube with 100 units of preservative free heparin. It was then processed as follows to obtain plasma: (i) centrifuging at 700 ×g for 10 min at room temperature; (ii) collecting the plasma layer down to within 0.5–1.0 cm of the top of the red cell layer (avoiding disturbance of white cells) using a sterile transfer pipette; (iii) centrifuging the plasma again at 700 ×g for 10 mins to remove platelets; (iv) transferring the plasma sample into a brown Eppendorf tube and storing at −80 °C.
Faecal samples for each participant were collected from one to two defecation events directly before and after the blood sampling. At each sampling point, only faecal material that had not been in contact with the inner liner of the diaper was transferred to a sheet of aluminium foil. The folded aluminium foil sheet was then sealed inside a plastic resealable bag and stored in a freezer at the participant’s home until transportation to the laboratory (on ice, in a cool bag). A detailed description of faecal sample collection and transportation has been provided previously (Chen et al., 2015). Faecal samples were stored at −20 °C until analysis.
2.3. Analysis
Analysis included four chlorinated pesticides (p,p′ DDE, HCB, β-HCH, γ-HCH), five PCB congeners (PCB28, 118, 138, 153 and 180) and five PBDE congeners (PBDE 47, 99, 100, 153 and 154) in plasma and faecal samples. All brown Eppendorf tubes containing plasma samples were sent to the Centers for Disease Control and Prevention (CDC), USA, on dry ice for analysis. POPs were measured in individual plasma samples using a methodology published previously (Jones et al., 2012; Sjodin et al., 2004). POPs were measured in faeces using a previously described method (Chen et al., 2015). Detailed description of the methods can be found in the Table S2.
2.4. Quality control
Quality control procedures for plasma and faeces samples included method blanks and spiked samples. Additional details of quality control procedures and determination of limits of detection (LOD) and quantification (LOQ) are provided in Table S3. The average recoveries of the labelled standards ranged from 61% to 93% for all chemicals (Table S4). Only results that were above the LOQ were used in the regression analysis. A more conservative criterion for quantification was used for faecal samples because the variability in matrix properties contributes to a higher uncertainty in the measurements. For summarizing data, results for plasma below the LOQ were imputed as LOQ/(2)1/2; results for faeces below the LOD were imputed as LOD/(2)1/2 and for faeces between the LOD and the LOQ were imputed as the average of LOD and LOQ.
Concentrations of target POPs in faeces were determined on both a dry-weight (dw) and lipid-weight basis. In those cases where two samples from the same day were analysed (Table S5), the dry-weight based concentrations of POPs in a given individual were more consistent than lipid-weight based concentrations (paired t-test done on percent differences of both lipid-based and dry-weight based data, P = 0.005, n = 38). Therefore, the dry-weight based concentrations in faecal samples were used for the data analysis. In the following text, Cb and Cf represent the lipid-weight normalized concentration in plasma and dry-weight normalized concentration in faeces, respectively.
2.5. Statistical analysis
The Kfb was calculated according to the following formula:
Due to the varying number of samples that were collected from each participant, the data from one sampling time point from an individual (who participated at both sampling time points) was randomly chosen to form a restricted cross-sectional dataset (n = 20) for the linear-regression analyses of Cb and Cf. Short-term (< 24 h) variability in Kfb was assessed using data from a sub-group of participants (n = 7) who provided two faecal samples within a 24-hour period. For each of these individuals, the same Cb was used to derive both Kfb values. The intra-individual variance in Kfb (the percent difference between the two values) was then calculated as well for this sub-group. To assess the relative contributions of intra-individual variation and inter-individual variation to short-term variability in Kfb, the intra-class correlation coefficient (ICC) was determined. ICC is calculated as the ratio of the between-individual variance to the total variance (sum of between- and within-individual variance) in a set of data with repeated measures for individuals. ICC values provide a measure of reproducibility for repeated measures and vary between 0 and 1, with 0 indicating no reproducibility and 1 indicating perfect reproducibility. The relative contributions of intra- and inter-individual variation to long-term variability in Kfb was also assessed by determining the ICC in a subgroup of participants (n = 13) who provided faecal and blood samples at two sampling periods (~5 months apart).
Linear-regression analyses of the relationship between Cb and Cf, and ANOVA of Kfb among chemicals were performed using GraphPad Prism 6 (GraphPad Software, Inc., USA). The intra-class correlation coefficient (ICC) was determined using SPSS Statistics 23 (Chicago, USA). Other statistical evaluation of the analytical and demographical data was performed using Microsoft Excel 2013 (Microsoft, Redmond, WA, USA).
3. Results
The chemical-specific analytical results are shown in Tables S6 and S7. Eight chemicals (β-HCH, γ-HCH, PCB28, PCB180, BDE99, BDE100, BDE153 and BDE154) were not included for regression analysis due to low quantification frequencies in both plasma and faecal samples. The quantification frequency of BDE47 was 88% in faeces but only 12% in plasma and hence it was not included in the regression analysis either.
3.1. Cohort information
The participants were evenly distributed in terms of sex and delivery type. The majority of participants (60%) were weaned before the first sampling period. The average age of the participants was 13 months (ranging from 5.6 months to 24 months) for the cross-sectional dataset. One participant took antibiotics within a week before or after sampling, and one participant took antibiotics on the sampling day. No bowel complaints were reported for any participant on the sampling days. Additional details regarding the participating infants and toddlers are presented in Tables S8, S9, and S10.
3.2. Concentrations of POPs in plasma (Cb) and faeces (Cf)
The cross-sectional dataset (n = 20) that was used for the linear-regression analyses is summarized in Table S11. The Cb of four chlorinated pesticides (p,p′-DDE, HCB, β-HCH and γ-HCH), five PCB congeners (PCB28, 118, 138, 153 and 180) and five PBDE congeners (BDE 47, 99, 100, 153 and 154) from 20 infants/toddlers are summarized in Table 1 (more details are summarized in Table S12). In this cross-sectional dataset, p,p′ DDE was the only compound quantified in all the plasma samples. HCB, PCB118, 138, 153 and 180 were quantified in 55–75% of the samples. Other analysed chemicals were quantified in < 50% of the samples. p,p′ DDE had the highest Cb, followed by HCB and then the PCB congeners. Arithmetic mean values of Cb were similar to mean lipid-normalized concentrations in the pooled serum sample collected in 2006–2007 from Australian infants, except for the BDEs 47, 99 and 100, which had lower concentrations in our dataset (Toms et al., 2009) (Fig. S1).
Table 1.
POP concentrations in infants’ and toddlers’ plasma and faeces samples.
| POP concentrations in plasma samplesa (n = 20), ng/g lipid
|
POP concentrations in faeces samplesd (n = 20), ng/g dw
|
|||
|---|---|---|---|---|
| QF%b | GMc (95% CI) | QF% | GM (95% CI) | |
| Lipid content (%) | – | 0.52 (0.48, 0.55) | – | 11 (9.4, 14) |
| p,p′-DDE | 100 | 100 (55, 180) | 90 | 0.61 (0.31, 1.2) |
| HCB | 65 | 8.8 (6.7, 12) | 90 | 0.069 (0.045, 0.11) |
| β-HCH | 30 | 5.4 (4.5, 6.5) | 40 | 0.01 (0.0042, 0.026) |
| γ-HCH | 0 | 4.3 (3.8, 5.0) | 30 | 0.011 (0.0079, 0.016) |
| PCB28 | 20 | 1.0 (0.85, 1.3) | 30 | 0.026 (0.016, 0.043) |
| PCB118 | 55 | 1.8(1.3, 2.7) | 80 | 0.042 (0.023, 0.078) |
| PCB138 | 70 | 2.7 (1.7, 4.7) | 75 | 0.046 (0.023, 0.078) |
| PCB153 | 75 | 3.3 (2.0, 5.7) | 75 | 0.068 (0.035, 0.13) |
| PCB180 | 55 | 2.0 (1.3, 3.0) | 20 | 0.019 (0.010, 0.034) |
| BDE47 | 20 | 2.5 (2.1, 3.0) | 90 | 0.20 (0.11, 0.36) |
| BDE99 | 0 | 0.87 (0.75, 1.0) | 45 | 0.014 (0.0073, 0.028) |
| BDE100 | 20 | 0.99 (0.83, 1.2) | 15 | 0.015 (0.010, 0.022) |
| BDE153 | 40 | 1.9 (1.4, 2.5) | 20 | 0.0092 (0.004, 0.019) |
| BDE154 | 0 | 0.87 (0.75, 1.0) | 0 | 0.0019 (0.0015, 0.0022) |
POPs concentration: LOQ/(2)1/2 was used for the concentration under quantification limit when the GM was calculated.
QF%, quantification frequency (> LOQ).
GM: geometric mean.
POP concentrations: LOD/(2)1/2 was used for the concentrations < LOD when the GM was calculated. The average of LOD and LOQ was used for results between LOD and LOQ when the GM was calculated.
Cb was not normally distributed for any of the chemicals (D’Agostino & Person normality test). The Cb of p,p′-DDE ranged by more than two orders of magnitude (9.6–3400 ng/g lipid) among participants. The geometric means of Cb of PCB 138, 153, 180 and HCB were 2.7, 3.3, 2.0, and 8.8 ng/g lipid, respectively. Concentrations of DDE, HCB, PCB118, 138 and 153 in plasma are plotted against participant age in Fig. S2.
The Cf of four chlorinated pesticides (p,p′-DDE, HCB, β-HCH and γ-HCH), five PCB congeners (PCB28, 118, 138, 153 and 180) and five PBDE congeners (BDE 47, 99, 100, 153 and 154) in faecal samples from 20 infants/toddlers are also summarized in Table 1. p,p′-DDE, HCB and BDE47 were quantified above LOQ in 90% of faecal samples, followed by PCB118 (80%), PCB138 and PCB153 (both 75%). Other analysed chemicals were quantified in < 50% of the samples. p,p′-DDE had the highest concentration in faeces (mean 1.7 ng/g dw), followed by BDE47 (0.37 ng/g dw) and then PCB 153, HCB and other PCB congeners (0.084–0.20 ng/g dw).
Similar to the results for plasma, Cf was not normally distributed for any of the chemicals (D’Agostino & Person normality test). The geometric mean Cf of p,p′ DDE was 0.61 ng/g dw, while for the PCBs ranged from 0.019 to 0.068 ng/g dw. The geometric mean Cf of HCB was 0.069 ng/g dw, while for the PBDEs it ranged from 0.0019 to 0.20 ng/g dw. The concentrations of DDE, HCB, PCB118, 138 and 153 in faecal samples are plotted for every participant along with their ages in Fig. S3.
3.3. Concentrations in faeces in relation to concentrations in matched plasma samples
As both Cb and Cf are more nearly log-normal than normal, the association between log10Cb and log10 Cf was assessed for p,p′-DDE, HCB, PCB118, 138 and 153 using linear regression (see Tables S13 and S14). The regressions were significant with values of r2 ranging from 0.55 to 0.77, except for HCB (r2of 0.022). These relationships are illustrated in Fig. 1.
Fig. 1.
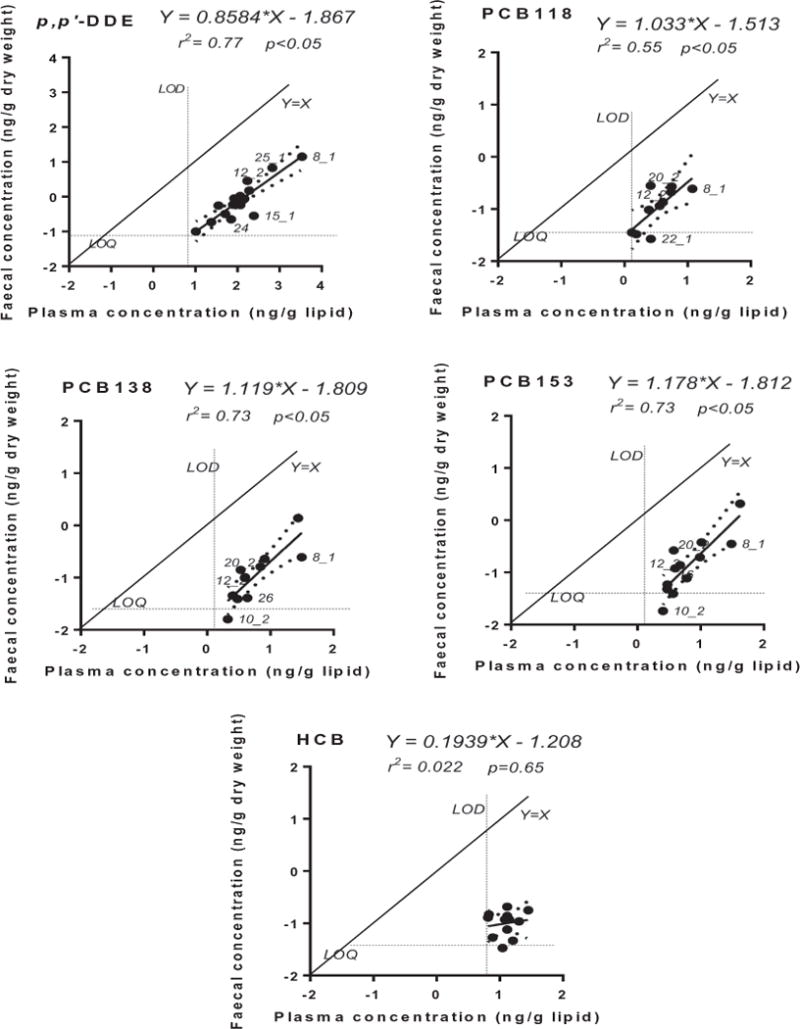
Linear regression for five chemicals between the log10 transformed (dry-weight based) faecal concentration and (lipid-weight based) plasma concentration (n = 20). The 95% confidence intervals of the linear regressions are shown with dashed lines (details in Table S11). Mean LOD for plasma concentrations and mean LOQ for faecal concentrations are also shown.
The Kfb values for all plasma-faeces sample pairs are shown in Table S15. Summary statistics for the faeces:blood concentration ratios (Kfb) determined from the cross-sectional dataset are shown in Tables S16 and 2. The Kfb values were normally distributed for p,p′-DDE, HCB and PCB138 (D’Agostino & Pearson normality test). The mean Kfb values for p,p′-DDE, HCB and PCB138 were 0.0081, 0.024 and 0.018, respectively. The coefficient of variation (CV) of Kfb was 47%, 66% and 57% for p,p′-DDE, HCB, and PCB138, respectively. The Kfb values for PCB 118 and PCB 153 ranged from 0.010 to 0.11 and 0.0072 to 0.073, respectively.
Table 2.
Kfb ([g lipid]/[g dw]) of three sub-groups for selected POPs.
| Chemicals | DDE | HCB | PCB118 | PCB138 | PCB153 |
|---|---|---|---|---|---|
| The cross-sectional dataset (n = 20) | |||||
| Number (> LOQ) | 18 | 12 | 10 | 12 | 12 |
| Mean | 0.0081 | 0.0099 | 0.039 | 0.023 | 0.027 |
| Std. deviation | 0.0038 | 0.0065 | 0.027 | 0.013 | 0.019 |
| CV | 46% | 66% | 69% | 58% | 70% |
| Passed normality test | YES | YES | NO | YES | NO |
| 5% percentile (P5) | 0.0033 | 0.0029 | 0.01 | 0.0076 | 0.0072 |
| Median | 0.0078 | 0.0075 | 0.036 | 0.022 | 0.021 |
| 95% percentile (P95) | 0.017 | 0.023 | 0.11 | 0.051 | 0.073 |
| P95/P5 | 5.2 | 7.9 | 11 | 6.7 | 10 |
| Results in adultsa (for comparison) | |||||
| Number (> LOQ) | – | 4 | 4 | 5 | 5 |
| Mean | – | 0.024 | 0.023 | 0.018 | 0.016 |
| Std. deviation | – | 0.005 | 0.013 | 0.008 | 0.007 |
| CV | – | 21% | 57% | 44% | 44% |
|
| |||||
| The subgroup of participants with two Kfb vales estimated from two successive bowel movements (n = 7) | |||||
| Intra-individual variability (%difference)b | |||||
| Min | 12 | 11 | 0.74 | 3.9 | 10 |
| Mean | 45 | 42 | 42 | 44 | 42 |
| Max | 79 | 81 | 74 | 97 | 91 |
| ICCc (n) | 0.50 (7) | 0.82 (5) | 0.70 (5) | 0.89 (6) | 0.95 (6) |
|
| |||||
| The sub-group of participants with two Kfb values 5 months apart (n = 13) | |||||
| Intra-individual variability (%difference) | |||||
| Min | 18 | 39 | 19 | 13 | 0 |
| Mean | 49 | 70 | 31 | 49 | 29 |
| Max | 112 | 100 | 59 | 82 | 75 |
| ICC (n) | 0.32 (10) | 0.50 (2) | 0.84 (6) | 0.47 (5) | 0.85 (6) |
–: not calculated or not reported due to lack of data.
Reference: Moser and McLachlan (2001).
%Difference.
Two-way random absolute agreement ICC was used (single measures are presented here).
3.4. Sources of variability in Kfb
The influence of short-term variation in Kfb was assessed using a sub-group of participants (n = 7) who provided two faeces samples collected successively within a day. These samples were analysed separately. The percentage difference in Cf between successively collected samples was as high as 48% (Table S5). These Cf data were used to calculate two Kfb values for each individual, whereby Cb was assumed to be the same for the two successively collected faecal samples (see Table 2). Two-way random absolute agreement ICC coefficients were calculated for the paired Kfb values for the seven individuals in this subgroup. For HCB and the PCBs, the ICCs ranged from 0.70 to 0.95, indicating that most of the observed variability in Kfb was due to inter-individual differences, while 5–30% was due to short-term variability between the measurements of two successive faecal samples. A lower value of 0.50 was obtained for p,p′-DDE, indicating that half of the observed variability in Kfb was due to short term variability between two successive faecal-sample measurements.
A second sub-group of the participants (n = 13) provided samples collected ~5 months apart, which allowed investigation of the long-term intra-individual variation in Kfb. The percentage difference between the two Kfb values intra-individually varied from 18 to 112% for p,p′-DDE, 39 to 100% for HCB, 19 to 59% for PCB118, 13 to 82% for PCB138, and 0 to 75% for PCB153 (see Table 2). The two-way random absolute agreement ICC values were above 0.84 and 0.85 for PCB 118 and 153, respectively, indicating that ~15% of the observed whole variability in Kfb was due to intra-individual variability. The ICC values for DDE, HCB and PCB 138 were 0.32, 0.50 and 0.47, respectively, indicating that 50% or more of the total variability was due to intra-individual variability for these chemicals.
4. Discussion
Compared to blood, using faeces for POP biomonitoring in infants/toddlers has the benefit of easier access to sufficient sample volumes to quantify the contaminants. The 2 g of faeces in our study contained 6 times more p,p′-DDE than 0.5 mL of plasma (equivalent to about 1 mL of blood) (Fig. S4). Since a larger effective sample size can be achieved for faecal samples, it allows for quantification at lower concentrations for DDE and other contaminants with comparable or higher Kfb values.
4.1. The relationship between Cf and Cb
For the five compounds with high quantification frequencies in both matrices, the log-transformed Cb and Cf values were significantly and linearly correlated for p,p′-DDE, PCB118, 138, and 153. The 95% confidence intervals of the slope of the log-log regression included one for all four chemicals, consistent with a linear relationship between Cb and Cf. For HCB the correlation was not significant. This may be due to the fact that HCB had the narrowest ranges in Cb and Cf and all of the data were close to the LOD/LOQ (Fig. 1). The Kfb value for p,p′-DDE was significantly different from the Kfb values for the three PCB congeners (one-way ANOVA, Friedman test, P < 0.001). This may reflect the different sorptive capacities of the faeces for the different compounds. This indicates that chemical-specific Kfb values are needed for biomo-nitoring purposes.
4.2. Sources of intra-individual variability in Kfb
The utility of faeces as a biomonitoring tool is dependent on having an accurate and precise estimate of Kfb. The overall variability in Kfb was high; the variation of Kfb in the cross-sectional dataset ranged from a CV of 0.46 to 0.70. ICC assessment showed that both short-term intra-individual variability and long-term intra-individual variability contribute significantly to the overall variability in Kfb. The low variation of replicate Cf measurements in the QA sample (a pooled faecal sample with concentrations similar to the real samples; Table S4 and Fig. S5) indicates that the short-term variability is not largely attributable to analytical uncertainty. Rather, short-term variability may be attributable to variability in the digestive process on the scale of hours/meals (because these variables could affect the sorption properties of the lumen contents). This short-term variability could be reduced by pooling samples over longer periods of time. In previous studies with adults, faeces samples were pooled over 3 days, and the inter-individual variability in Kfb was smaller than in this study. For instance, the CV of Kfb for PCB153 was 0.44 for adults (Moser and McLachlan, 2001), while it was 0.70 for infants/toddlers in this study.
The intra-individual variability observed in individuals who provided samples 5 months apart could be due to the short-term variability discussed above. It is also possible that it was partly due to changes occurring over a longer time period. Long-term intra-individual variability was observed in our previous study, where Kfb of PCB153, BDE 47 and p,p′-DDE in a single infant decreased by more than an order of magnitude between the age of 4 months and 12 months. It was hypothesized that the change in diet during weaning changed the properties of faeces and consequently contributed to this decrease (Chen et al., 2016). In the current study, the mean Kfb values of p,p′-DDE declined slightly with age (Fig. S6), but no significant trends with age were found for the other studied chemicals. Meanwhile, the mean Kfb was lower for the weaned group (except for HCB), but the difference was not significant (Fig. S7). There is a good agreement between Kfb for participants that were aged > 8 months in this study and the earlier study (Fig. S8). Variability in Kfb could possibly be reduced by focusing on toddlers with a narrower age range and more clearly defined weaning status.
4.3. Source of inter-individual variability in Kfb
The ICC analysis indicates that some of the variability in Kfb is due to inter-individual differences. A variety of factors could contribute to inter-individual variability in Kfb, including long-term differences in dietary composition that could influence faecal properties (e.g., high fiber vs. low fiber) or differences in gut microflora. This study was not designed to investigate the sources of inter-individual variability in Kfb. However, our results provided some insight into whether microflora composition has a strong influence on Kfb.. Two participants (No. 15 and 23) had taken antibiotics shortly before the sampling time point. Although this likely strongly affected the gut microflora, the Kfb values were similar to both the values from the second sampling of the same participants and to the values of the other participants (with one exception: participant No. 15 had a markedly lower Kfb for p,p′-DDE). These two cases suggest that microflora composition may not strongly influence Kfb.
Previously, Sahlstrom et al. (2015) investigated the feasibility of faeces for biomonitoring of PBDEs in toddlers. Tri-decaBDEs were determined in faeces from 22 toddlers and compared to matched serum samples. They developed linear regression models of ln transformed Cb versus ln transformed Cf. In contrast to this study, the slopes of their ln-ln regressions deviated markedly from 1 for many of the PBDE congeners, suggesting that Cb was not linearly related to Cf. As the detection frequency of PBDE congeners in plasma was low in the current study, we could not confirm these findings, as we were unable to assess the association of Cb and Cf for PBDEs. On the other hand, the variation in Kfb was similar in the two studies. For instance, the coefficient of variation of Kfb values was 0.39 for BDE47 and 0.66 for BDE207 in Sahlstrom et al. (2015).
4.4. Study limitations
The number of participants in this study was relatively small, and in some contexts might be considered a “pilot scale” study. However, the value of this limited sample size must be understood in the context of the ethical and logistical constraints associated with repeated blood collection from infants, and also in the context of the previous research on faeces:blood partitioning of POPs: to our knowledge, no previous study has had > 22 participants, adult or infant, and none has provided repeated evaluations in individuals over time. This study provides insight into the relative importance of intra- and inter-individual variability in Kfb, but it does not identify the factors responsible for these forms of variability. More work is needed to understand this variability, perhaps structured around hypotheses about the relevance of specific factors. As our understanding of this variability grows, there will be a need to test the methodology on more diverse populations and a broader selection of contaminants.
The large proportion of samples with concentrations below the LOQ in plasma was a pronounced limitation in this study. This was partly due to the small plasma volume, which was a consequence of the difficulty in obtaining large volumes of blood from infants and toddlers. This difficulty is indeed a major motivation for this research aimed at developing an alternative biomonitoring method to the analysis of blood, but it also poses a dilemma, constraining the development of alternative biomonitoring methods. Future work could focus on more highly exposed individuals where detection of contaminants in blood may be increased.
Despite these limitations, this work provides insight into the potential of faeces for biomonitoring POPs in infants and toddlers. The presence of strong correlations between Cf and Cb demonstrate the promise of this technique for p,p′-DDE and several PCB congeners. The considerable variability in Kfb indicates that there are limits to the technique as we applied it. However, our analysis of the sources of variability suggests that there are ways to improve the precision and make faeces a more powerful biomonitoring tool.
Supplementary Material
Acknowledgments
The authors would like to thank the parents and the infants for participating in this research, Christine Baduel and Chang He for proof reading. The Queensland Alliance for Environmental Health Science, The University of Queensland gratefully acknowledges the financial support of the Queensland Department of Health. Mueller JF and Toms LML are funded by an ARC Future Fellowship (FF 120100546) and an ARC DECRA (DE12010061), respectively. Karin English is funded by an Australian Government Research Training Program Scholarship.
Appendix A. Supplementary data
Supplementary data to this article can be found online at http://dx.doi.org/10.1016/j.envint.2017.06.019.
Footnotes
Disclaimer
The findings and conclusions in this report are those of the authors and do not necessarily represent the official position of the Centers for Disease Control and Prevention (CDC). Use of trade names is for identification only and does not imply endorsement by the CDC, the Public Health Service, or the US Department of Health and Human Services.
References
- Barker DJ. The developmental origins of adult disease. J Am Coll Nutr. 2004;23(6 Suppl):588S–595S. doi: 10.1080/07315724.2004.10719428. [DOI] [PubMed] [Google Scholar]
- Chen Y, Wang X, Li Y, Toms LM, Gallen M, Hearn L, Aylward LL, McLachlan MS, Sly PD, Mueller JF. Persistent organic pollutants in matched breast milk and infant faeces samples. Chemosphere. 2015;118:309–314. doi: 10.1016/j.chemosphere.2014.09.076. [DOI] [PubMed] [Google Scholar]
- Chen Y, McLachlan MS, Kaserzon S, Wang X, Weijs L, Gallen M, Toms LML, Li Y, Aylward LL, Sly PD, Mueller JF. Monthly variation in faeces:blood concentration ratio of persistent organic pollutants over the first year of life: a case study of one infant. Environ Res. 2016;147:259–268. doi: 10.1016/j.envres.2016.02.017. [DOI] [PubMed] [Google Scholar]
- Eskenazi B, Chevrier J, Rauch SA, Kogut K, Harley KG, Johnson C, Trujillo C, Sjödin A, Bradman A. In utero and childhood polybrominated diphenyl ether (PBDE) exposures and neurodevelopment in the CHAMACOS study. Environ Health Perspect. 2013;121:257–262. doi: 10.1289/ehp.1205597. [DOI] [PMC free article] [PubMed] [Google Scholar]
- Hanson MA, Gluckman PD. Developmental origins of health and disease—global public health implications. Best Pract Res Clin Obstet Gynaecol. 2015;29:24–31. doi: 10.1016/j.bpobgyn.2014.06.007. [DOI] [PubMed] [Google Scholar]
- Herbstman JB, Sjödin A, Kurzon M, Lederman SA, Jones RS, Rauh V, Needham LL, Tang D, Niedzwiecki M, Wang RY, Perera F. Prenatal exposure to PBDEs and neurodevelopment. Environ Health Perspect. 2010;118:712–719. doi: 10.1289/ehp.0901340. [DOI] [PMC free article] [PubMed] [Google Scholar]
- Hung H, Katsoyiannis AA, Brorstrom-Lunden E, Olafsdottir K, Aas W, Breivik K. Temporal trends of persistent organic pollutants (pops) in arctic air: 20 years of monitoring under the Arctic Monitoring and Assessment Programme (AMAP) Environ Pollut. 2016;217:52–61. doi: 10.1016/j.envpol.2016.01.079. [DOI] [PubMed] [Google Scholar]
- IHME. The global burden of disease: generating evidence, guiding policy. 2013 https://www.business.unsw.edu.au/research-site/Documents/2013-Global-Burden-of-Disease-Report.pdf.
- Jones R, Edenfield E, Anderson S, Zhang Y, Sjödin A. Semi-automated extraction and cleanup method for measuring persistent organic pollutants in human serum. Organohalogen Compd. 2012;74:97–98. [Google Scholar]
- Kortenkamp A, Martin O, Faust M, Evans R, Mckinlay R, Orton F, et al. State of the art assessment of endocrine disruptors. Final report. 2011 doi: 10.3109/10408444.2012.712943. http://ec.europa.eu/environment/endocrine/documents/4_SOTA%20EDC%20Final%20Report%20V3%206%20Feb%2012.pdf. [DOI] [PubMed]
- La Merrill M, Emond C, Kim MJ, Antignac JP, Le Bizec B, Clement K, et al. Toxicological function of adipose tissue: focus on persistent organic pollutants. Environ Health Perspect. 2013;121:162–169. doi: 10.1289/ehp.1205485. [DOI] [PMC free article] [PubMed] [Google Scholar]
- Law RJ, Covaci A, Harrad S, Herzke D, Abdallah MAE, Fernie K, et al. Levels and trends of PBDEs and HBCDs in the global environment: status at the end of 2012. Environ Int. 2014;65:147–158. doi: 10.1016/j.envint.2014.01.006. [DOI] [PubMed] [Google Scholar]
- Mikeš O, Čupr P, Kohút L, Krsková A, Černá M. Fifteen years of monitoring of pops in the breast milk, Czech Republic, 1994–2009: trends and factors. Environ Sci Pollut Res. 2012;19:1936–1943. doi: 10.1007/s11356-012-0798-z. [DOI] [PubMed] [Google Scholar]
- Moser GA, McLachlan MS. The influence of dietary concentration on the absorption and excretion of persistent lipophilic organic pollutants in the human intestinal tract. Chemosphere. 2001;45:201–211. doi: 10.1016/s0045-6535(00)00551-8. [DOI] [PubMed] [Google Scholar]
- Needham LL, Barr DB, Calafat AM. Characterizing children’s exposures: beyond NHANES. Neurotoxicology. 2005;26:547–553. doi: 10.1016/j.neuro.2004.09.006. [DOI] [PubMed] [Google Scholar]
- Nickerson K. Environmental contaminants in breast milk. J Midwifery Womens Health. 2006;51:26–34. doi: 10.1016/j.jmwh.2005.09.006. [DOI] [PubMed] [Google Scholar]
- Rohde S, Moser GA, Papke O, McLachlan MS. Clearance of PCDD/Fs via the gastrointestinal tract in occupationally exposed persons. Chemosphere. 1999;38:3397–3410. doi: 10.1016/s0045-6535(98)00551-7. [DOI] [PubMed] [Google Scholar]
- Ryan JJ, Rawn DFK. The brominated flame retardants, PBDEs and HBCD, in Canadian human milk samples collected from 1992 to 2005; concentrations and trends. Environ Int. 2014;70:1–8. doi: 10.1016/j.envint.2014.04.020. [DOI] [PubMed] [Google Scholar]
- Sahlstrom LM, Sellstrom U, de Wit CA, Lignell S, Darnerud PO. Feasibility study of feces for noninvasive biomonitoring of brominated flame retardants in toddlers. Environ Sci Technol. 2015;49:606–615. doi: 10.1021/es504708c. [DOI] [PubMed] [Google Scholar]
- Sharma BM, Bharat GK, Tayal S, Nizzetto L, Cupr P, Larssen T. Environment and human exposure to persistent organic pollutants (pops) in India: a systematic review of recent and historical data. Environ Int. 2014;66:48–64. doi: 10.1016/j.envint.2014.01.022. [DOI] [PubMed] [Google Scholar]
- Sjodin A, Jones RS, Lapeza CR, Focant JF, McGahee EE, 3rd, Patterson DG., Jr Semiautomated high-throughput extraction and cleanup method for the measurement of polybrominated diphenyl ethers, polybrominated biphenyls, and polychlorinated biphenyls in human serum. Anal Chem. 2004;76:1921–1927. doi: 10.1021/ac030381+. [DOI] [PubMed] [Google Scholar]
- To-Figueras J, Barrot C, Sala M, Otero R, Silva M, Ozalla MD, Herrero C, Corbella J, Grimalt J, Sunyer J. Excretion of hexachlorobenzene and metabolites in feces in a highly exposed human population. Environ Health Perspect. 2000;108:595–598. doi: 10.1289/ehp.00108595. [DOI] [PMC free article] [PubMed] [Google Scholar]
- Toms LML, Sjodin A, Harden F, Hobson P, Jones R, Edenfield E, Mueller JF. Serum polybrominated diphenyl ether (PBDE) levels are higher in children (2–5 Years of Age) than in infants and adults. Environ Health Perspectives. 2009;117(9):1461–1465. doi: 10.1289/ehp.0900596. http://dx.doi.org/10.1289/ehp.0900596. [DOI] [PMC free article] [PubMed] [Google Scholar]
- Toms LML, Guerra P, Eljarrat E, Barcelo D, Harden FA, Hobson P, et al. Brominated flame retardants in the Australian population: 1993–2009. Chemosphere. 2012;89:398–403. doi: 10.1016/j.chemosphere.2012.05.053. [DOI] [PubMed] [Google Scholar]
- Vaiserman A. Epidemiologic evidence for association between adverse environmental exposures in early life and epigenetic variation: a potential link to disease susceptibility? Clin Epigenetics. 2015;7:96. doi: 10.1186/s13148-015-0130-0. [DOI] [PMC free article] [PubMed] [Google Scholar]
- Valvi D, Mendez MA, Martinez D, Grimait JO, Torrent M, Sunyer J, Vrijheid M. Prenatal concentrations of polychlorinated biphenyls, DDE, and DDT and overweight in children: a prospective birth cohort study. Environ Health Perspect. 2012;120:451–457. doi: 10.1289/ehp.1103862. [DOI] [PMC free article] [PubMed] [Google Scholar]
Associated Data
This section collects any data citations, data availability statements, or supplementary materials included in this article.