

Abstract
Purpose
Optical coherence tomography angiography (OCT-A) is a non-invasive technology that allows visualization of retinal blood vessels. It is important to determine reproducibility of measurements as low precision can impair its diagnostic capabilities. The purpose of this study is to determine intra-visit and inter-visit reproducibility of optic nerve head (ONH) and macular vessel density measurements with OCT-A.
Patients and Methods
Fifteen healthy volunteers and fourteen glaucoma patients completed two OCT-A (AngioVue; Optovue Inc.) scanning sessions on each of two separate days to assess intra-visit and inter-visit reproducibility. A series of ONH and macula scans were acquired at each session. Vessel density (%), the proportion of vessel area over the total measurement area was calculated. Reproducibility was summarized using coefficients of variation (CV) and intra-class correlation coefficients (ICC) calculated from variance component models.
Results
In healthy eyes, the CV of intra- and inter-visit global vessel density measures ranged from 1.8%–3.2% in ONH scans and 2.5%–9.0% in macular scans. In glaucoma eyes, the CV of intra- and inter-visit global vessel density measures ranged from 2.3%–4.1% in ONH scans and 3.2%–7.9% in macular scans. CVs were lower for global than sectorial measures. Global OCT-A ONH ICC measurements for the retinal nerve fiber layer (RNFL) in healthy eyes were lower (range: 0.65–0.85) than in glaucoma eyes (range: 0.89–0.94). Scan size did not make large differences in measurement CVs.
Conclusions
Reproducibility of OCT-A ONH and macula vessel density measurements is good. Moreover, glaucoma patients have sparser vessel density with poorer reproducibility than healthy subjects.
Keywords: OCT Angiography, OCT-A, reproducibility, vessel density, coefficient of variation, intra-class correlation
INTRODUCTION
Several imaging modalities have been developed for the diagnosis and monitoring of glaucoma and retinal diseases. Spectral domain Optical Coherence Tomography (OCT), used routinely for glaucoma management, provides non-invasive in-vivo imaging and quantitative measures of retinal structures, including the retinal nerve fiber layer (RNFL) and the ganglion cell complex (GCC).1 However, the pathophysiologic mechanism(s) of glaucoma are unclear and continue to be debated.
One proposed theory is that the regulation of blood flow to the optic nerve head (ONH)2 is altered in glaucoma. Several technologies have been employed to assess this hypothesis. Fluorescein angiography enables improved visualization of the retinal capillaries, allowing evaluation of the nearly transparent retinal structural circulation.3 Indocyanine green angiography, a complementary imaging technology, allows for visualization of the choroidal vasculature.4 Both of these imaging methods typically require the use of an intravenous injection of a dye. These injections are associated with a variety of complications.5
OCT Angiography (OCT-A) is a new modality designed to capture the dynamic motion of erythrocytes by taking 2 sequential cross-sectional scans, which are repeated at the same retinal location. It is a noninvasive and dyeless technology for visualizing the vascular structures of the retina using an amplitude-based method and allowing a 3D visualization of the perfused vasculature and microvasculature of the retina.3,4 Moreover, this modality may provide important information on the role retinal vasculature in the pathogenesis of glaucoma.
Before an instrument is introduced into clinical practice, it is important to determine the reproducibility of its measurements because low precision in measurements can impair its diagnostic capabilities. Although there have been a few studies that have reported OCT-A vessel density reproducibility results in glaucoma patients,6–10 they did not compare reproducibility of different fields of view or different measurement areas.
The aim of this study was to assess intra-visit and inter-visit reproducibility of ONH and macular vessel density measures with OCT-A in healthy and glaucoma eyes and to compare the reproducibility of various scan settings and measurement areas.
MATERIALS AND METHODS
Participants
Healthy volunteers and glaucoma patients were recruited from the longitudinal Diagnostic Innovations in Glaucoma Study (DIGS)11–13 at one of their scheduled research visits. Informed consent was obtained from each participant. The University of California San Diego Human Subjects Committee, approved the protocol and the methodology adheres to the tenets of the Declaration of Helsinki.
All subjects had open angles, a best-corrected visual acuity of 20/40 or better, and a refraction of less than 5.0 diopters sphere and 3.0 diopters cylinder. Healthy subjects were defined as individuals without clinical signs of retinal or glaucomatous pathologies based on dilated clinical examination. Glaucoma patients were defined as individuals who have glaucomatous-looking discs on dilated eye exam with at least 2 consecutive, reliable (fixation losses and false negatives ≤33% and ≤15% false positives) and repeatable abnormal visual field (VF) tests using the 24–2 Swedish Interactive Thresholding Algorithm (SITA) with either a Pattern Standard Deviation (PSD) outside the 95% normal limits or a Glaucoma Hemifield Test (GHT) result outside the 99% normal limits.
Optical Coherence Tomography Angiography Vessel Density
The Avanti AngioVue (Optovue Inc.)14,15 OCT imaging system uses the Split-Spectrum Amplitude-Decorrelation Angiography (SSADA) algorithm to capture the dynamic motion (predominantly of erythrocytes) and provides a high-resolution 3D visualization of perfused retinal vasculature.4,8,10,16–21 The AngioVue system automatically analyzes the SSADA image to derive a binary vessel image using a proprietary algorithm. OCT-A does not directly measure blood flow velocity; rather vessels are identified based on the presence or absence of detected motion (i.e., blood flow).
The AngioVue characterizes vascular information at various user-defined retinal layers as a vessel density map and quantitatively as vessel density (%), which is the proportion of vessel area over the total area measured (Figure 1 ONH; Figure 2 Macula). Vessel density is measured by incorporating motion contrast imaging in order to identify vessels as the percentage area occupied by vessels in the total segmented area.10
Figure 1.

4.5 mm × 4.5 mm Optic Nerve Head (ONH) Vessel Density Map of a Healthy (left) and a Glaucoma Eye (right) illustrating the ONH microvasculature circumpapillary measurement ring divided into the 6 Garway-Heath sectors. ONH vessel density is sparser in the glaucoma eye than the healthy eye.
Figure 2.

6mm × 6mm Macular Vessel Density Map of a Healthy (left) and a Glaucoma Eye (right) illustrating the parafoveal measurement area. Macular vessel density is sparser in the glaucoma eye compared to the eye.
Two ONH cube scans, one at 3mm × 3mm and a second at 4.5mm × 4.5mm field of view were acquired. Similarly, macula cube scans at two fields of view were acquired, one at 3mm × 3mm and a second at 6.0mm × 6.0mm. Technicians were instructed to review scans for blinks, eye movements, signal strength, etc. and, when necessary, to retake scans until a good quality scan was acquired.
For this report, we analyzed the reproducibility of the ONH cube scan vessel density at the retinal nerve fiber layer to measure the radial peripapillary capillaries (RPC). Reproducibility at the RNFL was evaluated to measure the RPC, which have been suggested as having a role in the pathophysiology of glaucoma.2,22,23
In addition, we analyzed the reproducibility of the whole image vessel density (wiVD) and vessel density in the circumpapillary retina (cpVD), defined as a 750-μm-wide elliptical annulus extending from the optic disc boundary. The global and six Garway-Heath based sectors24 of the circumpapillary area were included in the analysis. For the macula scans, vessel density measures from the ILM to the posterior boundary of the Inner Plexiform Layer (IPL) were analyzed.
Image quality review was completed on all scans. The Signal Strength Index (SSI) is based entirely on structural OCT intensity signal (and does not rely on the SSADA algorithm), and is a quantitative measure for image quality ranging from 1 (poor) to 100 (good). Scans were included if they had a SSI > 46 and met quality criteria based on the standardized protocol established by the Shiley Eye Institute Imaging Data Evaluation and Analysis (IDEA) Reading Center. Scans that were of poor image quality due to motion, blur, and dense floaters, were excluded.
Optical Coherence Tomography RNFL thickness and ganglion cell complex
All subjects also underwent optic nerve head and macula imaging with the (Avanti; Optovue, Inc., Fremont, CA) Spectral Domain (SD-OCT) system. The optic nerve head (ONH) map protocol was used to obtain RNFL thickness measurements. RNFL measurements were calculated in a 10 pixel-wide band along a circle of 3.45 mm in diameter centered on the ONH. The overall average RNFL thickness was used in this analysis. The macular protocol was used to obtain GCC measurements, which consist of the ganglion cell layer, IPL and RNFL. GCC measurements were measured 0.5mm from the fovea with a circular annulus that excludes the foveal region between 1mm to 3mm in diameter for 6mm × 6mm scans, and between 1mm to 2.5mm for 3mm × 3mm scans (figures 1 and 2). Only good-quality images were included.
Testing Protocol
One randomly selected eye from each participant was scanned twice at both the first and second visit. At each visit, the subject was asked to retract from the chinrest after the first set of scans and then reposition for the second set of scans. The second visit took place approximately 2 weeks after the first visit. OCT-A ONH and macula scans were acquired with 2 different fields of view. SD-OCT macula and ONH scans also were acquired to obtain measurements of RNFL and GCC thickness (Table 1). ONH 3D images were acquired on the first visit for automated delineation of the disc margin, which was then used to outline the ONH margins to calculate subsequent ONH OCT-A measurements.
Table 1.
Optical Coherence Tomography Angiography Image Acquisition and Analysis Protocol
| Optic Nerve Head Cube Scan | Macula Cube Scan | ||||
|---|---|---|---|---|---|
| Image Acquisition | Field of view (mm) | 3.0 × 3.0 | 4.5 × 4.5 | 3.0 × 3.0 | 6.0 × 6.0 |
| Image Analysis | Retinal Layer Measured | RNFL | RNFL | Superficial | Superficial |
| Image Area Measured | Circumpapillary global and 6 sectors | Circumpapillary global and 6 sectors | Parafoveal, foveal, and 4 quadrants | Parafoveal, foveal, and 4 quadrants | |
| Whole image | Whole image | Whole image | Whole image | ||
RNFL: Retinal nerve fiber layer
ILM: Internal limiting membrane
Statistical Analysis
Patients with good quality scans on at least 2 visits were included in the analysis. Intra-visit and inter-visit reproducibility were summarized as coefficients of variation (CV) and intra-class correlation coefficients (ICCs). Variance component models (a type of random effects model)25,26 were used to calculate the intra-visit and inter-visit variability of the healthy and patient groups for each measurement. Models were fitted with the measurement as a response with random effects for patient and visit to account for the inter-patient and between-visit standard deviations (SD) respectively. This effectively decomposed the total variance into 3 parts: a variance component due to visit, a component due to between-subject variability, and a residual variance component due to random errors. The square root of the residual variance (i.e. the remaining variability unexplained by the inter-eye and between-visit variability), or the residual SD was defined to be the intra-visit SD; the variability that would result from a single patient taking multiple tests in the same visit. The inter-visit SD was defined to be the square root of the sum of the intra-visit variance and the between-visit variance. Coefficients of variation (CV) were calculated by dividing the intra-visit and inter-visit SDs by the mean value for each measurement. Confidence intervals for CVs were calculated based on the theoretical distributions of CV statistics proposed by McKay,27,28 while p-values comparing healthy and glaucoma reproducibility were calculated.29 Intra-class Correlation Coefficients (ICC) were also calculated as a summary of the intra-visit and inter-visit variability expressing the proportion of variance attributed to real differences between subjects. The ICCs were calculated as the ratio of between subject variance to the total variance by estimating the proportion of the total SD in measurements explained by actual inter-eye measurement differences (i.e. the inter-eye SDs). Large ICCs (close to 1) indicate that the fluctuations between repeat measurements are relatively small compared within individual eyes.30 Statistical analysis was completed using the R® statistical software.31
RESULTS
Fifteen eyes from 15 healthy individuals, and 14 eyes from 14 patients with glaucoma of varying severity (mild to advanced stage glaucoma) were included (Table 1). The mean age of glaucoma patients included in the study (74 ± 11 years) was higher than that of the normal subjects (67 ± 9 years), but this did not reach statistical significance (p=0.068) (Table 2). The mean global and sectoral ONH vessel density measures were significantly higher in healthy eyes compared to glaucoma eyes (all p < 0.05, Table 3).
Table 2.
Patient Demographics
| Healthy (n=15) |
Glaucoma (n=14) |
p value | |
|---|---|---|---|
|
Gender Male:Female |
1:14 | 9:5 | 0.002 |
| Mean Age | 67 (61 – 73) years | 74 (69 – 79) years | 0.068 |
| SAP Mean Deviation | −0.23 (−0.95 – 0.49) dB | −3.37 (9.66 – −3.09) dB | <0.001 |
Table 3.
4.5mm × 4.5mm Optic Nerve Head Scans: Intra-visit and Inter-visit Reproducibility of Vessel Density*
| Healthy Subjects | Glaucoma Patients | Mean VD p- Values |
Healthy vs. Glaucoma CV p- Values |
||||||||||||||
|---|---|---|---|---|---|---|---|---|---|---|---|---|---|---|---|---|---|
|
| |||||||||||||||||
| Intra-visit | Inter-visit | Intra-visit | Inter-visit | ||||||||||||||
|
| |||||||||||||||||
| Sector | Mean VD of 4 sessions | ICC (95% CI) |
SD (95% CI) |
CV (95% CI) |
ICC (95% CI) |
SD (95% CI) |
CV (95% CI) |
Mean VD of 4 sessions | ICC (95% CI) |
SD (95% CI) |
CV (95% CI) |
ICC (95% CI) |
SD (95% CI) |
CV (95% CI) |
Intra-visit | Inter-visit | |
| wiVD | 54.0 (53.1–54.8) |
0.75 (0.65–0.83) |
1.58 (1.33–1.97) |
2.9 (2.4–3.6) |
0.71 (0.61–0.79) |
1.75 (1.46–2.17) |
3.2 (2.7–4.0) |
45.1 (43.7–46.5) |
0.92 (0.85–0.96) |
1.46 (1.23–1.81) |
3.2 (2.7–4.0) |
0.92 (0.85–0.96) |
1.46 (1.23–1.81) |
3.2 (2.7–4.0) |
<0.001 | 0.476 | 0.990 |
| cpVD | 61.3 (60.4–62.3) |
0.55 (0.45–0.65) |
2.37 (1.99–2.94) |
3.8 (3.2–4.8) |
0.55 (0.45–0.65) |
2.37 (1.99–2.94) |
3.8 (3.2–4.8) |
54.4 (52.6–56.1) |
0.88 (0.80–0.94) |
2.28 (1.91–2.81) |
4.1 (3.5–5.1) |
0.88 (0.80–0.94) |
2.28 (1.91–2.81) |
4.1 (3.5–5.1) |
<0.001 | 0.572 | 0.572 |
|
| |||||||||||||||||
| 6 Circumpapillary Sectors | |||||||||||||||||
| N | 58.7 (57.7–59.3) |
0.42 (0.32–0.52) |
2.97 (2.49–3.68) |
5.0 (4.2–6.2) |
0.42 (0.32–0.52) |
2.97 (2.49–3.68) |
5.0 (4.2–6.2) |
52.1 (49.9–54.4) |
0.85 (0.77–0.91) |
3.24 (2.72–4.00) |
6.2 (5.2–7.6) |
0.84 (0.75–0.90) |
3.42 (2.88–4.23) |
6.5 (5.5–8.1) |
<0.001 | 0.143 | 0.067 |
| IN. | 63.3 (62.0–64.5) |
0.67 (0.57–0.76) |
2.41 (2.02–2.99) |
3.8 (3.1–4.7) |
0.63 (0.52–0.72) |
2.66 (2.23–3.30) |
4.2 (3.5–5.2) |
53.4 (51.5–55.2) |
0.61 (0.51–0.71) |
4.25 (3.57–5.25) |
7.9 (6.6–9.8) |
0.56 (0.45–0.65) |
4.81 (4.04–5.94) |
9.0 (7.5–11.1) |
<0.001 | <0.001 | <0.001 |
| IT | 65.0 (63.7–66.3) |
0.54 (0.44–0.64) |
3.29 (2.76–4.08) |
5.0 (4.2–6.2) |
0.54 (0.44–0.64) |
3.29 (2.76–4.08) |
5.0 (4.2–6.2) |
58.3 (55.2–61.3) |
0.84 (0.76–0.91) |
4.21 (3.54–5.20) |
7.2 (6.0–8.9) |
0.76 (0.67–0.84) |
5.49 (4.61–6.78) |
9.4 (7.9–11.6) |
0.009 | 0.014 | <0.001 |
| ST | 65.3 (64.0–66.5) |
0.80 (0.71–0.87) |
1.95 (1.63–2.42) |
2.9 (2.5–3.7) |
0.74 (0.64–0.82) |
2.31 (1.93–2.87) |
3.5 (2.9–4.4) |
53.6 (51.3–56.0) |
0.82 (0.73–0.89) |
3.50 (2.94–4.32) |
7.2 (6.0–8.9) |
0.72 (0.62–0.81) |
4.63 (3.89–5.72) |
8.6 (7.2–10.6) |
<0.001 | <0.001 | <0.001 |
| SN | 59.4 (57.8–61.0) |
0.79 (0.69–0.86) |
2.49 (2.09–3.10) |
4.2 (3.5–5.2) |
0.62 (0.52–0.72) |
3.75 (3.14–4.66) |
6.3 (5.2–7.8) |
51.9 (50.0–53.8) |
0.78 (0.69–0.86) |
3.39 (2.85–4.19) |
6.3 (5.4–8.0) |
0.78 (0.69–0.86) |
3.39 (2.85–4.19) |
6.5 (5.4–8.0) |
0.003 | 0.003 | 0.807 |
| T | 61.2 (59.7–62.8) |
0.57 (0.47–0.67) |
3.61 (3.03–4.48) |
5.8 (4.9–7.3) |
0.57 (0.47–0.67) |
3.61 (3.03–4.48) |
5.8 (4.9–7.3) |
57.3 (55.6–59.0) |
0.82 (0.73–0.89) |
2.91 (2.44–3.59) |
5.0 (4.2–6.2) |
0.82 (0.73–0.89) |
2.91 (2.44–3.59) |
5.0 (4.2–6.2) |
0.020 | 0.288 | 0.288 |
VD = vessel density; CV = coefficient of variation; ICC = intraclass correlation; SD = standard deviation; CI = confidence interval; wiVD = whole image vessel density; cpVD = circumpapillary vessel density; N = nasal; IN = inferior nasal; IT = inferior temporal; ST = superior temporal; SN = superior nasal; T = temporal
In general, the mean CVs of global ONH vessel density in the RNFL representing the intra-visit and inter-visit reproducibility were less than 5% (Table 3, and Figures 3 and 4). The intra-visit and inter-visit vessel density global CVs measured in the RNFL layer 4.5mm × 4.5mm scans were lower in healthy eyes compared to glaucoma eyes, but did not reach statistical significance (Table 3). The CVs of global vessel density were lower than that of sectorial measures. For most ONH measurements, ICC statistics showed that the test-retest variability was lower than variability between patients. For example, 4.5 mm × 4.5 mm ONH wiVD measurements intra-visit ICC statistics were as high as 0.75 (95% CI: 0.65–0.83) in the healthy cohort and 0.92 (95% CI: 0.85–0.96) in the glaucoma group. Glaucoma patients had higher ICCs than healthy subjects for many global categories, which reflects that there was more between-subject variation than in healthy eyes due to a greater range of measurements with increasing disease severity.
Figure 3.
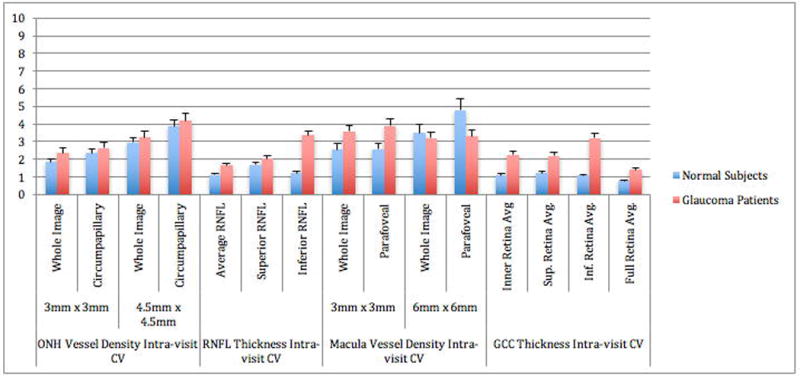
Optical Coherence Tomography Angiography (OCT-A) of the Intra-visit Coefficient of Variation (CV) of all scans. Error bars represent the standard of error of the mean.
Figure 4.

Optical Coherence Tomography Angiography (OCT-A) of the Inter-visit Coefficient of Variation (CV) of all scans. Error bars represent the standard error of the mean.
The intra-visit and inter-visit CVs of the global vessel density measurements in the superficial layer of the macula scans were ≤ 9% (Table 4, Figures 3 and 4). Specifically, macula vessel density, including the 4 quadrants, had intra-visit CV ranging from 1.8–10.1% and inter-visit CV of 2.1–13.0% for healthy subjects. Glaucoma patients had intra-visit CV ranging from 3.5–6.2% and inter-visit CV ranging from 4.2–9.4%. CVs for 3mm × 3mm scans were lower than 6mm × 6mm scans in both healthy subjects and glaucoma patients. ICCs were lower for glaucoma patients than healthy subjects.
Table 4.
4.5mm × 4.5mm Optic Nerve Head Scans: Intra-visit and Inter-visit Reproducibility of Vessel Density*
| Healthy Subjects | Glaucoma Patients | Mean VD p- Values |
Healthy vs. Glaucoma CV p- Values |
||||||||||||||
|---|---|---|---|---|---|---|---|---|---|---|---|---|---|---|---|---|---|
|
| |||||||||||||||||
| Intra-visit | Inter-visit | Intra-visit | Inter-visit | ||||||||||||||
|
| |||||||||||||||||
| Sector | Mean VD of 4 sessions | ICC (95% CI) |
SD (95% CI) |
CV (95% CI) |
ICC (95% CI) |
SD (95% CI) |
CV (95% CI) |
Mean VD of 4 sessions | ICC (95% CI) |
SD (95% CI) |
CV (95% CI) |
ICC (95% CI) |
SD (95% CI) |
CV (95% CI) |
Intra-visit | Inter-visit | |
| wiVD | 49.3 (47.8–50.8) |
0.85 (0.76–0.91) |
1.61 (1.31–2.08) |
3.2 (2.6–4.2) |
0.61 (0.51–0.71) |
3.05 (2.49–3.95) |
6.1 (5.0–8.0) |
43.6 (42.0–45.2) |
0.93 (0.86–0.97) |
1.39 (1.15–1.76) |
3.2 (2.6–4.0) |
0.89 (0.81–0.94) |
1.86 (1.54–2.35) |
4.2 (3.5–5.3) |
0.022 | 0.897 | 0.027 |
| pfVD | 52.0 (50.3–53.7) |
0.46 (0.36–0.57) |
2.95 (2.40–3.81) |
5.6 (4.6–7.3) |
0.25 (0.17–0.35) |
4.70 (3.83–6.08) |
9.0 (7.3–11.7) |
47.1 (45.4–48.8) |
0.91 (0.84–0.96) |
1.55 (1.28–1.96) |
3.3 (2.7–4.1) |
0.75 (0.66–0.83) |
2.94 (2.43–3.71) |
6.2 (5.1–7.8) |
0.033 | 0.002 | 0.029 |
|
| |||||||||||||||||
| 4 Parafoveal Quadrants | |||||||||||||||||
| T | 52.9 (50.7–55.1) |
0.00 (0.00–0.03) |
4.99 (4.07–6.46) |
9.4 (7.6–12.2) |
0.00 (0.00–0.03) |
6.75 (5.50–8.73) |
12.7 (10.3–16.5) |
47.4 (45.6–49.1) |
0.82 (0.74–0.89) |
2.34 (1.94–2.96) |
4.9 (4.0–6.2) |
0.67 (0.57–0.76) |
3.60 (2.98–4.54) |
7.5 (6.2–9.6) |
0.006 | <0.001 | 0.003 |
| S | 52.0 (50.0–54.0) |
0.53 (0.42–0.63) |
4.21 (3.44–5.45) |
8.1 (6.6–10.5) |
0.53 (0.42–0.63) |
4.21 (3.44–5.45) |
8.1 (6.6–10.5) |
47.0 (45.2–48.9) |
0.83 (0.75–0.90) |
2.49 (2.06–3.14) |
5.2 (4.3–6.6) |
0.73 (0.63–0.81) |
3.43 (2.84–4.33) |
7.2 (6.0–9.2) |
0.110 | 0.013 | 0.504 |
| N | 51.8 (49.9–53.8) |
0.19 (0.12–0.29) |
3.59 (2.92–4.64) |
6.9 (5.6–8.9) |
0.08 (0.03–0.15) |
5.84 (4.76–7.56) |
11.2 (9.1–14.6) |
47.4 (45.5–49.2) |
0.81 (0.72–0.88) |
2.27 (1.88–2.87) |
4.8 (3.9–6.0) |
0.58 (0.47–0.67) |
4.03 (3.33–5.09) |
8.5 (7.0–10.7) |
0.033 | 0.030 | 0.091 |
| I | 51.2 (49.4–53.1) |
0.60 (0.49–0.69) |
3.43 (2.80–4.44) |
6.6 (5.4–8.6) |
0.51 (0.41–0.61) |
4.07 (3.32–5.27) |
7.9 (6.4–10.3) |
46.6 (44.8–48.4) |
0.86 (0.78–0.92) |
2.35 (1.95–2.97) |
5.0 (4.1–6.3) |
0.83 (0.74–0.90) |
2.64 (2.19–3.34) |
5.6 (4.6–7.1) |
0.058 | 0.086 | 0.043 |
|
| |||||||||||||||||
| Fovea | 32.1 (30.1–34.1) |
0.70 (0.60–0.78) |
3.26 (2.66–4.22) |
10.1 (8.2–13.1) |
0.54 (0.44–0.64) |
4.51 (3.68–5.84) |
14.0 (11.4–18.3) |
30.6 (28.6–32.5) |
0.92 (0.85–0.96) |
1.90 (1.57–2.40) |
6.2 (5.1–7.8) |
0.90 (0.82–0.95) |
2.22 (1.84–2.81) |
7.2 (6.0–9.2) |
0.675 | 0.005 | <0.001 |
VD = vessel density; CV = coefficient of variation; ICC = intraclass correlation; SD = standard deviation; CI = confidence interval; wiVD = whole image vessel density; pfVD = parafoveal vessel density; T = temporal; S = superior; N = nasal; I = inferior
For comparison, we also evaluated the intra-visit and inter-visit reproducibility of SD- OCT RNFL thickness and GCC thickness in these same eyes (Figures 3 and 4). The intra-visit and inter-visit CV for both RNFL thickness and ganglion cell complex were low; CVs of the global RNFL and GCC thickness were ≤4%, and the superior and inferior RNFL and GCC ≤ 3.5% in both healthy and glaucoma eyes. Glaucoma eyes had slightly worse RNFL and GCC reproducibility than healthy eyes (p <0.001). CVs for SD-OCT measurements were slightly lower compared to CVs for OCT-A measurements. For example, for 3mm × 3mm scans in healthy subjects, the intra-visit CV for average RNFL thickness was 1.1%, whereas the CV for wiVD was 1.8% (p < 0.001), while inter-visit CV for average RNFL thickness was 1.5% and wiVD CV was 2.7% (p < 0.001).
DISCUSSION
Assessment of reproducibility is critical for determining whether OCT-A instruments provide consistent measurements for clinical management and reproducibility is particularly important for determining whether OCT-A vessel density measures will be effective for detecting change over time.32 In general, the OCT AngioVue intra-visit and inter-visit reproducibility of ONH and macula vessel density measures were good; CVs were ≤5% and 9%, respectively for most global parameters measured, regardless of field of view. Furthermore, the reproducibility of the global OCT-A vessel density measures was only slightly worse than the reproducibility of the standard SD-OCT RNFL and GCC measures that are the standard of care for clinical management of glaucoma patients. In addition, whole image VF ICC statistics were high for ONH and macula scans (all ICCs ≥ 71%), especially in the glaucoma group (all ICCs ≥ 89%). This is encouraging as this means that most of the variation in vessel density measurements is due to differences among patients rather than test-retest variability.
We found that 6mm × 6mm scans of the macula had worse reproducibility in healthy patients than in glaucoma patients, particularly in the case of inter-visit reproducibility. On further investigation, 2 of the oldest healthy subjects were found to have scans with poorer reproducibility, which were attributed to floaters that were not dense enough to be excluded from the analysis based on assessment by 2 graders; the floater did cover some of the smaller vessels during one of the two visits. On repeating the analysis without those scans, the CV dropped to 3.4% for macular wiVD and 5.8% for parafoveal vascular density (from 6.1% and 9.0%, respectively). The 3mm × 3mm macula scans measured a smaller area, which tended to miss these floaters.
The intra-visit and inter-visit reproducibility of OCT-A measures for vessel density in the current study were similar to those from other studies; most had CV <5% in healthy eyes.7–10,33 None of the other studies however, compared vessel density reproducibility in both the whole image and circumpapillary region in more than one field of view. Our study did not show large, systematic differences in reproducibility between the scan sizes used in ONH or the macula. Larger longitudinal studies are needed to assess the clinical utility of monitoring vessel density in glaucoma patients, as well as which specific scans should be acquired and which analyses should be implemented.
This study was unique as it compared the reproducibility of OCT-A parameters to standard SD-OCT RNFL and GCC measures in the same eyes. Several prior studies have, however, directly compared the reproducibility of OCT-A with other blood flow instruments and found that intra-visit and inter-visit its reproducibility was generally much better than those of Laser Doppler Flowmetry and Laser Speckle Flowgraphy (CV range: 7–84%).7–9,34–38 Our finding that OCT-A vessel density measurements in glaucoma patients tended to be less reproducible than in healthy subjects is consistent with other studies showing that confocal scanning laser ophthalmoscopy, scanning laser polarimetry, and spectral domain OCT measurements were more reproducible in healthy eyes compared to glaucomatous eyes.7–9 Our estimates of the intra-visit and inter-visit reproducibility estimates for RNFL and GCC thickness measurements in the current study were also generally consistent with other studies.25,32,39–41 Moreover, the CVs for OCT-A vessel density measures were similar to those of SD-OCT RNFL and GCC thickness.
The CV and ICC included in our study are both commonly used metrics of reproducibility. Most studies tend to report either CV or ICC. We chose to report both to more completely characterize the reproducibility of OCT-A vessel density measurements. However, it is worth noting the advantages and limitations with both metrics. The CV is a variability estimate scaled for the magnitude of the measurement. The CV is dependent on mean values so that mean values close to zero often have very large CVs. The CVs that are based on very small means should be interpreted with caution. On the other hand, ICC essentially measures the ability of a measurement to distinguish between different subjects (i.e. how much does the measurement vary as a result of true differences in measurements among subjects rather than as a result of test variability). Given that in this study the CV indicates better reproducibility in normal eyes compared with glaucoma eyes, it may be surprising that the ICC measures are higher in the glaucoma eyes than the healthy eyes. Although, ICC is commonly regarded as a surrogate measurement for reproducibility, one important caveat is that the distribution of the measurements influences the ICC value; wider distributions of measurements have higher ICC values because the ICC is the ratio of the between subjects variability to the total variance.30,42 Therefore, subjects with a larger range of values (e.g. glaucoma patients with a wide range of disease severity and wide distribution of vessel density values) have larger ICCs than subjects with a narrower distribution of values (e.g. vessel density measurements in healthy eyes), even if the reproducibility is high in both groups. Therefore, comparisons of ICCs between groups, such as healthy and glaucoma eyes may not be meaningful.
There are several limitations to the current study. First, the reproducibility estimates may represent a worst-case scenario as the instrument did not yet have the ability to register baseline and follow-up scans. It is likely that registration between scans will improve the reproducibility of the vessel density measures, particularly for the sectorial measurements. Second, it is possible that there were some false detection of vessels. Some vessels may have been missed and/or that some noise may have been detected and represented as a vessel when none exist. Third, eye movements caused shearing of images from the scans, which also duplicated parts of the images. The more severe the eye movement, the more sheared the images; this then lead to increased vascular density. The image acquisition protocol was designed to mimic how images are acquired in clinical practice, as well as to assess the reproducibility of images that would be utilized in clinical decision-making. It is standard clinical practice and the recommendation of OCT manufacturers for technicians to assess the quality of acquired images, and retake images until a good quality scan is obtained. As poor-quality images should not be used in clinical management decisions, particularly for determining whether there is change over time, it was important to exclude these scans from the reproducibility calculations. Despite this exclusion, the vast majority of participants had complete data with at least one good quality scan available at each scanning session. Fourth, our sample size was limited. However, sample sizes of studies that assess inter-visit reproducibility are generally smaller than in the current study.43–48 Uncertainty in our estimates due to sample size is reflected in 95% confidence intervals provided for all our estimates. Regardless of sample size, these intervals can be used to judge the precision of the estimates; larger samples yield smaller confidence intervals, but should not theoretically change the estimates. Lastly, glaucoma patients were older than the normal subjects although this age difference was not statistically significant (p = 0.068). We did not find evidence in our study that estimates of variability were associated with increasing age with the 4.5mm × 4.5mm ONH vessel density scans, macular vessel density scans, as well as RNFL and GCC thickness measures.
OCT-A is a new technology and there are currently no guidelines as to which specific scan protocols, and fields of view or image area to analyze are best for clinical management of glaucoma. Reproducibility of the measurements is one important consideration for determining whether OCT-A has clinical utility in the management of glaucoma. For this reason, we assessed the intra-visit and inter-visit reproducibility of two fields of view and several image analysis options. In general, reproducibility was comparable to RNFL and GCC thickness scans, regardless of the field of view. Other considerations, such as the dynamic range, diagnostic accuracy and ability to detect change should also be evaluated before determining whether specific OCT-A scan protocols and analysis options have clinical utility for glaucoma management and whether they provide important information on glaucomatous retinal vascular damage and change. Moreover, longitudinal studies with OCT-A are needed to evaluate its potential role in glaucoma management.
Supplementary Material
Acknowledgments
We thank Qienyuan Zhou, PhD for technical assistance.
Funding/Support:
This work was supported by the following NIH grants: Vision Research Core Grant P30EY022589, EY11008, EY027510 and EY019869, and an unrestricted grant from Research to Prevent Blindness (New York, N.Y.). In addition, participant retention incentive grants were given in the form of glaucoma medications at no cost from Alcon Laboratories Inc., Allergan, Pfizer Inc., Santen Inc.
Abbreviations and Acronyms
- SD-OCT
spectral domain optical coherence tomography
- OCT-A
optical coherence tomography angiography
- DIGS
Diagnostics Innovations in Glaucoma Study
- RNFL
retinal nerve fiber layer
- GCC
ganglion cell complex
- ONH
optic nerve head
- IV
intravenous
- SAP
standard automated perimetry
- SITA
Swedish interactive thresholding algorithm
- PSD
pattern standard deviation
- GHT
glaucoma hemifield test
- SSADA
split-spectrum amplitude-decorrelation algorithm
- RPC
radial peripapillary capillaries
- wiVD
whole image vessel density
- cpVD
circumpapillary vessel density
- IPL
inner plexiform layer
- IDEA
Imaging Data Evaluation and Analysis
- CV
coefficient of variation
- ICC
intra-class correlation
- SD
standard deviation
Footnotes
- Patricia Isabel C. Manalastas: none
- Linda Zangwill: F: National Eye Institute, Carl Zeiss Meditec Inc., Heidelberg Engineering GmbH, Optovue Inc., Topcon Medical Systems Inc.
- Luke J. Saunders: none
- Kaweh Mansouri: C: Sensimed AG, Switzerland; R: Topcon Inc., Japan, Sensimed AG, Switzerland
- Akram Belghith: none
- Min Hee Suh: none
- Adeleh Yarmohammadi: none
- Rafaella C. Penteado: none
- Takuhei Shoji: R: Pfizer, Senju, Alcon, Santen, Kowa, Otsuka
- Tadamichi Akagi: R: Santen, Pfizer, Senju, Alcon, Kowa
- Robert N. Weinreb: C: Alcon, Allergan, Bausch & Lomb, Carl Zeiss Meditec, Sensimed, Topcon; F: Heidelberg Engineering, Carl Zeiss Meditec, Genentech, Optovue, Topcon
References
- 1.Raza AS, Zhang X, De Moraes CG, et al. Improving glaucoma detection using spatially correspondent clusters of damage and by combining standard automated perimetry and optical coherence tomography. Investigative ophthalmology & visual science. 2014;55(1):612–24. doi: 10.1167/iovs.13-12351. [DOI] [PMC free article] [PubMed] [Google Scholar]
- 2.Flammer J, Orgul S. Optic nerve blood-flow abnormalities in glaucoma. Prog Retin Eye Res. 1998;17(2):267–89. doi: 10.1016/s1350-9462(97)00006-2. [DOI] [PubMed] [Google Scholar]
- 3.Spaide RF, Klancnik JM, Jr, Cooney MJ. Retinal vascular layers imaged by fluorescein angiography and optical coherence tomography angiography. JAMA Ophthalmol. 2015;133(1):45–50. doi: 10.1001/jamaophthalmol.2014.3616. [DOI] [PubMed] [Google Scholar]
- 4.Jia Y, Bailey ST, Hwang TS, et al. Quantitative optical coherence tomography angiography of vascular abnormalities in the living human eye. Proc Natl Acad Sci U S A. 2015;112(18):E2395–402. doi: 10.1073/pnas.1500185112. [DOI] [PMC free article] [PubMed] [Google Scholar]
- 5.Lipson BK, Yannuzzi LA. Complications of intravenous fluorescein injections. Int Ophthalmol Clin. 1989;29(3):200–5. doi: 10.1097/00004397-198902930-00011. [DOI] [PubMed] [Google Scholar]
- 6.Rao HL, Kadambi SV, Weinreb RN, et al. Diagnostic ability of peripapillary vessel density measurements of optical coherence tomography angiography in primary open-angle and angle-closure glaucoma. Br J Ophthalmol. 2016 doi: 10.1136/bjophthalmol-2016-309377. [DOI] [PubMed] [Google Scholar]
- 7.Wang XL, Jiang CH, Ko T, et al. Correlation between optic disc perfusion and glaucomatous severity in patients with open-angle glaucoma: an optical coherence tomography angiography study. Graef Arch Clin Exp. 2015;253(9):1557–64. doi: 10.1007/s00417-015-3095-y. [DOI] [PubMed] [Google Scholar]
- 8.Jia Y, Wei E, Wang X, et al. Optical coherence tomography angiography of optic disc perfusion in glaucoma. Ophthalmology. 2014;121(7):1322–32. doi: 10.1016/j.ophtha.2014.01.021. [DOI] [PMC free article] [PubMed] [Google Scholar]
- 9.Liu L, Jia Y, Takusagawa HL, et al. Optical Coherence Tomography Angiography of the Peripapillary Retina in Glaucoma. JAMA Ophthalmol. 2015 doi: 10.1001/jamaophthalmol.2015.2225. [DOI] [PMC free article] [PubMed] [Google Scholar]
- 10.Jia Y, Morrison JC, Tokayer J, et al. Quantitative OCT angiography of optic nerve head blood flow. Biomed Opt Express. 2012;3(12):3127–37. doi: 10.1364/BOE.3.003127. [DOI] [PMC free article] [PubMed] [Google Scholar]
- 11.Sample PA, Girkin CA, Zangwill LM, et al. The African Descent and Glaucoma Evaluation Study (ADAGES): design and baseline data. Arch Ophthalmol. 2009;127(9):1136–45. doi: 10.1001/archophthalmol.2009.187. [DOI] [PMC free article] [PubMed] [Google Scholar]
- 12.Medeiros FA, Zangwill LM, Bowd C, et al. Comparison of the GDx VCC scanning laser polarimeter, HRT II confocal scanning laser ophthalmoscope, and stratus OCT optical coherence tomograph for the detection of glaucoma. Arch Ophthalmol. 2004;122(6):827–37. doi: 10.1001/archopht.122.6.827. [DOI] [PubMed] [Google Scholar]
- 13.Sample PA, Medeiros FA, Racette L, et al. Identifying glaucomatous vision loss with visual-function-specific perimetry in the diagnostic innovations in glaucoma study. Invest Ophthalmol Vis Sci. 2006;47(8):3381–9. doi: 10.1167/iovs.05-1546. [DOI] [PubMed] [Google Scholar]
- 14.Liu L, Jia Y, Takusagawa HL, et al. Optical Coherence Tomography Angiography of the Peripapillary Retina in Glaucoma. JAMA ophthalmology. 2015;133(9):1045–52. doi: 10.1001/jamaophthalmol.2015.2225. [DOI] [PMC free article] [PubMed] [Google Scholar]
- 15.Schuman JS. Measuring Blood Flow: So What? JAMA ophthalmology. 2015;133(9):1052–3. doi: 10.1001/jamaophthalmol.2015.2287. [DOI] [PMC free article] [PubMed] [Google Scholar]
- 16.Yarmohammadi A, Zangwill LM, Diniz-Filho A, et al. Peripapillary and Macular Vessel Density in Patients with Glaucoma and Single-Hemifield Visual Field Defect. Ophthalmology. 2017;124(5):709–19. doi: 10.1016/j.ophtha.2017.01.004. [DOI] [PMC free article] [PubMed] [Google Scholar]
- 17.Yarmohammadi A, Zangwill LM, Diniz-Filho A, et al. Optical Coherence Tomography Angiography Vessel Density in Healthy, Glaucoma Suspect, and Glaucoma Eyes. Invest Ophthalmol Vis Sci. 2016;57(9):OCT451–9. doi: 10.1167/iovs.15-18944. [DOI] [PMC free article] [PubMed] [Google Scholar]
- 18.Yarmohammadi A, Zangwill LM, Diniz-Filho A, et al. Relationship between Optical Coherence Tomography Angiography Vessel Density and Severity of Visual Field Loss in Glaucoma. Ophthalmology. 2016;123(12):2498–508. doi: 10.1016/j.ophtha.2016.08.041. [DOI] [PMC free article] [PubMed] [Google Scholar]
- 19.Suh MH, Zangwill LM, Manalastas PI, et al. Deep Retinal Layer Microvasculature Dropout Detected by the Optical Coherence Tomography Angiography in Glaucoma. Ophthalmology. 2016;123(12):2509–18. doi: 10.1016/j.ophtha.2016.09.002. [DOI] [PMC free article] [PubMed] [Google Scholar]
- 20.Suh MH, Zangwill LM, Manalastas PI, et al. Optical Coherence Tomography Angiography Vessel Density in Glaucomatous Eyes with Focal Lamina Cribrosa Defects. Ophthalmology. 2016;123(11):2309–17. doi: 10.1016/j.ophtha.2016.07.023. [DOI] [PMC free article] [PubMed] [Google Scholar]
- 21.Jia Y, Tan O, Tokayer J, et al. Split-spectrum amplitude-decorrelation angiography with optical coherence tomography. Opt Express. 2012;20(4):4710–25. doi: 10.1364/OE.20.004710. [DOI] [PMC free article] [PubMed] [Google Scholar]
- 22.Kornzweig AL, Eliasoph I, Feldstein M. Selective atrophy of the radial peripapillary capillaries in chronic glaucoma. Arch Ophthalmol. 1968;80(6):696–702. doi: 10.1001/archopht.1968.00980050698002. [DOI] [PubMed] [Google Scholar]
- 23.Weinreb RN. Ocular blood flow in glaucoma. Can J Ophthalmol. 2008;43(3):281–3. doi: 10.3129/i08-058. [DOI] [PubMed] [Google Scholar]
- 24.Garway-Heath DF, Poinoosawmy D, Fitzke FW, et al. Mapping the visual field to the optic disc in normal tension glaucoma eyes. Ophthalmology. 2000;107(10):1809–15. doi: 10.1016/s0161-6420(00)00284-0. [DOI] [PubMed] [Google Scholar]
- 25.Blumenthal EZ, Williams JM, Weinreb RN, et al. Reproducibility of nerve fiber layer thickness measurements by use of optical coherence tomography. Ophthalmology. 2000;107(12):2278–82. doi: 10.1016/s0161-6420(00)00341-9. [DOI] [PubMed] [Google Scholar]
- 26.Paunescu LA, Schuman JS, Price LL, et al. Reproducibility of nerve fiber thickness, macular thickness, and optic nerve head measurements using StratusOCT. Invest Ophthalmol Vis Sci. 2004;45(6):1716–24. doi: 10.1167/iovs.03-0514. [DOI] [PMC free article] [PubMed] [Google Scholar]
- 27.Mckay AT. Distribution of the coefficient of variation and the extended “t” distribution. Journal of the Royal Statistical Society. 1932;95(4):695–98. [Google Scholar]
- 28.Ng KC. Performance of three methods of interval estimation of the coefficient of variation. InterStat. 2006 [Google Scholar]
- 29.Sokal RR, Braumann CA. Significance tests for coefficients of variation and variability profiles. Systematic Zoology. 1980 Mar;29(1):50–66. [Google Scholar]
- 30.Weir JP. Quantifying test-retest reliability using the intraclass correlation coefficient and the SEM. J Strength Cond Res. 2005;19(1):231–40. doi: 10.1519/15184.1. [DOI] [PubMed] [Google Scholar]
- 31.R Core Team. R: A language and environment for statistical computing. R Foundation for Statistical Computing; Vienna, Austria: 2015. URL http://www.r-project.org/ [Google Scholar]
- 32.Mwanza JC, Chang RT, Budenz DL, et al. Reproducibility of peripapillary retinal nerve fiber layer thickness and optic nerve head parameters measured with cirrus HD-OCT in glaucomatous eyes. Invest Ophthalmol Vis Sci. 2010;51(11):5724–30. doi: 10.1167/iovs.10-5222. [DOI] [PMC free article] [PubMed] [Google Scholar]
- 33.Hollo G. Intrasession and Between-Visit Variability of Sector Peripapillary Angioflow Vessel Density Values Measured with the Angiovue Optical Coherence Tomograph in Different Retinal Layers in Ocular Hypertension and Glaucoma. PLoS One. 2016;11(8):e0161631. doi: 10.1371/journal.pone.0161631. [DOI] [PMC free article] [PubMed] [Google Scholar]
- 34.Wang X, Jia Y, Spain R, et al. Optical coherence tomography angiography of optic nerve head and parafovea in multiple sclerosis. The British journal of ophthalmology. 2014;98(10):1368–73. doi: 10.1136/bjophthalmol-2013-304547. [DOI] [PMC free article] [PubMed] [Google Scholar]
- 35.Joos KM, Pillunat LE, Knighton RW, et al. Reproducibility of laser Doppler flowmetry in the human optic nerve head. J Glaucoma. 1997;6(4):212–6. [PubMed] [Google Scholar]
- 36.Jonescu-Cuypers CP, Harris A, Bartz-Schmidt KU, et al. Reproducibility of circadian retinal and optic nerve head blood flow measurements by Heidelberg retina flowmetry. Br J Ophthalmol. 2004;88(3):348–53. doi: 10.1136/bjo.2003.024885. [DOI] [PMC free article] [PubMed] [Google Scholar]
- 37.Yaoeda K, Shirakashi M, Funaki S, et al. Measurement of microcirculation in optic nerve head by laser speckle flowgraphy in normal volunteers. Am J Ophthalmol. 2000;130(5):606–10. doi: 10.1016/s0002-9394(00)00723-6. [DOI] [PubMed] [Google Scholar]
- 38.Yaoeda K, Shirakashi M, Funaki S, et al. Measurement of microcirculation in the optic nerve head by laser speckle flowgraphy and scanning laser Doppler flowmetry. Am J Ophthalmol. 2000;129(6):734–9. doi: 10.1016/s0002-9394(00)00382-2. [DOI] [PubMed] [Google Scholar]
- 39.Budenz DL, Fredette MJ, Feuer WJ, et al. Reproducibility of peripapillary retinal nerve fiber thickness measurements with stratus OCT in glaucomatous eyes. Ophthalmology. 2008;115(4):661–66 e4. doi: 10.1016/j.ophtha.2007.05.035. [DOI] [PubMed] [Google Scholar]
- 40.Menke MN, Knecht P, Sturm V, et al. Reproducibility of nerve fiber layer thickness measurements using 3D fourier-domain OCT. Invest Ophthalmol Vis Sci. 2008;49(12):5386–91. doi: 10.1167/iovs.07-1435. [DOI] [PubMed] [Google Scholar]
- 41.Mansouri K, Medeiros FA, Tatham AJ, et al. Evaluation of retinal and choroidal thickness by swept-source optical coherence tomography: repeatability and assessment of artifacts. American journal of ophthalmology. 2014;157(5):1022–32. doi: 10.1016/j.ajo.2014.02.008. [DOI] [PMC free article] [PubMed] [Google Scholar]
- 42.Vaz S, Falkmer T, Passmore AE, et al. The case for using the repeatability coefficient when calculating test-retest reliability. PloS one. 2013;8(9):e73990. doi: 10.1371/journal.pone.0073990. [DOI] [PMC free article] [PubMed] [Google Scholar]
- 43.Massin P, Vicaut E, Haouchine B, et al. Reproducibility of retinal mapping using optical coherence tomography. Arch Ophthalmol. 2001;119(8):1135–42. doi: 10.1001/archopht.119.8.1135. [DOI] [PubMed] [Google Scholar]
- 44.Ikuno Y, Maruko I, Yasuno Y, et al. Reproducibility of retinal and choroidal thickness measurements in enhanced depth imaging and high-penetration optical coherence tomography. Invest Ophthalmol Vis Sci. 2011;52(8):5536–40. doi: 10.1167/iovs.10-6811. [DOI] [PubMed] [Google Scholar]
- 45.Pearce JG, Maddess T. Inter-visit Test-Retest Variability of OCT in Glaucoma. Optom Vis Sci. 2017;94(3):404–10. doi: 10.1097/OPX.0000000000001022. [DOI] [PubMed] [Google Scholar]
- 46.You Q, Freeman WR, Weinreb RN, et al. Reproducibility of Vessel Density Measurement with Optical Coherence Tomography Angiography in Eyes with and without Retinopathy. Retina. 2016 doi: 10.1097/IAE.0000000000001407. [DOI] [PMC free article] [PubMed] [Google Scholar]
- 47.Chen CL, Bojikian KD, Xin C, et al. Repeatability and reproducibility of optic nerve head perfusion measurements using optical coherence tomography angiography. J Biomed Opt. 2016;21(6):65002. doi: 10.1117/1.JBO.21.6.065002. [DOI] [PMC free article] [PubMed] [Google Scholar]
- 48.Harada Y, Akita T, Takenaka J, et al. Reproducibility of optic disk evaluation in supine subjects with a Heidelberg Retina Tomograph II laser tomographic scanner. Clin Ophthalmol. 2016;10:1617–22. doi: 10.2147/OPTH.S111250. [DOI] [PMC free article] [PubMed] [Google Scholar]
Associated Data
This section collects any data citations, data availability statements, or supplementary materials included in this article.