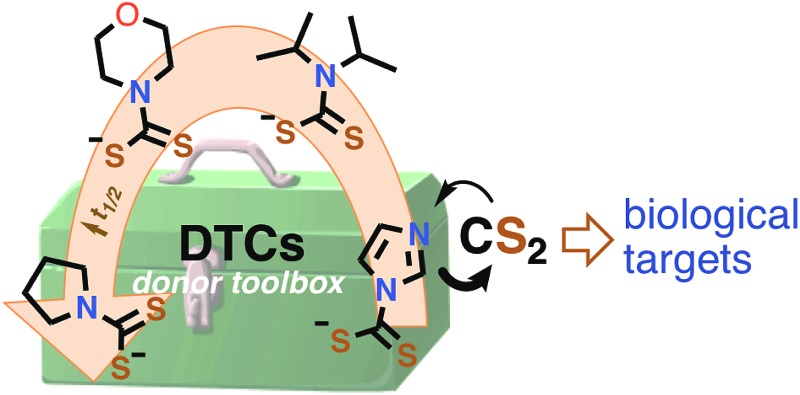
 Described are kinetics studies of different dithiocarbamates that release CS2, a potential small molecule bioregulator, under physiologically relevant conditions.
Abstract
We describe the kinetics of the formation and decay of a series of dithiocarbamates under physiological conditions. The goal is to provide a toolbox of compounds that release CS2 by well-defined kinetics in such media. Carbon disulfide is a known environmental toxin, but there is fragmentary evidence suggesting that CS2 may have bioregulatory and/or therapeutic roles in mammalian biology. Further investigation of such roles will require methodologies for controlled delivery of this bioactive small molecule to specific targets. Reported here are mechanistic and computational studies of CS2 release from a series of dithiocarbamate anions (DTCs), where R2N represents several different secondary amido groups. The various DTCs under physiologically relevant conditions show a tremendous range of reactivities toward CS2 dissociation with decay lifetimes ranging from ∼2 s for imidazolidyldithiocarbamate (ImDTC–) to ∼300 s for diisopropyldithiocarbamate (DIDTC–) to >24 h for pyrrolidinyldithiocarbamate (PDTC–) in pH 7.4 phosphate buffer solution at 37 °C. Thus, by making the correct choice of these tools, one can adjust the flux of CS2 in a biological experiment, while the least reactive DTCs could serve as controls for evaluating the potential effects of the dithiocarbamate functionality itself. Kinetics studies and density functional calculations are used to probe the mechanism of DTC– decay. In each case, the rate of CS2 dissociation is acid dependent; however, the DFT studies point to a mechanistic pathway for ImDTC– that is different than those for DIDTC–. The role of general acid catalysis is also briefly probed.
Introduction
Small molecule bioregulators (SMBs) are physiological signalling agents with specific biological targets, and their cellular chemical biology continues to draw considerable interest. Three key SMBs nitric oxide (NO), carbon monoxide (CO) and hydrogen sulfide (H2S) (sometimes called “gasotransmitters”) have been identified and a number of specific physiological functions attributed to these and to various derivatives such as nitroxyl (HNO), peroxynitrite (ONOO–) and persulfides (R-SS–).1–9 If one were to search for an unidentified mammalian SMB, a good starting point would be the common properties of these known SMBs. Each is relatively nonpolar but has partial solubility in aqueous and lipid systems, thus readily diffuses in physiological media.10 Furthermore, each was initially considered to be an environmental toxin, yet is now known to be formed endogenously in mammalians systems.
In these contexts, carbon disulfide (CS2) is a small, nonpolar, readily diffusible molecule for which the biological literature has largely focused on its toxicity.11,12 However, there is some evidence that CS2 is formed endogenously by mammals and/or by the associated gut microbiome.13–15 Indeed, CS2-specific hydrolases that facilitate the conversion to H2S and CO2 have been identified in certain bacteria.16,17 Such properties have led this laboratory to pose the question is “carbon disulfide. Just toxic or also bioregulatory and/or therapeutic?”.18 At the current stage of development, such considerations are largely speculative, and this speculation needs to be followed by objective evaluation of potential molecular targets where reaction with CS2 might lead to cellular signalling or some other favorable result. Advances in understanding the biological signalling and therapeutic roles of the known SMBs have depended in part upon the accessibility of molecular species that provide controlled release under physiological conditions.19–24 In complement to earlier studies of CS2 release by photosensitized decomposition of 1,1-dithiooxalate,25 the present study is an investigation of thermally activated CS2 donors with the goal of providing a toolbox of compounds with well-defined release rates that can be used to evaluate potential signalling and/or therapeutic properties of CS2. In this context, we note the recent reports by Powell et al. 26 and by Steiger et al. 27–29 of donors for carbonyl sulfide (OCS), which serves as a precursor for the release of H2S, a known SMB in human physiology.
For examples, amines are logical targets for reaction with CS2, and, conversely, dithiocarbamates might be considered as possible CS2 donors. Thus, the present manuscript reports the kinetics of such CS2 release from several different dithiocarbamates (DTCs, eqn (1)) under physiologically relevant conditions (aerated aqueous solutions at 37 °C and near neutral pH values). The CS2 release rates vary considerably, thereby providing a wide range of activities for potential physiological studies. The studies described here are focused on providing guidelines for understanding the origin(s) of these varied rates.
| RR′N–CS2– + H+ → RR′NH + CS2 | 1 |
Notably, these studies derive further relevance from historical uses of dithiocarbamates as pesticides30 and continuing interest in the potential medicinal applications of dithiocarbamates.31–34 For example, DTCs have been demonstrated to be inhibitors of nuclear factor κB (NF-κB),32,33 a protein complex that catalyzes DNA transcription, to inhibit carbonic anhydrases and to show antiglaucoma activity in vivo.34
Results and discussion
The focus of these studies is to evaluate the potentials of various dithiocarbamates (R1R2NCS2 –) to serve as thermally activated CS2 donors under physiologically relevant conditions (eqn (1)). Stabilities of these DTCs that were prepared from secondary amines are quite dependent on the natures of the R groups, as well as on the reaction conditions. Consequently, an enormous range in CS2 release rates under physiologically relevant conditions is apparent. This variability thus provides the opportunity to choose the CS2 fluxes that might prove valuable tools in a specific biological experiment.
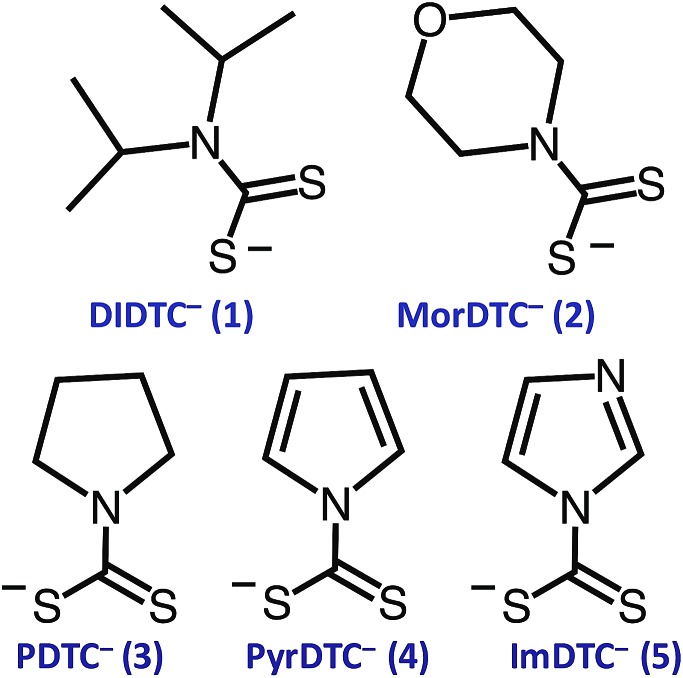
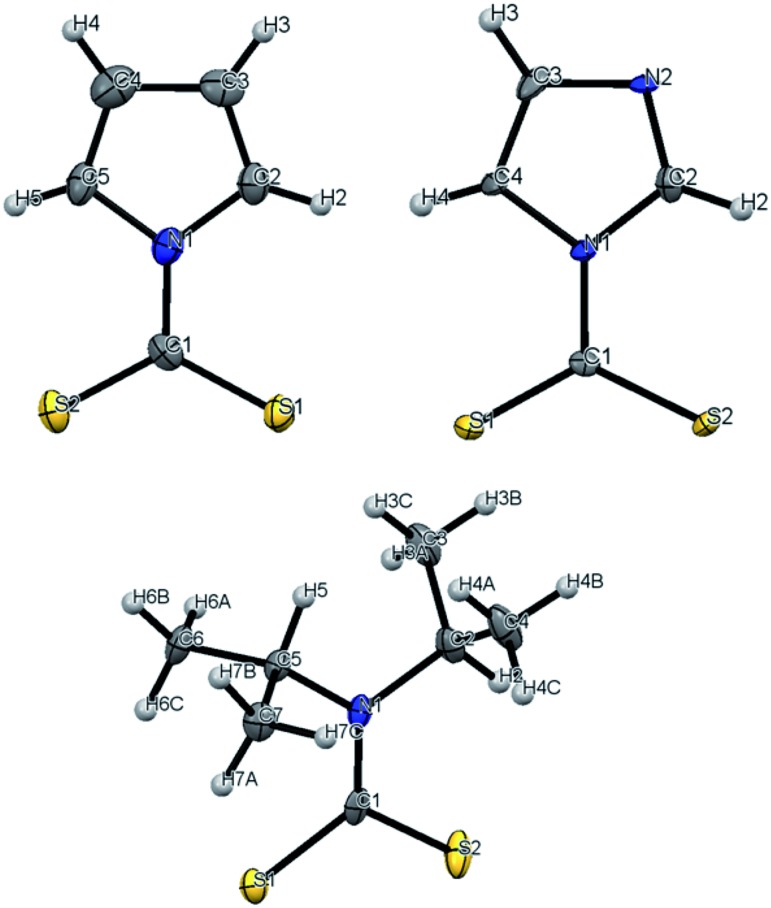
Fig. 1 illustrates the dithiocarbamate anions that are the subjects of this investigation. These were prepared by modifications of published procedures (see the ESI†). X-ray crystal structures have previously been reported for [iPr2H2N][DIDTC],35 [morpholinium][MorDTC]36 and [pyrrolidinium]-[PDTC].37 We report here the X-ray crystal structures of K[DIDTC], K[ImDTC] and K[PyrDTC], the DTC anions of which are shown in Fig. 2. The planarity of the NCS2 – functional group in these structures is due to the resonance between the nitrogen lone pair electrons and the CS2 group in a manner similar to the planarity seen for carbamates and acetamides.38
Fig. 1. Formulas of the DTC anions studied here: diisopropyldithiocarbamate (1, DIDTC–), N-(morpholinyl)dithiocarbamate (2, MorDTC–), pyrrolidinyldithiocarbamate (3, PDTC–), pyrrolyldithiocarbamate (4, PyrDTC–) and imidazolidyldithiocarbamate (5, ImDTC–).
Fig. 2. ORTEP plots of the PyrDTC–, ImDTC– and DIDTC– anions determined as the potassium salts. Top left: X-ray structure of the pyrrolyl-dithiocarbamate anion (PyrDTC–, 4). The C1–N1 bond length is 1.406 Å (avg.), and the S1–C1–S2 bond angle is 123.6° (avg.). Top right: X-ray structure of the imidazolidyldithiocarbamate anion (ImDTC–, 5): selected bond lengths are C1–N1, 1.413 Å (avg.) and the S1–C1–S2 bond angle is 125.6° (avg.)°. Bottom: X-ray structure of the diisopropyldithiocarbamate anion (DIDTC–). The C1–N1 bond length is 1.344(5) Å and the S1–C1–S2 bond angle is 117.3(2)°. (Each structure shown with 50% thermal ellipsoids. For 4 and 5, two DTC– anions appear in the asymmetric units, so the above bond angles and lengths are averaged. Packing and asymmetric unit structures are shown in ESI Fig. S1–S3,† while the crystal and structural refinement data and bond lengths and angles are reported in ESI Tables S1–S6†).
Density functional theory (DFT) computations for the DTC– anions 1–3 show this planarity for the optimized calculated structures in good agreement with the crystal structures (see below and ESI Fig. S4†). For PyrDTC– and ImDTC–, the dithiocarboxylate group is also coplanar with the unsaturated 5-membered ring. Notably, the measured and calculated N–CS2 bond lengths for 1, 2, and 3, where R 1 and R 2 are saturated carbons, are significantly shorter (1.33–1.36 Å) than those for 4 and 5 (1.41–1.44 Å), where R 1 and R 2 correspond to an aromatic ring (ESI Table S7†). These differences are discussed further below but can be attributed to π-delocalization of the nitrogen lone pair within the ring.
Kinetics of CS2 release from DTCs
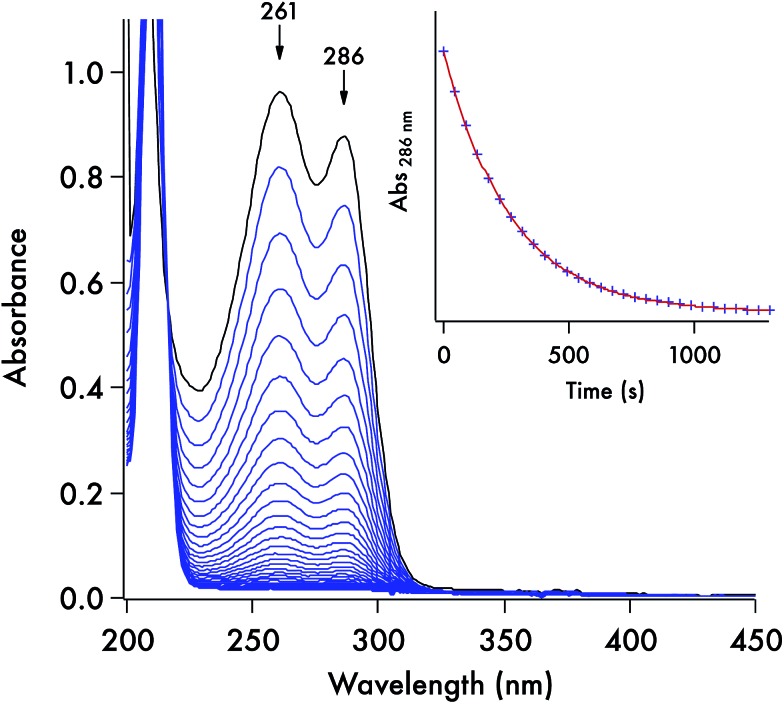
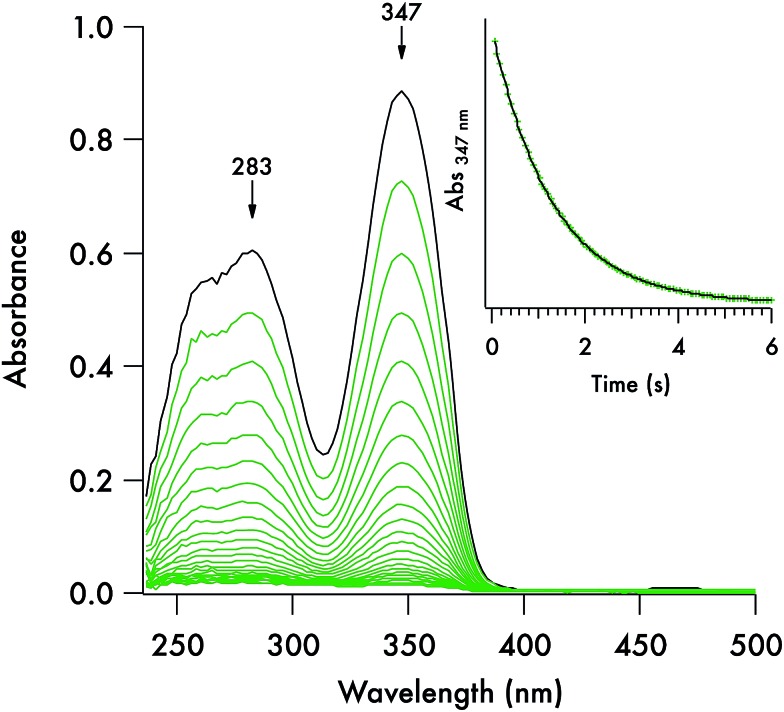
Each of these DTC anions displays two overlapping, strong UV absorption bands for the dithiocarbamate group at ∼250–260 nm and ∼280–290 nm with extinction coefficients of ∼104 M–1 cm–1 (see Fig. 3 for the spectrum of the DIDTC– anion in aqueous solution). TDDFT calculations indicate that these are π–π* transitions characteristic of the NCS2 – functionality (ESI Fig. S5†). Consistent with such an assignment is the shift, but not disappearance, of these bands when the dithiocarbamates are protonated in strongly acidic solutions (see below). Optical spectra of the DTCs formed from the aromatic amines pyrrole and imidazole display, in addition to these two bands, a third, longer wavelength band of comparable intensity at ∼340–350 nm (Fig. 4), that can be attributed from the TD-DFT calculations to intramolecular charge transfer from the NCS2 – group to the aromatic ring (ESI Fig. S6†). These spectral features are summarized in ESI Table S8.† In contrast, the products of CS2 release show little absorption in this wavelength range, thus the reaction depicted in eqn (1) is readily followed by recording the temporal spectra for a solution of a DTC salt under a specified set of conditions.
Fig. 3. Optical spectra recorded for a solution (0.082 mM) of K[DIDTC] (one scan every 45 s) in pH 7.4 aq. phosphate buffer (100 mM, μ tot = 261 mM) at 37 °C. Inset is the temporal plot of the absorbance at 286 nm. The data fit (red) conforms to the first order rate equation [A] = [A]0e–kt, where [A] is the absorbance of the DTC at time t, [A]0 is the initial absorbance, and k is the k obs for this pseudo-first order reaction.
Fig. 4. Temporal absorption spectra recorded on a stopped-flow spectrophotometer over a period a few seconds at of a solution prepared on the by 1 : 1 mixing an aqueous solution of K[ImDTC] (0.2 mM) in 5 mM NaOH with phosphate buffer solution. Conditions after mixing: pH 7.4, [buffer] = 75 mM, T = 37 °C. Temporal spectra recorded at 250 ms intervals.
For each set of conditions and dithiocarbamate studied, the DTC decay followed simple first order kinetics (eqn (2)). However, the rates of decay proved to be a function of the DTC involved, as well as of the solution pH, buffer and temperature. This point is illustrated by comparing the dynamics of the concomitant spectral changes occurring for the respective decays of DIDTC– and of ImDTC–, the latter being 200× faster than the former in pH 7.4 aqueous phosphate buffer (Fig. 3 and 4). The insets of these figures show the exponential decay of the starting compound as monitored at a single wavelength. When analogous experiments for K[DIDTC] and (NH4)[MorDTC] were allowed to go to completion, quantitative analysis of the solution for free CS2 according to the procedure described in the Experimental section confirmed the stoichiometry shown in eqn (1).
| –d[DTC]/dt = kobs[DTC] | 2 |
The kinetics of the thermal decay according to eqn (1) were investigated for the five DTCs (1–5) prepared from secondary amines. Spectral changes similar to the above figures were observed when 1, 2 or 5 are dissolved in various near-neutral aqueous media. As noted, reactivities under physiologically relevant conditions varied remarkably with lifetimes (τ = k obs –1) ranging from ∼2 s to ∼300 s to ∼391 min in pH 7.4 buffer solution (50 mM) at 37 °C for the salts of ImDTC–, DIDTC– and MorDTC–, respectively. In contrast, the salts of PDTC– or PyrDTC– showed no propensity to dissociate CS2 under these conditions as demonstrated by the absence of any spectral changes over a period of 24 h under analogous conditions (τ > 24 h). Thus, by making the correct choice of donor, one would be able to adjust over a broad range the flux of CS2 in a biological experiment, while PDTC– or PyrDTC– could serve as controls for evaluating the potential effects of the dithiocarbamate functionality itself. In the latter context, commercially available PDTC– has been used with in vitro experiments as an inhibitor of NF-κB37 and of nitric oxide synthase activity.38
pH and buffer effects
Earlier studies showed that DTC salts prepared from primary amines decompose by acid-catalyzed pathways when studied in strongly acidic media.39,40 Furthermore, even PDTC– and PyrDTC–, which are effectively inert under physiological conditions, decay in the presence of high acid concentrations. We demonstrate here that acid-induced rate accelerations are also apparent under the physiologically relevant conditions for the ImDTC–, DIDTC– and MorDTC– salts (Table 1).
Table 1. pH effects on the k obs values for the decay of the labile CS2 donors 1, 2, and 5. Conditions: 37 °C in 50 mM phosphate buffer adjusted to 154 mM ionic strength with NaCl except where noted.
| pH |
k
obs (in 10–3 s–1) for various donors |
||
| ImDTC– (5) | DIDTC– (1) | MorDTC– (2) | |
| 2.0 | 370 | ||
| 3.0 | 360 | ||
| 4.0 a | 320 ± 1 | ||
| 5.5 a | 48 800 ± 65 | 64.0 ± 0.1 | |
| 6.5 | 7990 ± 4 | 15.2 ± 0.3 | 0.36 |
| 6.8 | 9.6 ± 0.3 | 0.18 | |
| 7.0 | 6.8 ± 0.2 | 0.11 | |
| 7.4 | 775 ± 0.4 | 3.5 ± 0.1 | 0.043 ± 0.001 |
| 7.6 | 2.35 ± 0.08 | 0.025 | |
| 7.8 | 1.56 ± 0.04 | 0.015 | |
| 10.3 b | 3.5 ± 0.02 | ||
| 11.2 c | 0.08 | ||
aAcetate buffer at μ = 132 mM.
bCarbonate buffer.
c1.5 mM NaOH.
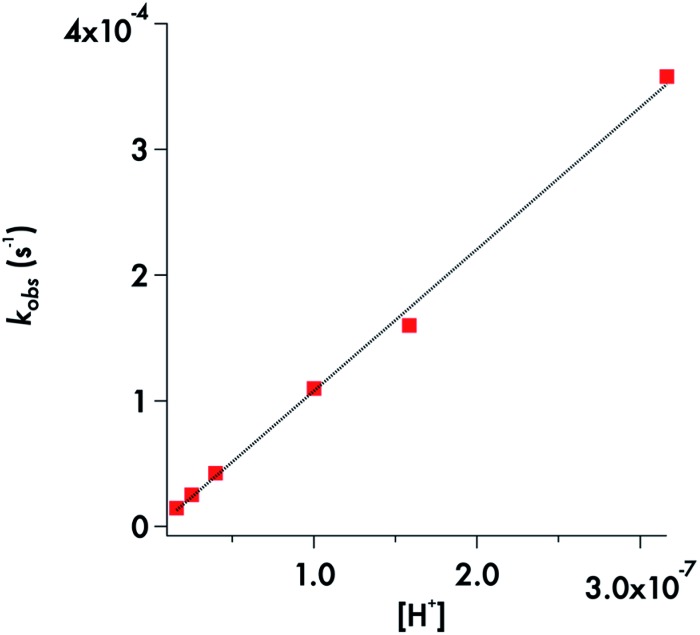
For the MorDTC– anion 2, the plot of the k obs values presented in Table 1 vs. [H+] at constant buffer concentration and temperature (37 °C) is strictly linear over the pH range 6.5–7.8 with a slope of (1.13 ± 0.03) × 103 M–1 s–1 in dilute phosphate buffer solution (Fig. 5). Thus, the decay of 2 appears first order in [H+] under these conditions. This behavior is in agreement with earlier studies by DeFilippo et al. of the acid catalyzed decomposition of 2 over the pH range 4.3–6.4 at 25 °C,41 and by Humeres et al. at much higher acid concentrations in aqueous ethanol.42 The data from the current experiments are consistent with a reversible protonation step followed by a subsequent release of CS2 and R2NH (Scheme 1) as proposed previously.41
Fig. 5. Plot of k obs vs. [H+] for decay of MorDTC– over the pH range 6.5–7.8 at 37 °C in phosphate buffer (50 mM) adjusted to 154 mM ionic strength with NaCl. The slope = 1130 ± 30 M–1 s–1.
Scheme 1. Acid catalysis mechanism for CS2 release from a DTC– anion.

This would give the rate law
 |
3 |
where K a is the acid dissociation constant for the protonated form DTCH and [DTC]tot = [DTCH] + [DTC–]. The k obs measured would equal k 1[H+]/(K a + [H+]). Given that the pK a for MorDTCH is reported to be 3.56;43,44 K a ≫ [H+] over the pH range explored, so eqn (3) can be rewritten as
| d[DTC–]/dt = k1Ka–1[H+][DTC–] | 4 |
consistent with the linear plot of k obs vs. [H+] in Fig. 5.
Correspondingly, the decay rate for the very reactive ImDTC– anion 5 also appears first order in [H+] over nearly 6 orders of magnitude, as shown by a log(k obs) vs. pH plot, which is linear with a slope close to unity (ESI Fig. S7†). Thus, a pathway involving reversible protonation of this species followed by CS2 dissociation appears probable. The potential mechanisms for decay of 5 will be discussed in greater detail below.
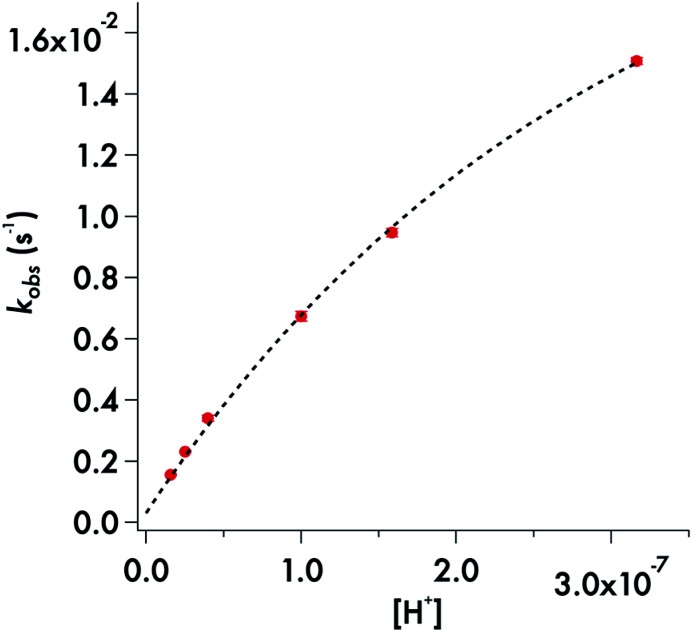
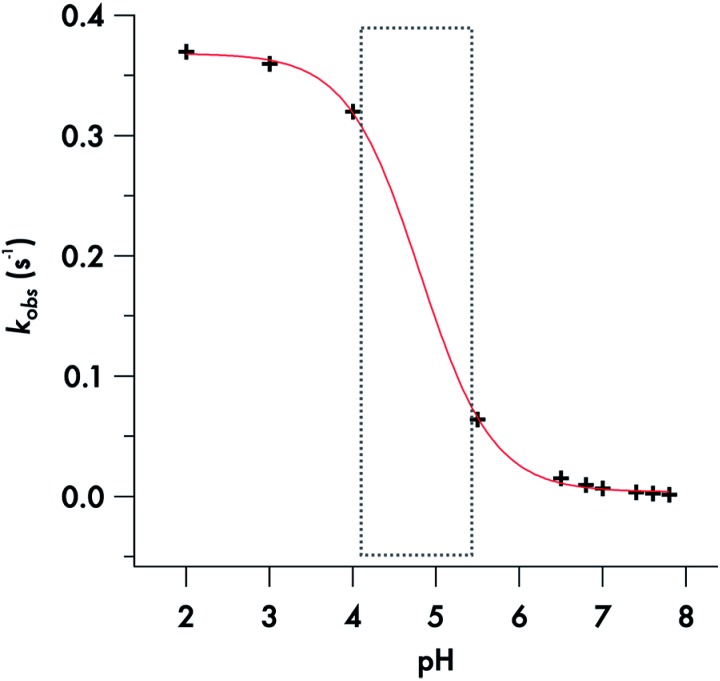
Somewhat different behavior is seen for the decay of the diisopropyldithiocarbamate anion 1. The plot of the k obs values for DIDTC– (Table 1) vs. [H+] over the pH range 6.5–7.8 is not linear (Fig. 6). Such curvature would be consistent with eqn (2), if K a were comparable to [H+] over this pH range, and a double reciprocal plot of k obs –1 vs. [H+]–1 (ESI Fig. S8†) proved to be linear leading to the calculated values k 1 = 0.021 ± 0.002 s–1 and K a = 2.02 × 10⁻⁷ (pK a = 6.69) at 37 °C. However, two points argue against this interpretation: (1) the K a's of other secondary amine DTCs tend to be several orders of magnitude higher,44 and (2) there were no spectral changes for solutions of K[DIDTC] over this pH range as expected if the DIDTC anion were being protonated. Indeed, when the decay was studied a much lower pH (<5) using the stopped-flow spectrophotometer, such differences in the initial spectrum were seen indicating that significant concentrations of a protonated form, presumably DIDTCH, is formed under those conditions (ESI Fig. S9†). Furthermore, the k obs for DIDTC– reaches a plateau value as illustrated in Fig. 7. From these data, a pK a of ∼4.6 can be estimated for DIDTCH. Notably, Humeres et al. observed similar saturations of the rate of decay in acidic solutions of aqueous ethanol for different monoalkyl and monoaromatic DTC– anions prepared from primary amines45–47 and from piperidine, morpholine and related cyclic secondary amines.42
Fig. 6. Plot of k obs vs. [H+] for the decay of DIDTC– in phosphate buffer (50 mM) with ionic strength adjusted to 154 mM with NaCl. pH 6.5–7.8 at 37 °C.
Fig. 7. Sigmoidal fit of the plot of the decomposition rate constants of DIDTC– versus pH.
Thus, although treating the k obs values for DIDTC– decay measured over the pH range 6.5–7.8 according to ESI Fig. S8† suggests the role of a reversible, pH dependent equilibrium, some other species must be responsible for this kinetics effect. Given that the pK a of sodium dihydrogen phosphate is ∼7,48 this would appear to be a logical candidate (see below).
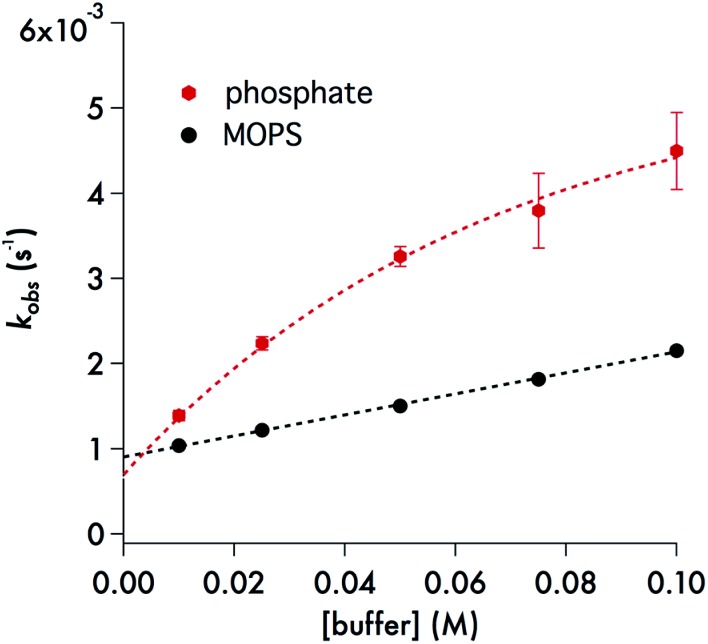
A particularly interesting feature of Fig. 8 is the curvature in the k obs vs. [buffer] plot for phosphate, which is a behavior seen for each of the pH values studied over the range 6.5–7.8 (ESI Fig. S10†). Several analytical expressions were generated attempting to model this behavior and these are described in the ESI.† One possibility was specific catalysis of DIDTC– decay by complexation with dihydrogen phosphate with the effect saturating at the higher buffer concentrations. However, the resulting equation did not fit well the experimental observations with consistent constants at all pH values. What did fit this data well was a model in which DIDTC– decay was catalyzed by H2PO4 – but inhibited by HPO4 2– (see ESI†).
Fig. 8. Black dots: plot of k obs vs. [buffer] for the decay of DIDTC at 37 °C – in pH 7.4 MOPS buffer (10–100 mM) with ionic strength adjusted to 308 mM with NaCl. The slope of this line is 0.0123 ± 0.0005 M–1 s–1 and the intercept is (9.05 ± 0.09) × 10–4 s–1. Red hexagons: plot of k obs vs. [buffer] for the decay of DIDTC– at 37 °C in pH 7.4 phosphate buffer with ionic strength adjusted to 308 mM with NaCl. See text and ESI† for description of curve fitting equation.
The role of phosphate in the decay kinetics of DIDTC– is further evident in the marked dependence of k obs on the phosphate buffer concentration (Fig. 8). Such behavior is often seen when the reaction of note is subject to general acid/base catalysis, and as is generally noted with such catalysis, this effect is also dependent on the nature of the buffer. The zwitterionic buffer MOPS (3-(N-morpholino)propanesulfonate),49 also demonstrates a significant buffer concentration effect on the k obs values for DIDTC– decay (Fig. 8), but the impact upon the rate was smaller than that seen for phosphate buffer (10–100 mM) at the same pH and ionic strength. For these experiments, the ionic strength was adjusted to 308 mM with NaCl in order to accommodate the higher buffer concentrations. However, it should be noted that we have found that the kinetics of DIDTC decay show minimal ionic strength effects (ESI Fig. S11†).
Activation parameters
Temperature effects on the rates of decay were measured for both K[DIDTC] and K[ImDTC]. Eyring type plots of ln(k obs/T) vs. 1/T were linear in each case (ESI Fig. S12 and S13†). From the slopes and intercepts of these plots, the apparent activation parameters ΔH ‡ and ΔS ‡ were calculated (Table 2). From these results can be made the following observations. Under conditions where the dominate species in each case is the DTC– anion, the rates parallel the ΔH ‡ rather than the ΔS ‡ values. The faster decay of the ImDTC– anion reflects an enthalpy of activation roughly 17 kJ mole–1 lower than that of DIDTC–, while ΔS ‡, which is substantially negative for each of the DTC– anions, remains comparable. Similarly, the 100-fold increased decay rate for diisopropyldithiocarbamate in pH 2 solution where the protonated form DIDTCH must predominate, relative to that at pH 7.4, is accompanied by a ∼13 kJ mol–1 decrease in ΔH ‡ rather than an increase in ΔS ‡.
Table 2. Activation parameters for the decay of DTC salts in aqueous solution (this work unless noted).
| Compound | pH | T (°C) | k obs (s–1) | ΔH ‡ (kJ mol–1) | ΔS ‡ (J mol–1 K–1) |
| K[ImDTC] | 7.55 a | 37.4 | 1.05 | 44.8 ± 1 | –101 ± 4 |
| K[DIDTC] | 2.0 b | 37.1 | 0.37 | 49.4 ± 1 | –95 ± 4 |
| K[DIDTC] | 7.4 b | 37.0 | 0.0040 | 62.1 ± 1 | –91 ± 3 |
| K[DIDTC] | 7.4 c | 37.5 | 0.0020 | 62.8 ± 1 | –95 ± 3 |
| K[MorDTC] | 7.4 b | 37.0 | 4.3 × 10⁻⁵ | d | d |
| Na[MorDTC] | 5.92 e | 35 | 3.6 × 10⁻⁴ | 66.1 ± 1 | –97 ± 4 |
aPhosphate buffer solution (75 mM), μ = 170 mM.
bPhosphate buffer solution (50 mM), μ = 154 mM (NaCl).
cMOPS buffer solution (50 mM), μ = 154 mM (NaCl).
dNot measured.
e Ref. 37, acetate buffer, μ = 1.0.
Computational insight into decay mechanisms
Density functional computations reported here used the B3LYP exchange-correlation functional and the 6-31+G(d,p) basis set with implicit solvent effects included using PCM (solvent = water) methods.38 The five DTCs shown in Fig. 1 fall into two categories: those with aliphatic groups bound to the DTC nitrogen, namely, DIDTC–, MorDTC– and PDTC, and those where the nitrogen is part of an aromatic ring, namely, ImDTC– and PyrDTC–. The calculated structures for these agree well those determined from the crystal structures (ESI Fig. S4 and Table S7†). The goal of this section is to examine whether DFT calculations provide rational mechanistic insight into the marked reactivity differences toward CS2 dissociation (eqn (1)).
Beginning with the R2NCS2 – anions formed from saturated amines, DIDTC– with two bulky isopropyl groups is the most reactive and displays a decay lifetime of ∼300 s in pH 7.4 aq. solution at 37 °C, while τ for MorDTC– with a saturated 6-membered ring is 361 min and that for PDTC– with a saturated 5-membered ring is >24 h. What effects explain the relative reactivities of these three ions? The crystal structures and DFT optimized geometries of PDTC–, MorDTC– and DIDTC– (Table S7†) reflect the multiple N–C bond character of the N–CS2 – function. This is attributed to π-delocalization of the amine lone pair electrons into the unoccupied π* orbital(s) of the CS2 in addition to the strong N to C σ-donation. The experimental bond lengths follow the reactivity order; thus PDTC– displays the shortest N–C bond. Using the nucleophilicity scale for primary and secondary amines proposed by Mayr et al. 50 one might infer the relative donor strengths of the N-bound R groups. Accordingly, the pyrrolidine is clearly a stronger nucleophile than morpholine, and, although diisopropyl amine was not studied, the diethyl amine analog is a significantly weaker nucleophile than is morpholine, consistent with the relative N–CS2 bond lengths and the reactivities of these DTCs toward decay. However, since the kinetics of these reactions are acid dependent, it is clear that the decay mechanism is more complex that simple CS2 dissociation from the amide anion (Scheme 1).
The most readily protonated site on the R2NCS2 – anion would be the dithiocarboxylate group (eqn (5)). The initial spectrum of a pH 2 solution containing K[DIDTC] prepared by stopped-flow mixing displays shifts in the UV bands consistent with this conclusion, and the pKa value of ∼4.6 was indicated by the pH dependent kinetics (Fig. 7). For comparison, the reported pK a's of MorDTC– and PDTC– are 3.56 and 3.1 respectively.43,44 Notably, the DFT calculations indicate that the N–CS2H bonds of all the conjugate acids are shorter by ∼0.02 Å, and thus are presumably stronger than in the corresponding anions (ESI Fig. S14 and Table S7†).
| RR′NCS2– + H+ ⇌ RR′NCS2H | 5 |
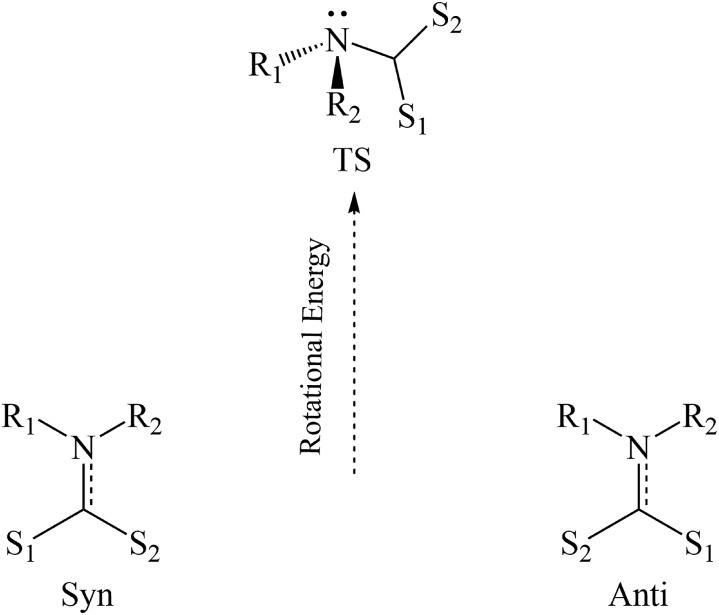
In their discussion of possible decay mechanisms for DTCs derived from primary amines in strongly acidic solutions, Humeres and coworkers proposed that the sulfur bonded proton transfers to the carbamate nitrogen in a concerted process leading to amine formation concomitant with CS2 dissociation.43–45 They further proposed that this process is mediated by a water molecule. Such proton transfer would require rotation of the CS2H group from the characteristic co-planarity seen, for example, in Fig. 2 as well as a change of the nitrogen from a planar to a pyramidal configuration (Scheme 2). Similar considerations apply to rotations around the C–N bonds of amides38 and carbamates.51 The rotation and concomitant planar to pyramidal conversion decreases the π-bonding contribution to C–N bond order while increasing the basicity of the nitrogen.
Scheme 2. Simplified energy diagram for the rotation about the nitrogen–carbon bond in DTC's.
DFT calculations were performed on PDTC–, MorDTC– and DIDTC– and their conjugate acids to examine the torsional strain resulting from simple rotation of the dihedral angles around the C–N bonds (Scheme 2, ESI Fig. S15 and Tables S9–S12†).
The transition state (TSrot) of this process presents a pyramidal nitrogen with a higher N contribution to the highest occupied molecular orbital (HOMO) than the ground state (GS) in each case. Notably the energy required to achieve TSrot is ∼23 kJ mol–1 higher for PDTC– than for DIDTC– or MorDTC– and the respective barrier for PDTCH is ∼25 kJ mol–1 higher than for DIDTCH or MorDTCH (ESI Table S9†). Furthermore, although the rotation barriers for the latter two were energetically close, the nitrogen component of the TSrot HOMO was considerably larger for DIDTCH than for MorDTCH, suggesting that S to N proton transfer may be more favorable for DIDTCH. According to eqn (4), the higher pK a of DIDTCH would also enhance an acid catalyzed mechanism in aqueous solution. The summation of these parameters is consistent with the reactivity order DIDTC– > MorDTC– ≫ PDTC–. Lastly, if S to N proton transfer is mediated by a water molecule, then it is likely that the catalytic behavior seen for the phosphate buffers with the reactions of DIDTC– in aqueous solution reflects analogous mediation by a dihydrogen phosphate. In either case, the direct involvement of a water molecule or the buffer conjugate acid, while possibly lowering the enthalpy barrier for proton transfer would have a negative contribution to the transition state entropy.
With regard to the two aromatic DTCs, the kinetics studies show that ImDTC– decays at pH 7.4 with a lifetime <2 s, while that for PyrDTC– is >24 h. In terms of the above discussion, the low reactivity of PyrDTC– might be considered surprising given that the DFT calculated structures for this anion and its conjugate acid PyrDTCH both display longer N–CS2 bonds and much lower barriers to rotation around that bond than do the saturated DTCs (ESI Tables S9 and S10†). The longer bonds and lower rotational barriers can be attributed to delocalization of the nitrogen lone pair electrons into the aromatic ring resulting in less π-bonding to the –CS2 unit. Furthermore, the nitrogen atom in the computed TS for the PyrDTCH rotation remains planar and, as a consequence, should have relatively little proton affinity owing to the very small nitrogen atom contribution to the HOMO.
In contrast, the rapid decay rates for ImDTC– display nearly first order behavior in [H+] over the broad pH range from 11.2 to pH 5.5. (Attempts to study this at lower pH gave rates too fast to measure on the stopped flow spectrometer). At first glance, this is a remarkable difference given the structural (Fig. 1 and ESI S4†) and spectroscopic similarity (ESI Table S8†) between ImDTC– and PyrDTC–. The resonance involvement of the nitrogen lone pair in the ring aromaticity also leads to a longer N–CS2 bond in the ground state of ImDTC–as well as a low rotation barrier around this bond. The obvious difference is the ring nitrogen present in the imidazole derivative that provides an alternative site for protonation to give the zwitterionic species, ImDTCH(NH) (eqn (6)), which incidentally is isoelectronic to PyrDTC–.
 |
6 |
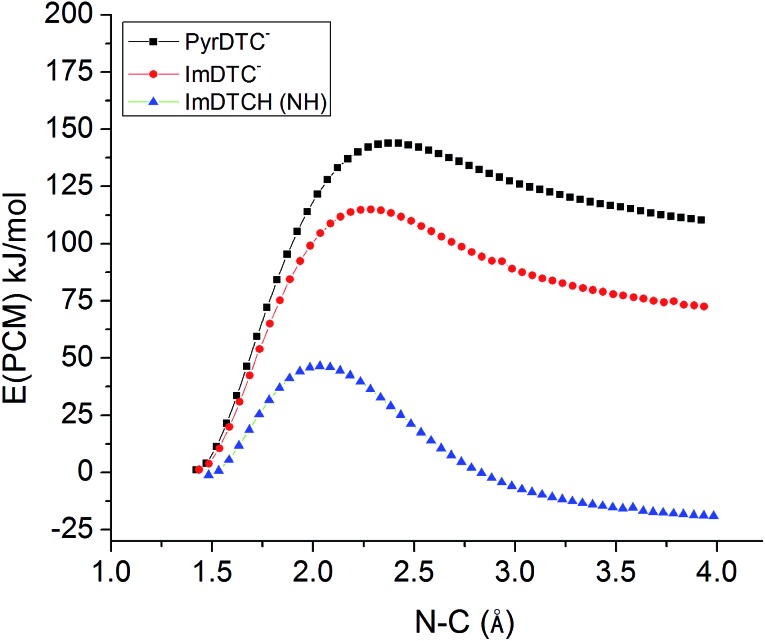
So why is ImDTCH(NH) so labile to CS2 dissociation when the isoelectronic analog PyrDTC– is not? The answer can be found in the DFT calculated barriers for simple dissociation of the N–CS2 bond (eqn (7)). For PyrDTC– and ImDTC–, the calculated barriers are 142 kJ mol–1 and 113 kJ mol–1, respectively, while the barrier for the N protonated ImDTCH(NH), it is dramatically smaller, 47 kJ mol–1 (Fig. 9).
 |
7 |
Fig. 9. DFT calculated barriers for the dissociation of the N–CS2 bond for PyrDTC–, ImDTC–, ImDTCH(NH) at the B3LYP/6–31 + g(d,p) level of theory (solvent correction performed with PCM model (water)).
Summary
We have described the reactions of several dithiocarbamate salts that undergo thermal dissociation to release (uncage) carbon disulfide under physiologically relevant conditions (pH 6.5–7.8, aqueous solutions at 37 °C). The reactivities of these DTCs vary widely, with lifetimes under these conditions from a few seconds to days, thus providing a toolbox for evaluating potential signalling or therapeutic properties of different fluxes of CS2 delivery.
All of these reactions are acid dependent, but at least two different mechanisms are at play. In most cases, the decay of the DTC– anion to release CS2 is envisioned as occurring via protonation of the dithiolate group followed by transfer of the proton to the nitrogen site perhaps concurrently with rotation from the planar ground state and pyramidalization of the nitrogen. This process is also subject to general acid catalysis by the conjugate acid of the buffer. An alternative pathway is proposed for the imidazolidyl-dithiocarbamate anion ImDTC–, which is proposed to decay rapidly by CS2 dissociation after protonation of the remote imidazolidyl ring nitrogen. Interestingly, this zwitterionic species is isoelectronic with the extremely unreactive pyrrolyldithiocarbamate anion PyrDTC–, but DFT studies demonstrate that the barrier for simple CS2 dissociation is ∼95 kJ mol–1 lower for the former.
In conclusion, there is a wide variation in the stabilities of DTCs under physiologically relevant conditions, and these differences need to be taken into account for applications of DTCs. However, this variability provides different fluxes of CS2 release that can be utilized to probe biological roles of this small molecule. Evaluating the kinetics and decay mechanisms of such CS2 donors will facilitate future investigations of this potential SMB.
Experimental
Syntheses of dithiocarbamates (DTCs)
The modified procedures, materials and instrumentation used to prepare and characterize the DTC salts are described in the ESI.†
Materials
Phosphate buffers were prepared using sodium phosphate monobasic, sodium phosphate dibasic, and sodium chloride from Fisher Scientific. The MOPS (3-(N-morpholino)propanesulfonate) buffer was purchased from EMD while Krebs buffer was purchased from Sigma Aldrich. Nanopure water (≥18 megohm) was obtained from a Barnstead Nanopure II system and used in solution preparations for kinetics studies.
Kinetics studies
The rates of slower reactions determined by monitoring temporal spectral changes on a Shimadzu UV-2401 spectrophotometer with UVProbe kinetics software. The reaction cell was a septum-capped, sealable quartz cuvette with a 1.0 cm pathlength and an approximate volume of 4.80 mL. The cells were thermostated (±0.2 °C) at the desired reaction temperature, and the solutions were stirred with a Starna ‘Spinnette’ stirrer. Septum sealed cells containing the buffer solution of interest temperature equilibrated (7–10 min) at the desired conditions (typically 37 °C). Then a small amount of the solid DTC salt (5–10 mg) was added to a vial containing 3–5 mL of buffer to prepare a stock solution. A 100 μL aliquot of this stock solution was then syringed into the thermostated cuvette. The volumes were chosen to minimize the head-space in the cuvette. Data acquisition was initiated after an estimated dead time of 60–90 s. For each experiment, a fresh stock solution of the DTC salt was prepared prior to injection. Kinetics experiments below room temperature utilized a Jasco V-730 spectrophotometer equipped with a PSC-760 Peltier cell holder with stirrer. At T ≤ 15 °C, a stream of dry N2 was flushed over the chamber to prevent water condensation from the atmosphere.
Kinetics data were processed using IgorPro 6.37 software by Wavemetrics, Inc., and Prism 7 by GraphPad Software, Inc. For global fittings of equilibrium analyses and determination of back reaction values, a DynaFit (BioKin Ltd) nonlinear least squares regression program was used.
Faster kinetics studies (τ = 2 ms–100 s) were performed using an Applied Photophysics SX.19MV stopped-flow UV-Visible spectrophotometer with photodiode array (temporal spectra) or a photomultiplier tube (single wavelength) detection. DTC salt solutions were prepared at higher pH in Hamilton salt syringes (#1725 AD-SL), which were attached to the mixing block of the spectrophotometer and sealed from the outside atmosphere by a three-way valve. These syringes were maintained at the desired temperature (generally 37 °C unless otherwise noted) by a circulating water bath. The connector tubing and observation cell were purged with the sample solution by filling and emptying the drive syringes 3× prior to data acquisition. Mixing of the substrate solution with a lower pH buffer solution initiated decomposition of the DTC. The entire unit was controlled with “Applied Photophysics Pro-Data SX” software. Only simultaneous symmetric mixing was used (1 : 1 dilution).
Computational studies
All DFT computations were performed with the Gaussian'09 software package. Optimizations were performed using Kohn–Sham DFT with the hybrid B3LYP exchange-correlation functional and the 6-31+G(d,p) basis set. No symmetry restriction was imposed and implicit solvent effects were included using PCM (solvent = water) methods as implemented in Gaussian 09. Vibrational frequency calculations were performed at the same level of theory for all optimized structures to verify that no imaginary frequencies were present, to ensure the true local minima energies and to identify transition states geometries (TS). Intrinsic reaction coordinate (IRC) calculation was performed to confirm that the minima are connected to the transitions states (TS). TD-DFT calculations were performed using the hybrid M06-2X exchange-correlation functional and the 6-31+G(d,p) basis set.
X-ray crystallography
The solid-state crystal structures of K[DIDTC], K[ImDTC] and K[PyrDTC] were determined by mounting suitable crystals on a Bruker Kappa Apex II single-crystal diffractometer CCD detector system equipped with a fine focus X-ray source (MoKα) and a TRIUMPH monochromator. The X-ray structural data are summarized in ESI Tables S1 and S2.†
Analysis of CS2 release
This procedure was similar to that described by Schwack and Nyanzi52 and to that used to detect CS2 released by the photolysis of CdSe quantum dots surface decorated with 1,1-dithiooxalate.25 In the present case, the CS2 was detected by determining absorption spectral changes upon reaction with alkaline ethanol to form sodium ethylxanthate (λ max 303 nm, ε = 1.74 × 10⁴ M–1 cm–1).53 The DTC substrates were allowed to degrade completely (as monitored from their characteristic absorption spectra), then flowing medical grade air was used to transfer the volatile CS2 from the substrate solution via PEEK or Teflon tubing to a stirred cuvette containing 3.0 mL of ∼10 mM NaOH in 190 proof ethanol. For consistency, the airflow was controlled by an Omega FL-1471-G 150 mm rotameter flow tube. The CS2 released was determined from the absorbance changes recorded compared to a calibration curve. The calibration curve was prepared by injecting known quantities of CS2 into a separate cell containing ethanol/water alone and determining the relative response upon its transfer to the cuvette containing the alkaline ethanol. Maximum values are reached within 3–5 minutes of injection of the CS2. Care must be taken to avoid an excessive alkaline medium in the detection cell given that xanthates are subject to slow hydrolysis.
Note
Carbon disulfide is toxic at high exposures, and long periods of modest exposure have been associated with a number of health conditions. Handle and store CS2 and CS2-generating compounds with care.
Conflicts of interest
The authors declare no competing financial interest.
Acknowledgments
This work was supported by grants to PCF from the Chemistry Division of the United States National Science Foundation (CHE-1405062 and CHE-1565702). We also thank the UCSB Academic Senate Research Committee for seed money in support of this research. We acknowledge support from the Center for Scientific Computing from the CNSI, MRL: an NSF MRSEC (DMR-1121053) and NSF CNS-0960316. MLS thanks CAPES (Coordenação de Aperfeiçoamento de Pessoal de nível Superior), process 99999.000902/2015-02, for a postdoctoral fellowship. We thank Dr Guang Wu (UCSB) for help with x-ray structures.
Footnotes
References
- Nitric Oxide: Biology and Pathobiology, ed. L. J. Ignarro, Elsevier Inc., Burlington MA, 2nd edn, 2010. [Google Scholar]
- Motterlini R., Otterbein L. E. Nat. Rev. Drug Discovery. 2010;9:728–743. doi: 10.1038/nrd3228. [DOI] [PubMed] [Google Scholar]
- Fukuto J. M., Carrington S. J., Tantillo D. J., Harrison J. G., Ignarro L. J., Freeman B. A., Chen A., Wink D. A. Chem. Res. Toxicol. 2012;25:769–793. doi: 10.1021/tx2005234. [DOI] [PMC free article] [PubMed] [Google Scholar]
- Heinrich T. A., da Silva R. S., Miranda K. M., Switzer C. H., Wink D. A., Fukuto J. M. Br. J. Pharmacol. 2013;169:1417–1429. doi: 10.1111/bph.12217. [DOI] [PMC free article] [PubMed] [Google Scholar]
- Heinemann S. H., Hoshi T., Westerhausen M., Schiller A. Chem. Commun. 2014;50:3644–3660. doi: 10.1039/c3cc49196j. [DOI] [PMC free article] [PubMed] [Google Scholar]
- Andreadou I., Iliodromitis E. K., Rassaf T., Schulz R., Papapetropoulos A., Ferdinandy P. Br. J. Pharmacol. 2015;172:1587–1606. doi: 10.1111/bph.12811. [DOI] [PMC free article] [PubMed] [Google Scholar]
- Wu D., Si W., Wang M., Lv S., Ji A., Li Y. Nitric Oxide. 2015;50:38–45. doi: 10.1016/j.niox.2015.08.004. [DOI] [PubMed] [Google Scholar]
- Szabo C. Nat. Rev. Drug Discovery. 2016;15:185–203. doi: 10.1038/nrd.2015.1. [DOI] [PMC free article] [PubMed] [Google Scholar]
- Ryter S. W., Choi A. M. K. Transl. Res. 2016;167:7–34. doi: 10.1016/j.trsl.2015.06.011. [DOI] [PMC free article] [PubMed] [Google Scholar]
- Lancaster Jr J. R. Nitric Oxide. 1997;1:18–30. doi: 10.1006/niox.1996.0112. [DOI] [PubMed] [Google Scholar]
- WHO Concise International Chemical Assessment Document (CICAD) 46: Carbon Disulfide, World Health Organization, United Nations Environment Program, International Labor Organization 2002, http://www.inchem.org/documents/cicads/cicads/cicad46.htm.
- Gelbke H.-P., Göen T., Mäurer M., Sulsky S. I. Crit. Rev. Toxicol. 2009;39(supp. 2):1–126. doi: 10.1080/10408440902837967. [DOI] [PubMed] [Google Scholar]
- Phillips M., Sabas M., Greenberg J. J. Clin. Pathol. 1993;46:861–864. doi: 10.1136/jcp.46.9.861. [DOI] [PMC free article] [PubMed] [Google Scholar]
- Vitali B., Ndagijimana M., Cruciani F., Carnevali P., Candela M., Guerzoni M. E., Brigidi P. BMC Microbiol. 2010;10:4. doi: 10.1186/1471-2180-10-4. [DOI] [PMC free article] [PubMed] [Google Scholar]
- Vitali B., Ndagijimana M., Maccaferri S., Biagi E., Guerzoni M. E., Brigidi P. Anaerobe. 2012;18:386–391. doi: 10.1016/j.anaerobe.2012.04.014. [DOI] [PubMed] [Google Scholar]
- Smeulders M. J., Barends T. R. M., Pol A., Scherer A., Zandvoort M. H., Udvarhelyi A., Khadem A. F., Menzel A., Hermans J., Shoeman R. L., Wessels H. J. C. T., van den Heuvel L. P., Russ L., Schlichting I., Jetten M. S. M., Op den Camp H. J. M. Nature. 2011;478:412–416. doi: 10.1038/nature10464. [DOI] [PubMed] [Google Scholar]
- Smeulders M. J., Pol A., Venselaar H., Barends T. R. M., Hermans J., Jetten M. S. M., Op den Camp H. J. M. J. Bacteriol. 2013;195:4046–4056. doi: 10.1128/JB.00627-13. [DOI] [PMC free article] [PubMed] [Google Scholar]
- DeMartino A. W., Zigler D. F., Fukuto J. M., Ford P. C. Chem. Soc. Rev. 2017;46:21–39. doi: 10.1039/c6cs00585c. [DOI] [PubMed] [Google Scholar]
- Saavedra J. E., Billiar T. R., Williams D. L., Kim Y. M., Watkins S., Keefer L. K. J. Med. Chem. 1997;40:1947. doi: 10.1021/jm9701031. [DOI] [PubMed] [Google Scholar]
- Nitric Oxide Donors: For Pharmaceutical and Biological Applications, ed. P. G. Wang, T. B. Cai and N. Taniguchi, Blackwell Science Publishers, Oxford, 2005, ISBN:978-3-527-60375-6. [Google Scholar]
- Barraud N., Kardak B. G., Yepuri N. R., Howlin R. P., Webb J. S., Faust S. N., Kjelleberg S., Rice S. A., Kelso M. J. Angew. Chem., Int. Ed. 2012;51:9057–9060. doi: 10.1002/anie.201202414. [DOI] [PubMed] [Google Scholar]
- Ford P. C. Nitric Oxide. 2013;34:56–64. doi: 10.1016/j.niox.2013.02.001. [DOI] [PubMed] [Google Scholar]
- García-Gallego S., Bernardes G. J. L. Angew. Chem., Int. Ed. 2014;53:9712–9721. doi: 10.1002/anie.201311225. [DOI] [PubMed] [Google Scholar]
- Mase J. D., Razgoniaev A. O., Tschirhart M. K., Ostrowski A. D. Photochem. Photobiol. Sci. 2015;14:777–785. doi: 10.1039/c4pp00441h. [DOI] [PubMed] [Google Scholar]
- Bernt C. M., Burks P. T., DeMartino A. W., Pierri A. E., Levy E. S., Zigler D. F., Ford P. C. J. Am. Chem. Soc. 2014;136:2192–2195. doi: 10.1021/ja4083599. [DOI] [PubMed] [Google Scholar]
- Powell C. R., Foster J. C., OkyereTheus B., Matson J. B. J. Am. Chem. Soc. 2016;138:13477–13480. doi: 10.1021/jacs.6b07204. [DOI] [PMC free article] [PubMed] [Google Scholar]
- Steiger A. K., Pardue S., Kevil C. G., Pluth M. D. J. Am. Chem. Soc. 2016;138:7256–7259. doi: 10.1021/jacs.6b03780. [DOI] [PMC free article] [PubMed] [Google Scholar]
- Steiger A. K., Yang Y., Royzen M., Pluth M. D. Chem. Commun. 2017;53:1378–1380. doi: 10.1039/c6cc09547j. [DOI] [PubMed] [Google Scholar]
- Steiger A. K., Zhao Y., Pluth M. D. Antioxid. Redox Signaling. 2017 doi: 10.1089/ars.2017.7119. [DOI] [PMC free article] [PubMed] [Google Scholar]
- Mathieu C., Duval R., Xu X., Rodrigues-Lima F., Dupret J. M. Expert Opin. Drug Metab. Toxicol. 2014;11:1–14. doi: 10.1517/17425255.2015.975691. [DOI] [PubMed] [Google Scholar]
- Lin L. Z., Lin J. Int. J. Cancer. 2011;129:1285–1286. doi: 10.1002/ijc.25780. [DOI] [PubMed] [Google Scholar]
- Cau S. B. A., Guimaraes D. A., Rizzi E., Ceron C. S., Gerlach R. F., Tanus-Santos J. E. Basic Clin. Pharmacol. Toxicol. 2015;117:234–241. doi: 10.1111/bcpt.12400. [DOI] [PubMed] [Google Scholar]
- La Rosa G., Cardali S., Genovese T., Conti A., Di Paola R., Le Torre D., Cacciola F., Cuzzocrea S. J. Neurosurg. Spine. 2004;1:311–321. doi: 10.3171/spi.2004.1.3.0311. [DOI] [PubMed] [Google Scholar]
- Carta F., Aggarwal M., Maresca A., Scozzafava A., McKenna R., Masin E., Supuran C. T. J. Med. Chem. 2012;55:1721–1730. doi: 10.1021/jm300031j. [DOI] [PMC free article] [PubMed] [Google Scholar]
- Wahlberg A. Acta Crystallogr., Sect. B: Struct. Crystallogr. Cryst. Chem. 1978;34:3479–3481. [Google Scholar]
- Mafud A., Edgar C., Sanches A., Gambardella M. T. Acta Crystallogr., Sect. E: Struct. Rep. Online. 2011;67:o2008. doi: 10.1107/S1600536811026286. [DOI] [PMC free article] [PubMed] [Google Scholar]
- Wahlberg A. Acta Crystallogr., Sect. B: Struct. Crystallogr. Cryst. Chem. 1979;35:485–487. [Google Scholar]
- Duffy E. M., Severance D. L., Jorgensen W. L. J. Am. Chem. Soc. 1992;114:7535–7542. [Google Scholar]
- Cuzzocrea S., Chatterjee P. K., Mazzon E., Dugo L., Serraino I., Britti D., Mazzullo G., Caputi A. P., Thiemermann C. Br. J. Pharmacol. 2002;135:496–510. doi: 10.1038/sj.bjp.0704463. [DOI] [PMC free article] [PubMed] [Google Scholar] [Retracted]
- Sherman M. P., Aeberhard E. E., Wong V. Z., Griscavage J. M., Ignarro L. J. Biochem. Biophys. Res. Commun. 1993;191:1301–1308. doi: 10.1006/bbrc.1993.1359. [DOI] [PubMed] [Google Scholar]
- De Filippo D., Deplano P., Devillanova F., Trogu E. F., Verani G. J. Org. Chem. 1973;38:560–563. [Google Scholar]
- Humeres E., Lee B., Debacher N. A. J. Org. Chem. 2008;73:7189–7196. doi: 10.1021/jo801015t. [DOI] [PubMed] [Google Scholar]
- Antunes P. A., Breviglieri S. T., Chierice G. O., Cavalheiro E. T. G., J. Braz. Chem. Soc., 2001, 12 , 473 –480 , , as reported in ref. 44 . [Google Scholar]
- Hogarth G., Transition Metal Dithiocarbamates: 1978–2003. Chpt 2, in Prog. Inorg. Chem., ed. K. Karlin, 2005, vol. 53, pp. 71–561. [Google Scholar]
- Humeres E., Debacher N. A., Sierra M. M., Franco J. D., Schutz A. J. Org. Chem. 1998;63:1598–1603. [Google Scholar]
- Humeres E., Debacher N. A., Franco J. D., Lee B. S., Martendal A. J. Org. Chem. 2002;67:3662–3667. doi: 10.1021/jo016190t. [DOI] [PubMed] [Google Scholar]
- Garcıa J. I., Humeres E. J. Org. Chem. 2002;67:2755–2761. doi: 10.1021/jo016209s. [DOI] [PubMed] [Google Scholar]
- Goldberg R. N., Kishore N., Lennen R. N. J. Phys. Chem. Ref. Data. 2002;31:232–370. [Google Scholar]
- Sankar M., Bates R. G. Anal. Chem. 1978;50:1922–1924. [Google Scholar]
- Brotzel F., Chu Y. C., Mayr H. J. Org. Chem. 2007;72:3679–3688. doi: 10.1021/jo062586z. [DOI] [PubMed] [Google Scholar]
- Cox C., Lectka T. J. Org. Chem. 1998;63:2426–2427. doi: 10.1021/jo9800863. [DOI] [PubMed] [Google Scholar]
- Schwack W., Nyanzi S. Fresenius. J. Anal. Chem. 1993;345:705–711. [Google Scholar]
- Hao F. P., Silvester E., Senior G. D. Anal. Chem. 2000;72:4836–4845. doi: 10.1021/ac991277o. [DOI] [PubMed] [Google Scholar]
Associated Data
This section collects any data citations, data availability statements, or supplementary materials included in this article.


