Abstract
Background:
The foramen magnum (FM) has garnered broad interest across the disciplines of anthropology, comparative anatomy, evolutionary biology, and clinical sciences. Most studies regarding the structure of the FM in humans have been intrapopulation morphometric studies rather than interpopulation morphologic studies. The few studies assessing the morphology of the foramen have utilized ambiguous and subjective descriptors to describe foraminal shape and are, consequently, difficult to reproduce. Therefore, detailed study of FM shape among craniofacially and geographically diverse populations through reproducible methods is warranted.
Objectives:
The aim of this study was to assess intersex and interpopulation differences in FM size and shape among diverse populations.
Materials and Methods:
The study analyzed 152 FMs of varied sex and race via traditional and geometric morphometric methods.
Results and Conclusions:
The study demonstrates that, within each distinct population, the size of the FM is significantly larger in males than in females; however, there are no significant differences in the shapes of the foramina between sexes. However, when comparing different populations to one another, there are significant differences with regard to both the size and shape of the FM. This study also presents a new model of FM ontogeny. Specifically, the growth occurring between the anterior and posterior foraminal boundaries before 5 years of age predicts the ultimate shape of the adult FM.
Keywords: Anatomy, brachycephaly, occipital bone, plagiocephaly, skull base
INTRODUCTION
Interest in the anatomy of the foramen magnum (FM) is largely interdisciplinary-made evident by numerous anatomical studies from the fields of physical anthropology, forensic anthropology, comparative anatomy, evolutionary biology, and surgery.[1,2,3,4,5,6,7,8,9,10,11] Studies have advanced concepts regarding the utilization of FM morphometry to differentiate between sexes,[1,3,6,8,9,12] postulate whether a species tended toward bipedalism or quadrupedalism,[10,11,13] demonstrate intra- and intervariability of species,[4,7] identify victims of mutilation,[2] and influence surgical approaches at the craniovertebral junction.[5,14,15] The morphometry of the FM has also been correlated with brain size, cranial size, and intracranial volume.[11,16,17,18]
Development of the foramen magnum
During fetal development, the anterior and lateral aspects of the FM are formed from the basioccipital, the exoccipitals, and their respective interoccipital synchondroses anterior while the posterior boundary of the foramen is formed by the supraoccipital, the exoccipitals, and their corresponding interoccipital synchondroses posterior. The fetal growth centers do not fully ossify until approximately 10 years of age until which time both the size and shape of the FM are undergoing change. Between the 7th month in utero and birth, the rate of FM growth in its sagittal dimension is 5.4% greater than that of its transverse dimension.[19] Between birth and 0.5 years, the opposite trend is observed – the rate of transverse growth is 7.6% faster than that of sagittal growth.[19] Mean adult sagittal lengths are attained by 5 years of age, whereas mean transverse lengths are not attained until 10 years of age.[19]
Morphometry of the foramen magnum
Adult females have a reported mean sagittal FM diameter ranging from 27.1 to 36.66 mm,[20,21] whereas adult males have a reported mean sagittal diameter ranging from 32 to 40.0 mm.[20,22] Adult females have a reported mean transverse diameter ranging from 25.45 to 31.34 mm,[21,23] whereas adult males have a reported mean transverse diameter ranging from 26.92 to 38.0 mm.[22,23] Studies reporting both female and male mean sagittal and transverse diameters agree that male FM diameters are longer than those of females.
Morphology of the foramen magnum
Aside from documenting the ratio between sagittal and transverse diameters (i.e., FM-index), the study of FM shape has been largely limited to assigning shape categories to foramina. The shape of the FM has been classified with ambiguous terminology such as “asymmetrical,” “biconvex,” “bi-pointed oval,” “bi-rounded oval,” “circular,” “dorsally convergent oval,” “egg,” “heart-like,” “heptagonal,” “hexagonal,” “irregular,” “oval,” “pentagonal,” “pear,” “polygonal,” “rhomboid,” “round,” “symmetrical,” “tetragonal,” “two semicircles,” “ventrally wide oval,” and “wide oval.”[19,22,24,25,26] Further, the shape categories that reports have used to classify FM are inconsistent between studies, thereby causing confusion with interpretation. For example, Henríquez-Pino et al.[24] note that the FM is oval in 87.3% of crania; however, Govsa et al.[27] report that the FM is oval in only 7.39% and is instead mostly tetragonal – a category that was not identified by Henríquez-Pino et al.[24] Sahoo et al.[26] report the FM to be mostly in the shape of “two semicircles,” and furthermore, both pear- and egg-shaped more often than oval-shaped; however, similar to the Henríquez-Pino et al.'s[24] study, Sahoo et al.[26] did not identify a tetragonal category. Indeed, Aragão et al.[25] classified FM into eight categories and still noted that “in the remaining 6.36% of the FM, it was not possible to define a regular and specific form.” And so, because of the inconsistencies between studies, there remains little consensus regarding the shape of the FM.
Knowledge of morphometric and morphologic variation of the FM in different populations has implications for a variety of scientific fields; however, the structure of the FM has not been studied among several geographically and craniofacially distinct populations. Moreover, the study of FM shape has been performed with ambiguous and subjective terminology that varies between studies. Therefore, the study of morphometry and morphology of the FM in geographically and craniofacially distinct groups of humans, analyzed through reproducible and quantifiable methodology, is warranted. This report presents an analysis of the size and shape of the FM in varied populations of Homo sapiens.
MATERIALS AND METHODS
Sample
Digital images (n = 179) of human basis cranii externa were acquired from the Online Research Scan Archive (ORSA), formerly known as the Penn Cranial CT Database. The images were of the crania from the Samuel George Morton Collection,[28,29,30] housed and curated at the University of Pennsylvania Museum of Archaeology and Anthropology.
A total of 179 images were each reviewed for exclusion from the study. Images were excluded based on the following criteria: (1) evidence of gross occipital bone pathology such as atlantooccipital fusion or fracture that interferes with the clear visualization of the boundary of the FM (n = 14); (2) foreign material occluding the view of the FM margins (e.g., mummification artifacts) (n = 2); (3) poor photographic quality (n = 2); (4) images that were taken from cranial casts (n = 8); and (5) fetal age (n = 1). After exclusion, a total of 152 foramina were included in the study.
Sex, age, and geographic/social group information were acquired from the database. The sample of 152 crania included 61 male and 63 female crania. All other specimens were of questionable sex or were unsexed subadult crania (n = 28). The age-at-death reported in the ORSA database was typically a multiple of 10 and therefore was assumed to often be estimated by Morton or his colleague Meigs. Therefore, for this study, age was organized via decade. For example, a cranium with a reported age of 30 years was categorized as the fourth decade. Of the 152 skulls, 0 (0%) were fetal skulls; 7 (4.6%) were 1st decade; 6 (3.9%) were 2nd decade; 9 (5.9%) were 3rd decade; 36 (23.7%) were 4th decade; 35 (23.0%) were 5th decade; 20 (13.2%) were 6th decade; 13 (8.6%) were 7th decade; 5 (3.3%) were 8th decade; 1 (0.7%) was 9th decade; 0 (0%) were 10th decade; 1 (0.7%) was 11th decade; and 19 (12.5%) were of questionable age.
The geographic and social group information originally documented by Morton/Meigs was reevaluated and reorganized by the authors a priori. The reclassification was done to eschew confusion regarding the Morton/Meigs classifications and to form larger anthropologically meaningful groups from small samples of geographically diverse crania that would not be well-representative of a general population (e.g., two Japanese FM cannot be meaningfully compared to 61 Peruvian FM). For example, the Morton/Meigs classifications “Negro,” “Negro born in America,” and “Native African” were reclassified into a group “AFRIC.” The AFRIC group excluded Egyptian crania which were classified into a separate group “EGYPT.” Two crania were classified by Morton/Meigs as German, six as Anglo-American, three as Celtic, one as Dutch, one as English, four as Irish, and one as Swedish – these crania, from individuals of European descent, were collectively grouped “EUROP.” The East Asian crania, five Chinese and two Japanese, were collectively grouped “EASIA.” The Morton/Meigs classifications also included “Hindu,” “Bengali,” “Hindu Bengali,” and “Indian.” These groups (6 Hindu; 12 Bengali; 1 Hindu Bengali; 0 Indian) were reclassified based on the collective geographic region of Bengal into the group “BENGA.”
The crania with provenance originating from Peru were collectively grouped “PERUV.” These Peruvian crania were brought to Morton's collection from several different geographic regions including Santa, Callao, Pisco, and areas local to Lima. For the most part, crania grouped as PERUV were from Pachacamac or from other locations within proximity to Lima (approximately 40 crania).
The Pachacamac region is noteworthy due to the inhabitance of the Incan people and the practice of intentional cranial deformation common to the region.[31] Further, intentional cranial deformation methods practiced by the cultures of Pachacamac are known to produce brachycephalic crania.[31] Morton[28] describes the crania of the “Inca or Modern Peruvian” as “…remarkable for its small size and for its quadrangular form. The occiput is greatly compressed, sometimes absolutely vertical; the sides are swelled out and the forehead is somewhat elevated, but very retreating. The skulls are remarkable for their irregularity.” The PERUV crania utilized in this study were largely of the brachycephalic type. Conversely, Peruvians from Titicaca were known for intentional dolichocephalic cranial deformation.[31] No Titicacan crania were included in this study.
It is difficult to identify all the PERUV crania as indigenous to the region with any certainty due to both the diverse settlement of Pachacamac over time and the second-handed documentation of Morton and Meigs from grave robbers.[32] Indeed, Blake[31] quotes a note regarding skeletons found at Pachacamac that read, “the chief in the centre, the head properly formed; a number of supposed immolated slaves, lying at full length, like rays, in a circle round him, having their heads depressed, like the Titicacans. But this only proves that these slaves might have been Titicacans, and not necessarily (indigenous).”
The Morton collection of crania used in this report included crania from individuals across a broad historical timespan.[28,29,30] A prior study has documented transverse and sagittal diameters of FM among several different populations from different eras (3800–3000 blood pressure [BP], 1335–1400 BP, 600–650 BP, and 66–228 BP, respectively), revealing neither significant differences in transverse dimensions nor sagittal dimensions of the FM over time.[33] Because the dimensions of the FM have been demonstrated to be maintained over spans of thousands of years, it is unlikely that temporal difference in the cranial sample used in this study would significantly influence the interpopulation analysis.
For population and sex comparison, crania identified as 1st decade (n = 7), questionable age (n = 19), and questionable sex (n = 28) were excluded from the study. Some of these crania were of both questionable age and sex. After exclusions, a total of 121 FM were included for between-population morphometric analysis and 106 FM for sexual dimorphism study. Populations included the following sample sizes: AFRIC (total = 8; male = 3; female = 4; questionable = 1); BENGA (total = 15; male = 6; female = 8; questionable = 1); EASIA (total = 7; male = 3; female = 3; questionable = 1); EUROP (total = 17; male = 9; female = 7; questionable = 1); MALAY (total = 15; male = 14; female = 1; questionable = 0); PERUV (total = 59; male = 18; female = 30; questionable = 11).
Morphometric and morphological analysis
Several studies of the FM have utilized transverse and sagittal diameters of the foramen to calculate the area of the FM according to formulae utilized by Radinsky:[17] A = ¼ × π × w × h, and Teixeira:[1] A = π × ([h × w]/4) 2; however, these methods only provide approximations. Therefore, FM dimensions were analyzed with modern image analysis techniques though the use of ImageJ software.[34,35] The following morphometric parameters were assessed with ImageJ: transverse diameter, sagittal diameter, perimeter, and area of the FM.
Recently, the objective shape descriptors, i.e., circularity, solidity, aspect ratio of a best fit ellipse, and roundness, have been used to describe cranial foramina.[36] Circularity, 4π × (area)/(perimeter)2, is a mathematical indicator of the degree of similarity to a perfect circle. A circularity of 1.0 is that of a perfect circle. As circularity approaches 0.0, the shape becomes less circular. Solidity, (area within the foramen)/(area contained within a convex hull surrounding the foramen), describes the extent to which a shape is concave or convex. A perfectly convex shape has a solidity of 1. The more concavity of the foraminal margin – the lower the solidity. The aspect ratio of a best fit ellipse is calculated as the major axis of a best fit ellipse divided by the minor axis of a best fit ellipse. The best fit ellipse, in the case of this study, was determined by the internal functions of ImageJ. Roundness, given by the function 4 × (area)/(π × [major axis of a best fit ellipse] 2), is similar to circularity but is not sensitive to an irregular foraminal border. The aforementioned shape descriptors were also measured with ImageJ software.
To perform geometric morphometric analysis, outlines of the FM were first converted to landmarks in TPSdig2 software (version 2.22).[37] The outline of each FM was sampled into 150 equidistant points, labeled sequentially from point 1 to point 150. The coordinates of the 150 landmarks were generated for all of the 152 foramina to generate a total of 22,800 two-dimensional landmarks. A consensus shape amid a cloud of data points was generated from a Procrustes superimposition aligned by principal axes with the Geomorph package for R software.[38] Likewise, MorphoJ software was utilized to produce consensus shapes for males and females in each population category.[39]
Statistical analysis and graphical representations
Descriptive statistics (mean, standard deviation [SD], and standard error of the mean [SEM]) for the transverse diameter, sagittal diameter, area, perimeter, circularity, solidity, aspect ratio of a best fit ellipse, and roundness were calculated with GraphPad Prism statistical software version 6.00 (GraphPad Software, La Jolla, CA, USA). Prism was also utilized to perform one-way ANOVA tests of parameters between populations in conjunction with Tukey's multiple comparison tests. Likewise, unpaired t-tests were performed with Prism.
MorphoJ software was used to perform principal components analyses on the sample of 152 crania and also the sample of 121 crania from population subsets. So-called “lollipop plots” with thin plate spline deformations were also generated to graphically display shape variance. In the population subset of 121 crania of known population, canonical variate (CV) analysis was also performed to assess shape differences between populations. Again, lollipop plots with thin plate splines were generated. Mahalanobis distances were calculated and populations were graphically represented with 90% confidence ellipses. Discriminant function analysis, visually represented via histogram, was performed to assess sexual dimorphism. With regard to discriminant function analysis between males and females, Procrustes distances, Mahalanobis distances, and Hotelling's T-squared statistics were determined. Sexual dimorphism figures were created by wireframe deformation including all male and female FMs, as well as in the FM of the varied geographic subpopulations. Heat maps utilizing Jacobians were produced with Lory 1.0 software to demonstrate regional expansion/contraction shape change.[40,41]
RESULTS
Morphometry
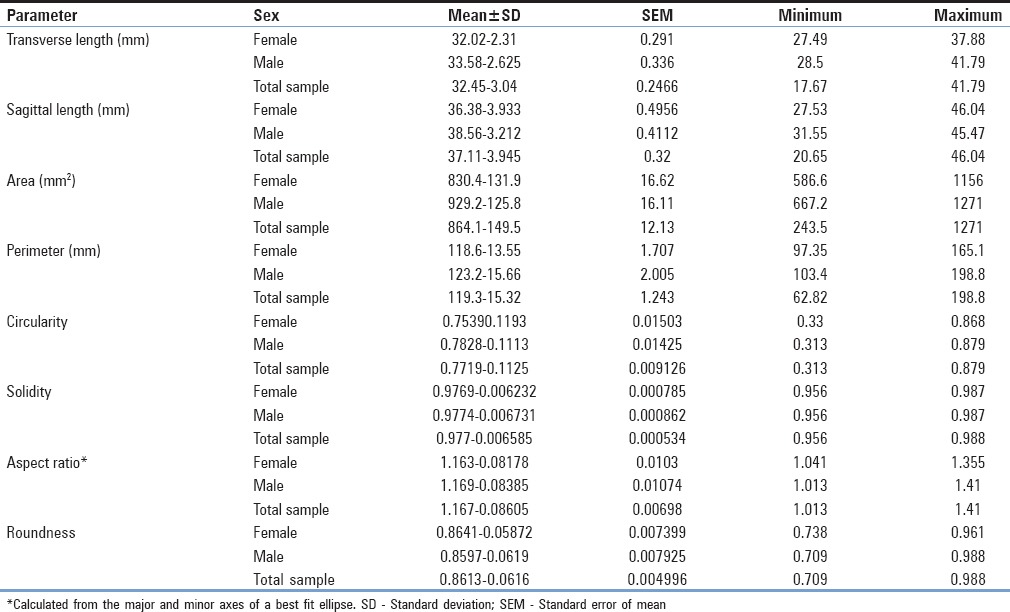
Among the total population, average transverse length of the FM was 32.45 ± 3.04 mm (mean ± SD) [Table 1]. The average sagittal length of the FM was found to be 37.11 ± 3.95 mm. The mean FM index (sagittal length/transverse length) was 1.14. The average area and perimeter of the foramen were 864.1 ± 149.5 mm2 and 119.3 ± 15.32 mm, respectively.
Table 1.
Normative morphometric and shape descriptive statistics of the foramina magnums among a sample of 152 dry human crania (63 females, 61 males, and 28 unsexed, respectively)
Population morphometry
With regard to differences between varied geographic populations, a one-way ANOVA test of the transverse lengths between different populations was not statistically significant (F = 0.7937; P = 0.5562). However, an ANOVA of the sagittal lengths between populations demonstrated statistical significance (F = 7.421; P < 0.0001). Tukey's multiple comparison test revealed trends in differing means between the Peruvian population and the other populations. Two-tailed t-tests revealed significant differences between the sagittal dimensions of Peruvians and all other populations analyzed (PERUV-AFRIC: T(68) = 3.241; P = 0.0018; PERUV-BENGA: T(78) = 4.085; P = 0.0001; PERUV-EASIA: T(66) = 2.455; P = 0.0167; PERUV-EUROP: T(77) = 3.426; P = 0.001; PERUV-MALAY: T(74) = 3.619; 0.0005) [Figure 1].
Figure 1.
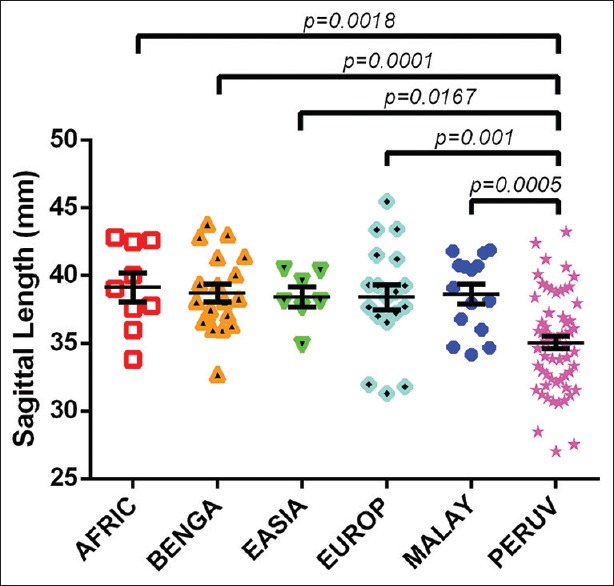
An interpopulation comparison demonstrating statistically significant differences between the sagittal foramen magnum length among Peruvians to sagittal foramen lengths of crania from individuals of African descent (excluding Egyptians), the geographic region of Bengal, East Asians, Europeans, and Malayans. The least mean difference between Peruvian foramen magnum and other populations was that between the Peruvian and European populations (3.352 ± 0.9782 mm, mean ± standard error of the mean). Conversely, the greatest mean difference between Peruvian foramen magnum and other populations was that between the Peruvian and African populations (4.071 ± 1.256 mm)
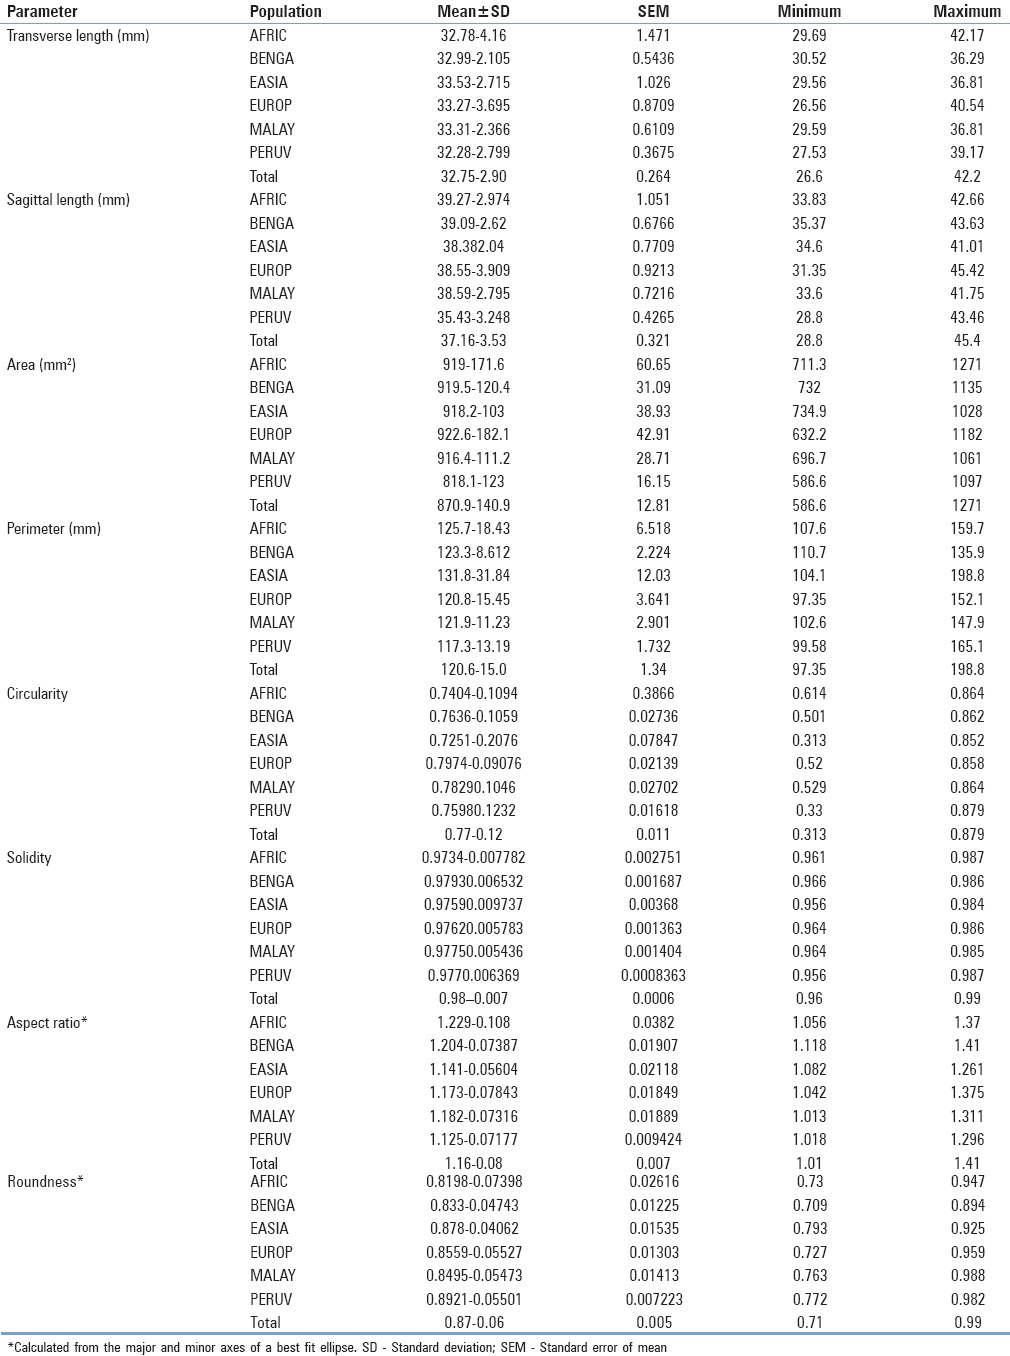
Similarly, there were significant differences between the FM area of Peruvian crania and all other populations (PERUV-AFRIC: T(64) = 2.070; P = 0.0425; PERUV-BENGA: T(71) = 2.858; P = 0.0056; PERUV-EASIA: T(63) = 2.063; P = 0.0433; PERUV-EUROP: T(74) = 2.798; P = 0.0067; PERUV-MALAY: T(71) = 2.810; P = 0.0064) [Figure 2]. The AFRIC, BENGA, EASIA, EUROP, and MALAY groups all had a mean FM area >916 mm2 (range = 6.2 mm2; minimum MALAY mean FM area of 916.4 mm2 to maximum EUROP mean FM area of 922.6 mm2) [Table 2]. Comparatively, the PERUV mean FM area was 818.1 mm2, approximately 100 mm2 less than each of the other populations. The Peruvian FM also had a significantly smaller perimeter than East Asian foramina (T(63) = 2.271; P = 0.0266).
Figure 2.
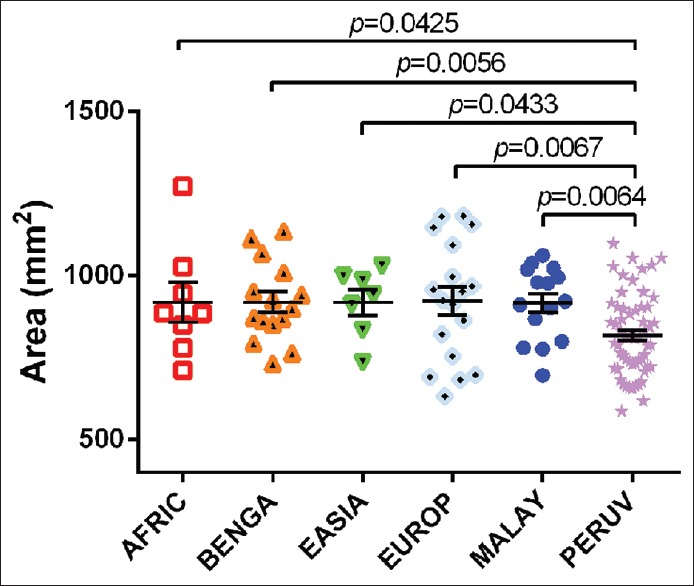
An interpopulation comparison demonstrating statistically significant differences between the foramen magnum area between Peruvian and African, Bengal, East Asian, European, and Malayan crania. The mean areas of African, Bengali, East Asian, European, and Malayan crania ranged from 916.4 mm2 to 922.6 mm2; however, the average area of the Peruvian foramen magnum was 818.1 ± 16.15 mm2 (mean ± standard error of the mean)
Table 2.
Normative morphometric and shape descriptor descriptive statistics of the foramina magnums among a sample of 121 adult dry human crania separated by population
Sexual morphometry
Male and female normative morphometric data are summarized in Table 1. On average, males had a significantly longer transverse length than females, with a mean difference of 1.561 ± 0.4436 mm (mean ± SEM) (95% confidence interval [CI] = 0.6833–2.440 mm; T(122) = 3.520; P = 0.0006), and a significantly longer sagittal length than females, with a mean difference of 2.178 ± 0.6461 mm (95% CI = 0.8986–3.457 mm; t = 3.371 (122); P = 0.001) [Table 3 and Figures 3, 4]. Similarly, there was a statistically significant difference between male and female FM area, with a mean difference of 98.78 ± 23.16 mm2 (95% CI = 52.93–144.6 mm2; t = 4.264 (122); P < 0.0001) [Table 3 and Figures 5, 6]. However, there was no difference in FM perimeter between sexes (t = 1.785 (122); P = 0.0767).
Table 3.
Comparison between male and female foramina magnums via unpaired t-tests

Figure 3.
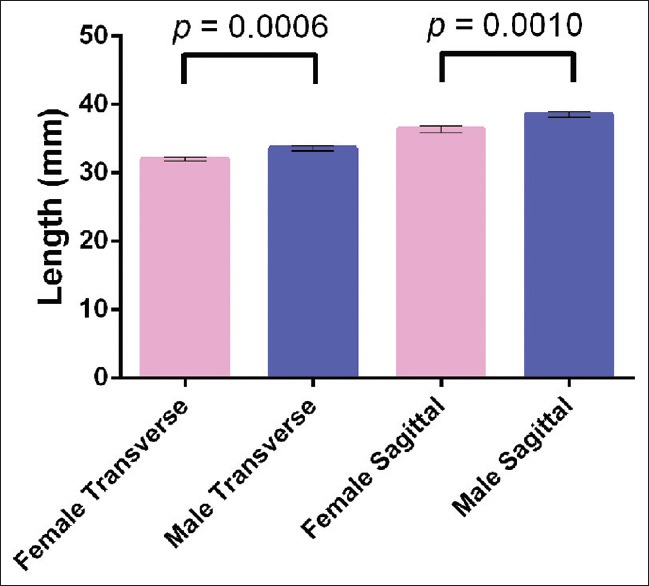
Differences in transverse and sagittal diameters between males and females. Males had a significantly longer transverse length than females with a mean difference of 1.561 ± 0.4436 mm (mean ± standard error of the mean) (95% confidence interval = 0.6833–2.440 mm; T (122) = 3.520; P = 0.0006). Males also had a significantly longer sagittal length than females, with a mean difference of 2.178 ± 0.6461 mm (95% confidence interval = 0.8986–3.457 mm; t = 3.371 (122); P = 0.001)
Figure 4.
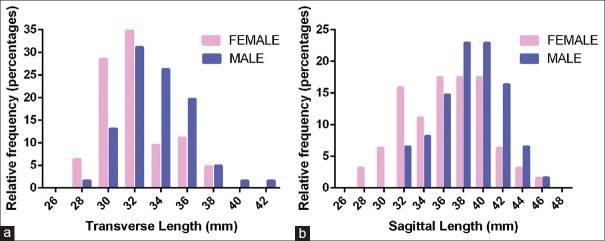
Relative frequency distribution of foramen magnum (a) transverse diameter and (b) sagittal diameters between males and females. Histogram bin centers were spaced at every 2 mm. With regard to transverse length, most female crania had foramen magnums lengths between the bin centers of 30 and 32 mm (28.57% and 39.68%, respectively, for a total of 68.25% of the female sample). Male foramen magnum lengths also peaked at 32 mm (31.14%); however, a greater distribution of male foramina had longer transverse lengths (26.23% at 34 mm and 19.67 at 36 mm). Therefore, 77.04% of males had transverse lengths in the bin center range between 32 and 36 mm. With regard to sagittal length, the greatest portion of female foramina measured between bin centers 36 and 40 mm, each bin center accounting for 17.46% of the sample for a total of 52.38%. The greatest male relative distribution of sagittal lengths were in the bin centers of 38 (22.95%) and 40 mm (22.95%), accounting for 45.9% of male foramina
Figure 5.
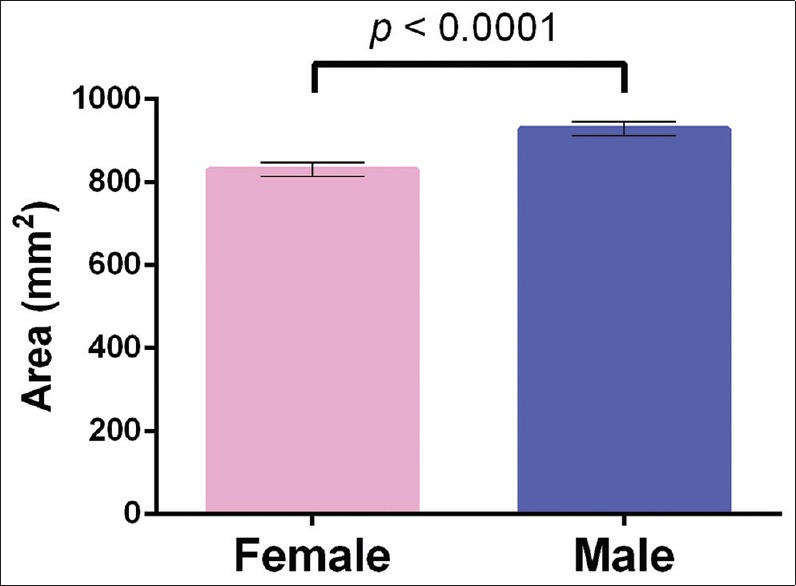
Column graph demonstrating a statistically significant difference between male and female foramen magnum area, with a mean difference of 98.78 ± 23.16 mm2 (95% confidence interval = 52.93–144.6 mm2; t = 4.264 (122); P < 0.0001)
Figure 6.
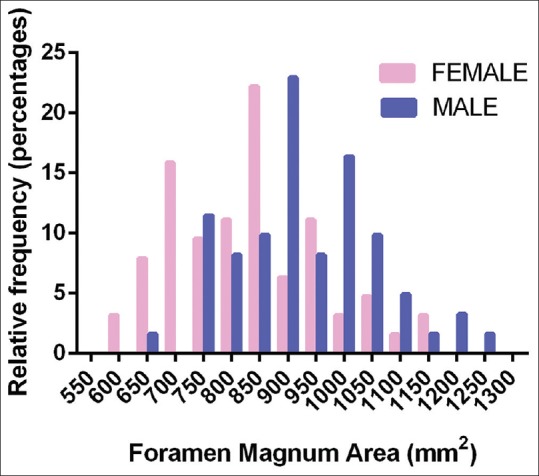
Relative frequency distribution of foramen magnum areas between sexes with bin centers at every 50 mm2. Females tended to have the most foramina distributed at 850 mm2 (22.22%), whereas males had the most foramina distributed at 900 mm2 (22.95%)
Morphology
The average shape of the FM is represented in Figure 7. The first three principle components (PCs) from the PC analysis accounted for 66.69% of the total shape variance (PC1 = 37.95%; PC2 = 17.45%; and PC3 = 11.3%) [Figure 8]. The greatest variation in FM shape (PC1 = 37.95%) occurred as an inverse relationship between the FM boundaries located in the transverse and sagittal dimensions of the FM. As the anterior and posterior foraminal boundaries become more approximated, the lateral foraminal boundaries expand and vice versa. With regard to regional expansion/contraction, as the transverse region of the foramen contracts, the regions of the anterior and posterior poles of the foramen expand and vice versa [Figure 9]. The shape variation along the second PC, explaining an additional 17.45% of shape variation, is characterized by an inverse relationship between the oblique axes of the FM, that is, as the anterior right and posterior left foraminal boundaries become more approximated, the anterior left and posterior right dimensions expand and vice versa [Figure 8]. The third PC, explaining 11.3% of shape variation, demonstrated a triangular shape change between the anterolateral aspects of the foramen and the posteromedial aspect of the foramen [Figure 8].
Figure 7.
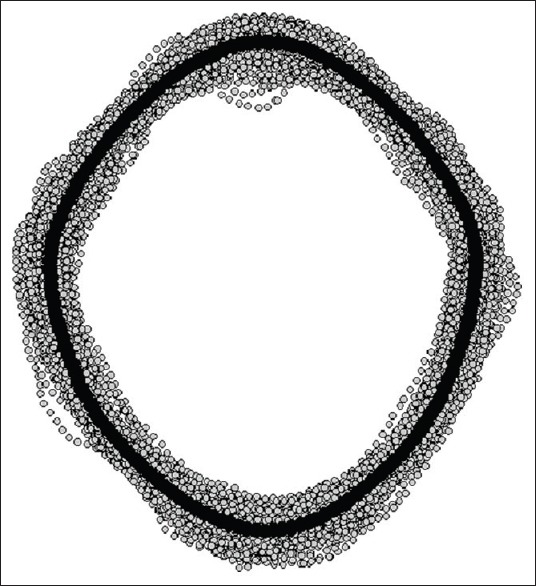
Consensus shape of the foramen magnum (black curve) amid a coordinate point cloud formed from 152 foramina, each outlined with 150 points (gray dots). The consensus shape comes from a sample of crania with known diversity of geography, age, as well as sex, and additionally, having no apparent bony pathology
Figure 8.
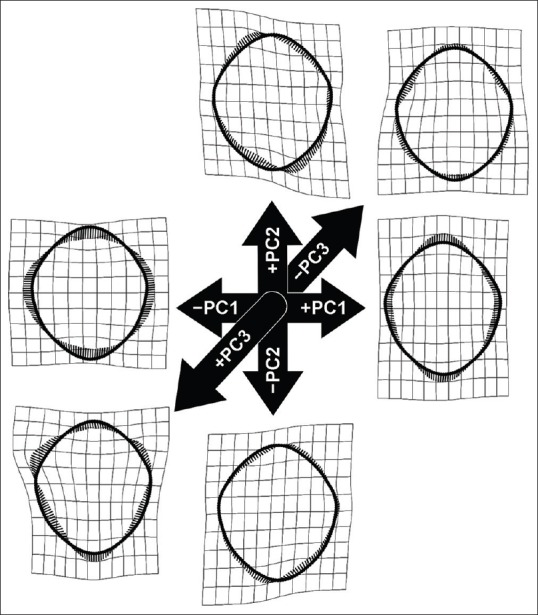
Thin plate spline deformations representing the foramen magnum shape change along the first three principle components. The principle components analysis was performed on the sample of 152 foramina from crania with known diversity of geography, age, and sex-having no apparent bony pathology. Collectively, the first three principle components account for 66.69% of the total shape variance (principle component 1 = 37.95%; principle component 2 = 17.45%; and principle component 3 = 11.3%)
Figure 9.
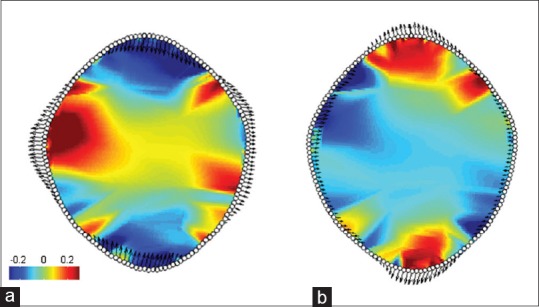
(a) Represents the negative extreme of PC1 and (b) represents the positive extreme of PC1. Parrot plots of the foramina located at the extremes of principle component 1 seen in Figures 8 and 10, which explains 37.95% of total shape variation. The red hues represent magnitude of local expansion, blue hues represent local contraction, and greens represent invariant regions relative to the reference configuration (zero on the principle component axis). Specifically, values represent the log2 determinant of the Jacobians (zero represents no change in local area between individual and consensus shape, −0.5 represents a local halving of the area, and +1 a doubling)
Population morphology
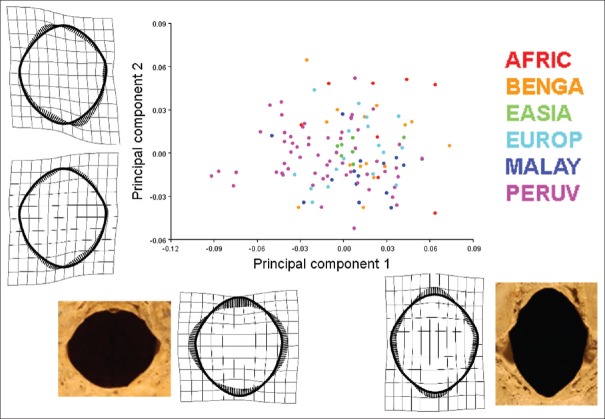
PC analysis comparing the 121 crania sample of adult crania of known populations revealed 54.44% of total shape variation with the first two PCs [Figure 10]. PC1 which explained 36.20% of shape variation, and appeared similar to that of the PCA of the entire population, explained most foraminal shape change as an inverse relationship between the FM boundaries located in the transverse and sagittal dimensions of the foramen. Likewise, PC2, accounting for 17.24% of shape variation, demonstrated shape change as an inverse relationship between the oblique axes of the FM. The shape of the East Asian FM clustered most closely toward the average FM shape, followed by the European and Bengali population [Figure 11]. The African, Bengali, and Malayan populations deviated toward a more elongated FM shape in the sagittal dimension relative to the transverse dimension. The most deviation from the average shape occurred in the Peruvian and African populations [Figure 11].
Figure 10.
Results of a principle components analysis of 121 adult crania sorted into six distinct population groups. The first two principle components account for 54.44% of total shape variation. Principle component 1 accounts for 36.20% of shape variation, and principle component 2 accounts for 17.24% of shape variation. Deformed thin plate splines are displayed along their respective axes. The greatest shape variation, as illustrated by the thin plate splines along principle component 1, is evidenced by an inverse relationship between the sagittal and transverse dimensions of the foramen magnum. The shape variation along the second principle component is characterized by an inverse relationship between the oblique axes of the foramen magnum, that is, between anterior right and posterior left and anterior left and posterior right dimensions. The specimen located at the farthest point in the positive direction along principle component 1 is a cranium of a 70-year-old Bengali male, which possesses a shape that is elongated in the anterior-to-posterior direction relative to a narrow right-to-left dimension. Conversely, the cranium at the farthest negative point along the first principle component that of a 60-year-old Peruvian female is marked by a shape that is narrow in the anterior-to-posterior direction relative to an elongated right-to-left dimension
Figure 11.
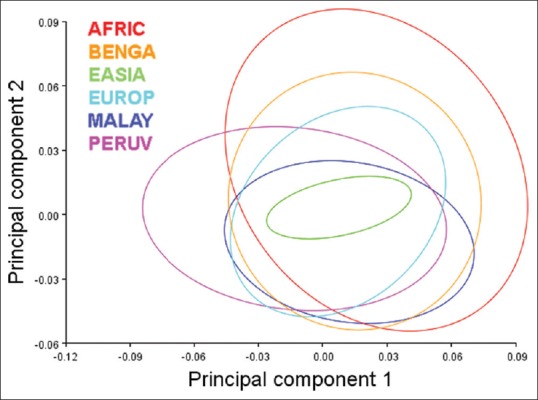
Graph of 90% equal frequency ellipses separated by population corresponding to Figure 10. From the entirety of foramen magnum analyzed, the shape of the East Asian foramina magnums clustered most closely toward the average foramen magnum shape followed by the European and Bengali population. The African, Bengal, and Malayan populations deviated toward a more elongated foramen magnum shape. The most shape variation from the average occurred in the Peruvian and African populations. The Peruvian foramen magnum shape tended toward an approximated basion-to-opisthion dimension relative to a broad transverse dimension whereas, conversely, the African population tended toward a more elongated shape with an expanded basion-to-opisthion dimension relative to a more approximated transverse dimension. The African foramen magnum also had a greater tendency to have greater oblique variation evidenced by the range of shape variation along principle component 2
CV analysis explained 71.42% of shape variance between groups with the first three CVs (CV1: 29.55%; CV2 22.63%; CV3: 19.24%) [Figures 12 and 13]. CV1 demonstrates an inverse relationship between the foraminal boundaries in the transverse and sagittal dimensions, similar to the shape variance illustrated by the first PC from the aforementioned PC analyses. CV2 illustrates a unilateral inverse curve change between the anterior right and posterior right aspects of the foramen [Figure 12]. The first two CVs (52.18% of shape variance, collectively) demonstrated a complete separation of foraminal shape of African-descent (AFRIC) from Bengali (BENGA), East Asian (EASIA), and European-descent (EUROP) populations (Mahalanobis distances of 6.22, 7.50, and 6.21, respectively) [Figure 12]. There was little shape similarity between Peruvian (PERUV), European-decent, Malayan, and African-descent populations relative to the East Asian and Bengali populations along the first two CVs [Figure 12]. The shape change along CV 3 demonstrated an inverse relationship between the posterior left and posterior right aspects of the foramen [Figures 13 and 14]. No overlap in shape variation along CV3 was found between the Malayan and African populations [Figures 13 and 14].
Figure 12.
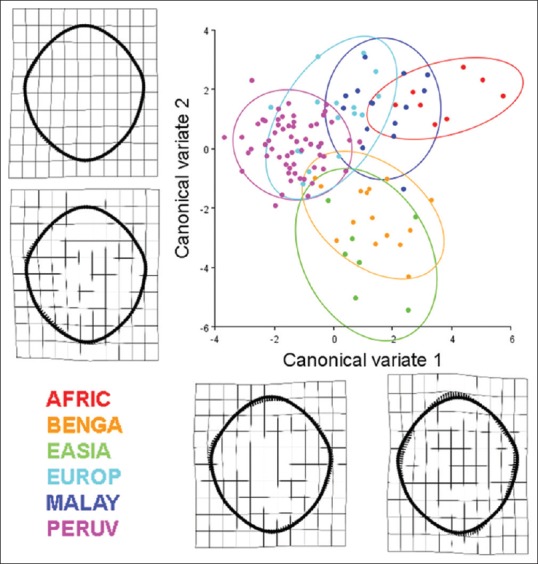
Results of a canonical variate analysis among 121 dry adult human crania separated into six populations (AFRIC: n = 8; BENGA: n = 15; EASIA: n = 7; EUROP: n = 17; MALAY: n = 15; PERUV: n = 59) with 90% confidence ellipses corresponding to each respective population. The first two canonical variates, illustrating the variation among groups (scaled by the inverse of the within-group variation), account for 52.18% of the total variance (canonical variate 1: 29.55% of total variance; canonical variate 2: 22.63% of total variance). Thin plate splines along the canonical variate axes illustrate shape change between the populations. Canonical variate 1 demonstrates an inverse relationship between the sagittal and transverse dimension, especially near the occipital condyles of the foramen magnum. Occipital condyles that encroach into the lumen of the foramen magnum and also bony tubercles located at the basion may influence these parameters. The subtle change along canonical variate 2 is characterized by a unilateral inverse curve change between the anterior right and posterior right aspects of the foramen. With regard to the separation of crania among the different populations, the crania of African-descent (AFRIC) are completely separate from the Bengali (BENGA), East Asian (EASIA), and European-descent (EUROP) populations (Mahalanobis distances of 6.22, 7.50, and 6.21, respectively). Likewise, there is minimal to no overlap between the Peruvian (PERUV), European-decent, Malayan, and African-descent populations relative to the East Asian and Bengali populations. Foramina located near the centroids of the confidence ellipses are presented to illustrate representative samples from each of the six populations
Figure 13.
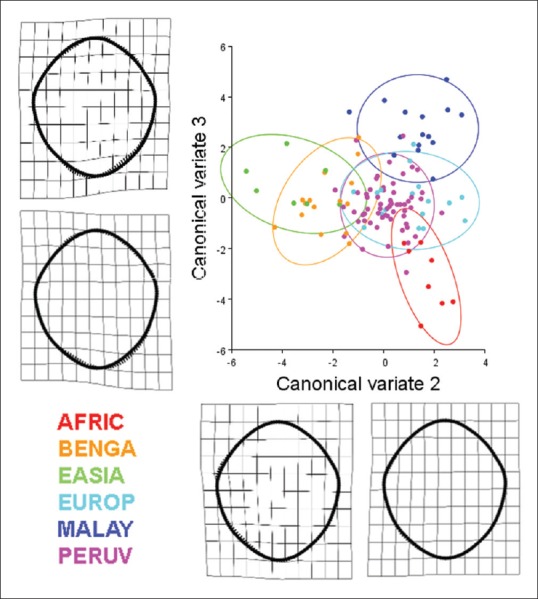
Results of a canonical variate analysis among 121 dry adult human crania separated into six populations (AFRIC: n = 8; BENGA: n = 15; EASIA: n = 7; EUROP: n = 17; MALAY: n = 15; PERUV: n = 59) with 90% confidence ellipses corresponding to each respective population. The second and third canonical variates, illustrating the variation among groups (scaled by the inverse of the within-group variation), account for 41.87% of the total variance (canonical variate 2: 22.63% of total variance; canonical variate 3: 19.24% of total variance). Thin plate splines along the canonical variate axes illustrate shape change between the populations. Canonical variate 2 is characterized by a unilateral inverse curve change between the anterior right and posterior right aspects of the foramen. Canonical variate 3 is mainly characterized by an inverse relationship between the posterior left and posterior right aspects of the foramen. With regard to the separation of crania among the different populations, the crania of African-descent (AFRIC) are completely separate from the, East Asian (EASIA), Peruvian (PERUV), and European-descent (EUROP) populations. Likewise, there is minimal overlap between the African-descent and Bengali populations. The foramen magnum of the Pervuian population was also completely separated from those of the Malayan population. The Bengali population had some overlap with all other populations. Foramina located near the centroids of the confidence ellipses are presented to illustrate representative samples from each of the six populations
Figure 14.
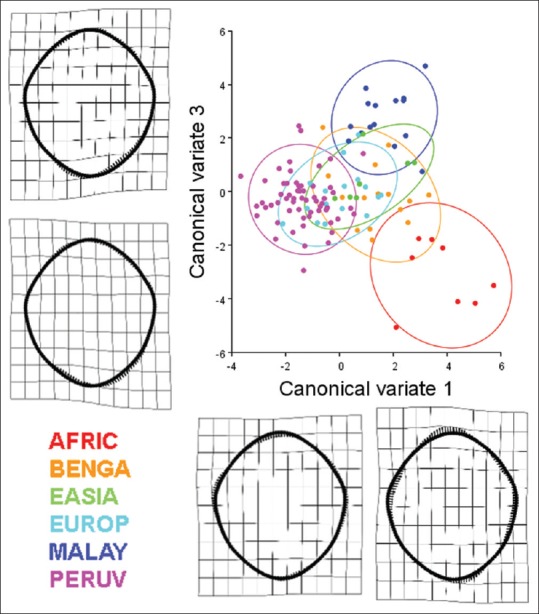
Results of a canonical variate analysis among 121 dry adult human crania separated into six populations (AFRIC: n = 8; BENGA: n = 15; EASIA: n = 7; EUROP: n = 17; MALAY: n = 15; PERUV: n = 59) with 90% confidence ellipses corresponding to each respective population. The first and third canonical variates, illustrating the variation among groups (scaled by the inverse of the within-group variation), account for 48.79% of the total variance (canonical variate 1: 29.55% of total variance; canonical variate 3: 19.24% of total variance). Thin plate splines along the canonical variate axes illustrate shape change between the populations. Canonical variate 1 demonstrates an inverse relationship between the sagittal and transverse dimension, especially near the occipital condyles of the foramen magnum. Occipital condyles that encroach into the lumen of the foramen magnum and also bony tubercles located at the basion may influence these parameters. The shape change along canonical variate 3 is mainly characterized by an inverse relationship between the posterior left and posterior right aspects of the foramen. With regard to the separation of crania among the different populations, the crania of African-descent (AFRIC) are completely separate from the, East Asian (EASIA), Peruvian (PERUV), and European-descent (EUROP) populations. Likewise, there is minimal overlap between the African-descent and Bengali populations. The foramen magnum of the Peruvian population was also completely separated from those of the Malayan population. The Bengali population had some overlap with all other populations. Foramina located near the centroids of the confidence ellipses are presented to illustrate representative samples from each of the six populations
Normative shape descriptor data, including circularity, solidity, aspect ratio, and roundness of each population, are represented in Table 2. Foramen circularity varied from an average of 72.5 ± 0.21% circular (mean ± SD) among the East Asian population to 79.7 ± 0.09% circular in the European population. African crania had, on average, the most oblong foramina having an average aspect ratio of 1.23 (sagittal/transverse), whereas Peruvian foramina had an average aspect ratio of 1.13. With regard to roundness, the Peruvian foramina were the roundest (0.892 ± 0.055) and the African foramina were least round (0.820 ± 0.074). There was a statistically significant difference between both the aspect ratio and the roundness of the Peruvian and African foramina (t = 3.575 (64); P = 0.0007; and t = 3.342 (64); P = 0.0014, respectively) [Figures 15 and 16]. Likewise, both the Peruvian foraminal aspect ratio and roundness were significantly different than those of the Bengali foramina (t = 3.781 (71); P = 0.0003; and t = 3.805 (71); P = 0.0003, respectively) [Figures 15 and 16].
Figure 15.
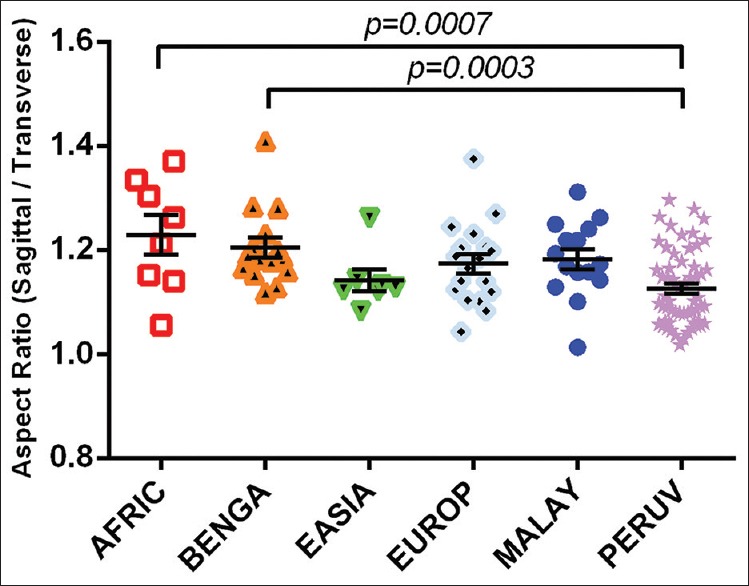
An interpopulation comparison demonstrating statistically significant differences between the aspect ratios of Peruvian foramen magnum with those of crania from individuals of African and Bengali crania. The difference between means of African and Peruvian foramen magnum aspect ratios was 0.10 ± 0.03 (mean ± standard error of the mean). The difference between means of Bengali and Peruvian foramen magnum aspect ratios was 0.08 ± 0.02
Figure 16.
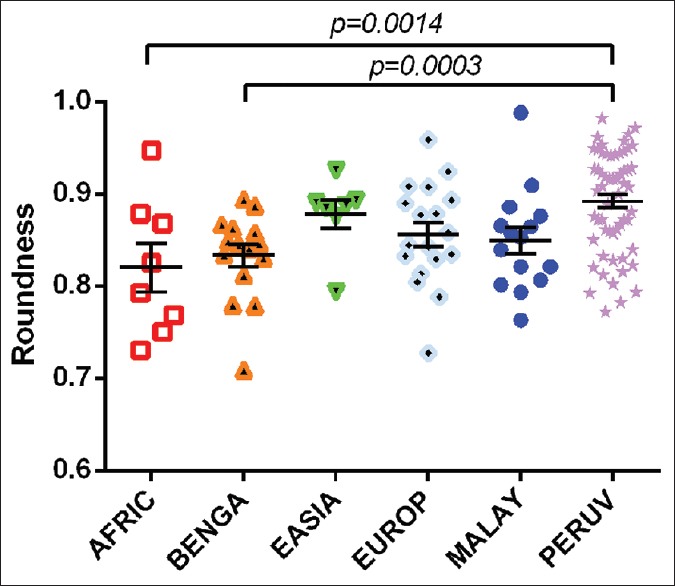
An interpopulation comparison demonstrating statistically significant differences between the roundness of the foramen magnum between Peruvians and roundness of crania from individuals of African and Bengali populations. The difference between means of African and Peruvian foramen magnum roundness was 0.072 ± 0.022 (mean ± standard error of the mean). The difference between means of Bengali and Peruvian foramen magnum roundness was 0.059 ± 0.016
Sexual morphology
Normative shape descriptor data can be found in Table 1. Although males were found to have a significantly larger transverse diameter, sagittal diameter, and area than females, t-tests comparing circularity, solidity, aspect ratio, and roundness did not reveal significant difference in shape between sexes [Table 3]. Likewise, discriminant function analysis revealed no differences in the shape of female and male FM (Procrustes distance = 0.0082; Mahalanobis distance = 2.363; Hotelling's T-square = 148.07; P > 0.999) [Figure 17]. The FM shapes differed among populations; however, analysis of FM shape differences between sexes separated by population revealed similarity of male and female FM shapes in each respective population [Figure 18].
Figure 17.
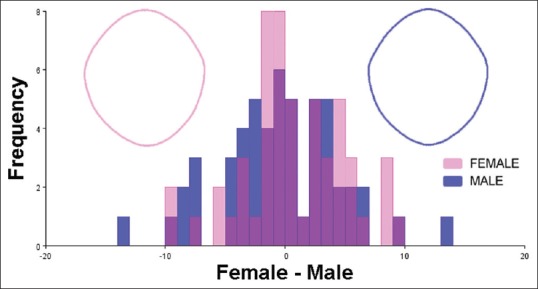
Discriminant function analysis of female and male foramen magnum shapes. Frequencies of discriminant scores predicted by leave-one-out cross-validation are shown as superimposed histograms. Female and male foramen magnum consensus shapes, generated from a population 106 adult crania (53 female crania and 53 male crania, respectively), are demonstrated with wireframe outlines. There was no significant difference between the shape of female and male foramen magnum (Procrustes distance = 0.0082; Mahalanobis distance = 2.363; Hotelling's T-square = 148.07; P > 0.999)
Figure 18.
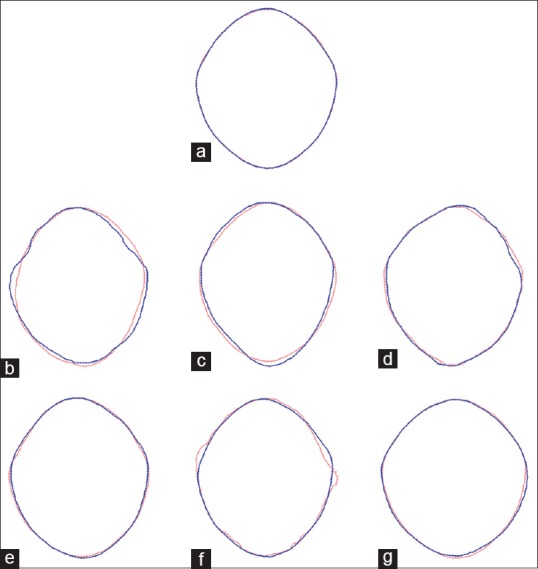
Wireframe outlines of consensus shapes between sexes in different populations demonstrating intrapopulation shape overlap between males and females. The blue outlines represent males and the pink outlines represent females. (a) Total population (n = 106; 53 females; 53 males); (b) AFRIC population (total = 7; male = 3; female = 4); (c) BENGA population (total = 14; male = 6; female = 8); (d) EASIA population (total = 6; male = 3; female = 3); (e) EUROP population (total = 16; male = 9; female = 7); (f) MALAY population (total = 15; male = 14; female = 1); (g) PERUV population (total = 48; male = 18; female = 30)
DISCUSSION
The FM has been established as an important cranial structure with wide-ranging implications for several fields of study. Most morphometric study of the FM has taken into consideration the transverse and sagittal diameters as well as the area encompassed by the margin of the foramen. Likewise, with regard to the morphology of the FM, the FM-index (the aspect ratio between the sagittal and transverse diameters) has largely been the only quantifiable parameter used to assess the shape of the FM. Otherwise, FM shapes have been assigned to categories, but the shape descriptor categories are not uniform between studies, thereby adding difficulty to the interpretation and reproducibility of results. This study is unique in that, in addition to employing quantifiable shape descriptor measurements, it included geometric morphometric analysis to the study of the FM in craniofacially and geographically distinct populations of male and female H. sapiens. The results of this study afford a new perspective to the development of the FM as well as sexual dimorphism and intra- and inter-population morphological variation of the FM size and shape.
Morphometry
The dimensions of the human FM have been related to sex, intracranial volume, and brain size and have, accordingly, been determined to be of great use to several of the anatomical disciplines.[1,2,3,4,5,6,7,8,9,10,11,14,15,16,17,18] Most studies have taken into consideration the transverse and sagittal dimensions of the FM; however, few have appropriately measured area and perimeter parameters that this study has addressed.
Scores of reports have assessed the transverse and sagittal diameters of the FM. However, these reports were largely morphometric studies of within-population variation rather than between-population studies. Assessment of the literature reveals differences in FM dimensions between populations in both transverse and sagittal dimensions and is consistent with the interpopulation differences from this study.
With regard to prior reports, the largest reported mean sagittal FM length for females and males was 36.66 and 40.0 mm, respectively.[21,22] The population of females with the longest mean sagittal length was that of Swiss females,[21] while the population of males with the longest mean sagittal length was that of Kenyan males.[22] This study uncovered several populations of crania with mean sagittal lengths larger than the largest mean sagittal lengths previously reported in the literature. The data from this report revealed females of African, Bengali, and East Asian decent to have mean sagittal lengths of 37.29, 38.52, and 37.6 mm, respectively – all larger than 36.66 mm, the largest reported mean previously recorded. However, these averages were calculated among small sample sizes (n = 4, 9, and 3, respectively) [Table 1]. Likewise, this report revealed that males of African, Bengali, and European descent had mean sagittal lengths larger than 40.0 mm, the largest sagittal length mean previously reported.
The largest reported mean FM transverse lengths were 31.34 mm for females (Swiss population) and 38.00 mm for males (Kenyan population).[21,22] In this study, the Bengali, East Asian, European, and Peruvian female populations had transverse lengths larger than 31.34 mm. Although this report notes several populations with larger average sagittal and transverse than averages previously reported, which may be attributed to differences in mensuration methods, there is a similar trend with regard to the FM index between this study and prior studies, which is evident when comparing the data from a randomized literature review illustrated in Figure 19 to the data from this study illustrated in Figure 20.
Figure 19.
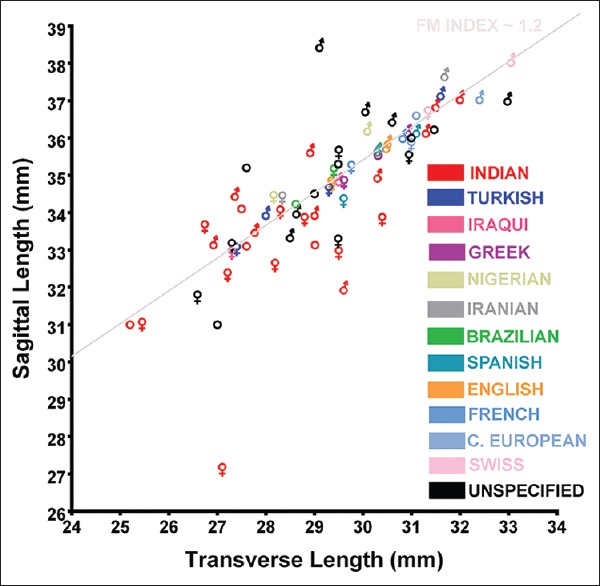
The relationship between the mean transverse and sagittal dimensions of the foramen magnum in different populations and sexes compiled from a random sample of several separate reports. Traditional biological symbols are used to denote male and female. Circles are used to denote data that did not specify sex in the samples studied. A foramen magnum index (sagittal length divided by transverse length) of approximately 1.2 has been arbitrarily superimposed to emphasize an interpopulation and intersex trend in the relationship between the transverse and sagittal dimensions
Figure 20.
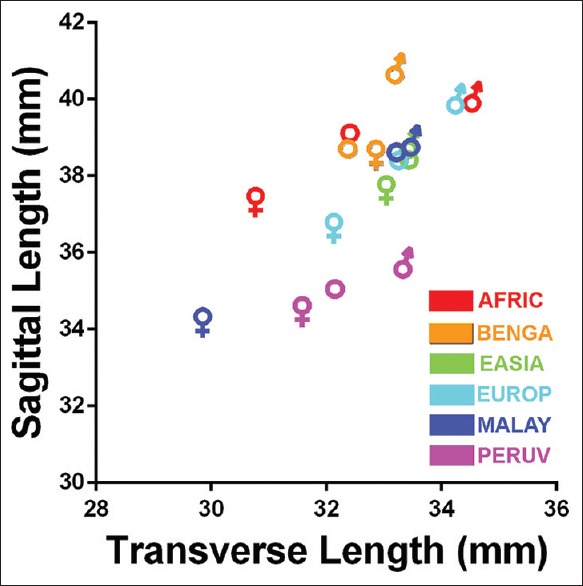
The relationship between mean foramen magnum sagittal and transverse lengths among females and males of African, Bengali, East Asian, European, Malayan, and Peruvian populations. The traditional biological symbols for females and males represent the individual sexes. Open circles represent the averages of all males and females in each population analyzed
There were no significant differences in transverse diameters between populations. However, the sagittal diameter was statistically different between the Peruvian population and all other populations. The difference may be partly attributed to the high incidence of tubercles located at the anterior-most aspect of the FM in the Peruvian population [Figure 21]. Because several bony prominences may be located in the region of the anterior FM such as the condylus tertius (also referred to as the median or third occipital condyle),[42,43,44] pharyngeal tubercle (also referred to as the tubercula basilaria),[45] median spur,[46] and precondylar tubercles (also referred to as the basilar, mamillar, or papillar process),[46,47,48] we refer to this bony structure as the basion tubercle, to eschew any confusion with regard to nomenclature. Indeed, tubercles in the region of the anterior FM have been classified with confusion; for example, a so-called precondylar tubercle has been described as a “bony tubercle on the anterior border of foramen magnum.”[49]
Figure 21.
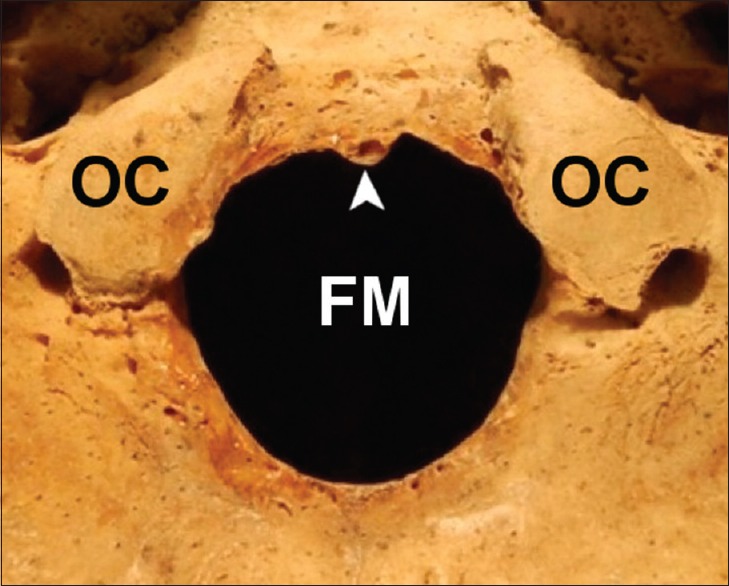
Example of a basion tubercle located at the anterior aspect of the foramen magnum of a 40-year-old female Peruvian cranium. The basion tubercle decreases the sagittal dimension of the foramen magnum. (Arrowhead: Basion tubercle; OC: Occipital condyle; FM: Foramen magnum)
There are several examples of basion tubercles reported in the literature.[42,43,44,45] Oetteking[45] attributes these bony formations to ossification of ligaments at the anterior border of the FM. Further, several different morphological types of basion tubercles have been described including the tubercular, clubbed, and cup-like type.[45] Because the basion tubercle encroaches into the FM at the basion, the basion-to-opisthion distance (i.e., the sagittal dimension) is likely to be diminished when the tubercle is present, thus partly explaining the difference in sagittal diameter between the Peruvian crania and other populations reported herein.
The presence of basion tubercles occurred primarily in the Peruvian crania. In addition to geographical differences between the Peruvian crania and those of the other populations studied, the Peruvians of Pachacamac (e.g., Incans) are known to have practiced intentional cranial deformation that resulted in a brachycephalic cranium. Therefore, forces acting on the cranium that would produce a brachycephalic form may contribute to the formation of the basion tubercle.
There was no difference in the transverse diameters among populations; however, there were significant differences between the sagittal dimension of the Peruvian FM and the sagittal dimensions of all the other populations. The sagittal dimension is, therefore, the most likely contributing factor to the significant differences between the area of the Peruvian FM and the areas of FM from other distinct populations. The sagittal dimension and area of the FM are both particularly important morphometric parameters because the size of the FM represents a bony limitation to the neurovascular structures that are transmitted through the FM. For example, in the setting of elevated intracranial pressure, cerebellar tissue may herniate through the FM, thereby causing displacement and compression of the brainstem with subsequent neurologic deficit. The anatomy of the FM may, therefore, influence cerebellar herniation and the displacement of the brainstem.
With regard to differences between sexes, this study is largely in agreement with prior morphometric studies of the FM. Specifically, the sagittal length, transverse length, and area tend to be larger in males than females. However, unlike prior study of FM morphometrics, this study considered the potential for sexual differences in FM perimeter. The results of this report note no significant difference in FM perimeter between males and females. Since males and females differ between sagittal length, transverse length, and area, but not with regard to perimeter, the quantifiable study of FM shape is further emphasized.
Morphology
The general embryologic development of the FM and the ossification of the chondrocranium, basioccipital, exoccipitals, and supraoccipital are fairly well understood; however, there is a paucity of information concerning the developmental interrelationship between these parts in the context of the ultimate shape of the adult FM. The results of the PCs analyses performed in this study identify the most shape variance of the FM to be that of an inverse relative relationship between the sagittal and transverse dimensions. That is, when the sagittal dimension is long, the transverse dimension is relatively short and vice versa. The second-most variance in FM shape may be explained by an inverse relationship between the oblique axes of the FM, that is, between anterior right and posterior left and anterior left and posterior right dimensions, respectively.
The basicranium is the first cranial region to reach adult size.[50] Likewise, the growth of the basicranium influences the growth of the neurocranium and overall cranial shape.[51] Richards and Jabbour[19] have noted that mean adult sagittal FM lengths are attained by 5 years of age, whereas mean transverse lengths are not attained until 10 years of age. Therefore, FM-indexes are not constant and there is foraminal shape change occurring between the ages of 5 and 10 years. Taking the aforementioned FM developmental milestones into consideration alongside the results from this report regarding adult FM shape variance, we posit a model of FM shape ontogeny.
Because adult anterior and posterior foraminal boundaries are inversely related to the right and left foraminal boundaries, the sagittal growth before age five may be predictive of transverse growth after age five. For example, if the sagittal dimension of the FM is short at age five, then the transverse dimension will be relatively long at age 10, with lateral boundaries that have relatively acute curvature. Conversely, if the sagittal dimension of the FM is long at age five, then the transverse dimension will likely be relatively short at age 10, with lateral boundaries that are relatively approximated, having a more obtuse curvature. Therefore, the developmental timeframe before age five is likely predictive of the most marked shape variance in the adult FM.
In addition, because the shape variations, evidenced by the first two PCs from this analysis, tend to occur in specific vectors, that is, anterior-to-posterior, anterior-right-to-posterior-left, and anterior-left-to-posterior-right, we posit that FM anatomy may be influenced by intrinsic or extrinsic compressive or restrictive forces that occur in similar vectors in early life, such as sleep position and both location and rate of ossification. Positional cranial deformations resulting in brachycephaly, plagiocephaly, and other cranial formations are well-established conditions, wherein cranial shape results from habitual cranial positioning due to gravitational forces acting on the subadult, still-deformable, cranium.[52,53,54] Examples of extreme cranial deformation, such as those that occur as a result of artificial cranial vault deformation, are also known to alter basicranial shape and synchondrosial fusion. For example, anterior-posterior head binding increases the breadth of the lateral cranial base, whereas circumferential binding elongates the FM.[55,56] In the case of artificial deformation, when external stresses are applied in the 1st year of life, the basicranium is deformed; whereas deformations applied after 2–4 years of age have less potential to influence growth of the basicranium.[51] Therefore, external forces applied to the cranium during first few years of life likely have more pronounced influence on the overall shape structure of the adult FM.
The cranial deformation historically practiced by the Pachacamac peoples, represented in part by some of the brachycephalic Peruvian crania studied here, emphasizes the ontogenic mechanism that this report posits. If forces restricting the anterior-posterior expansion of the cranial vault (i.e., glabello-occipital length) occur in early life, the ultimate shape of the adult FM would be rounder, having an aspect ratio closer to that of a circle. Morphometric results suggest that restricting anterior-posterior expansion of the cranium may influence sagittal length, but transverse length is not statistically different than the FM among cultures that do not practice intentional cranial deformation.
The results of this report are also important to take into consideration with regard to positional deformational brachycephaly and plagiocephaly. In 1992, the American Academy of Pediatrics discouraged prone sleeping positions because of its association with sudden infant death syndrome, which prompted the United States Public Health Service to initiate the “Back to Sleep Campaign” (BTSC), a campaign to promote the habitual practice of placing newborns to sleep in a supine or side-lying position. However, after the BTSC was initiated, there was an increased incidence of deformational plagiocephaly.[57,58]
There has been little study or the FM among populations whose sleep habits in early life consisted primarily of supine sleeping (e.g., those individuals under the age of 25 in the United States). Therefore, despite the large body of morphometric data regarding the sagittal and transverse diameters of the FM in varied populations, continued research is warranted to study the effects of sleep practices and cranial deformation on the FM size and shape. This study highlights the potential for significant size and shape differences among different populations – especially between the Peruvian population studied here, reputed to practice intentional cranial deformation, and those populations in which intentional deformation was an uncommon practice. Habitual sleep position, also known to affect cranial structure, may also have an influence on the size and shape of the FM and may be a contributing etiologic factor in the development of the basion tubercle.
Financial support and sponsorship
Nil.
Conflicts of interest
There are no conflicts of interest.
Acknowledgments
The work was made possible through grant funding from the WV Research Challenge Fund [HEPC.dsr. 14.13] and [HEPC.dsr. 17.06] which supported a summer undergraduate research program in which the authors MLR, KNB, KRM, and AWK participated. The work was also made possible through funding from the West Virginia IDeA Network for Biomedical Research Excellence [P20GM103434], and NIH-NIAID [5K22AI087703]. The authors also acknowledge the University of Pennsylvania Museum of Archaeology and Anthropology, the Open Research Scan Archive at the University of Pennsylvania, as well as P. Thomas Schoenemann and Janet Monge for the expansion and improvement of the Penn Cranial CT Database [NSF Award Number 0447271].
REFERENCES
- 1.Teixeira WR. Sex identification utilizing the size of the foramen magnum. Am J Forensic Med Pathol. 1982;3:203–6. doi: 10.1097/00000433-198209000-00003. [DOI] [PubMed] [Google Scholar]
- 2.Holland TD. Use of the cranial base in the identification of fire victims. J Forensic Sci. 1989;34:458–60. [PubMed] [Google Scholar]
- 3.Günay Y, Altinkök M. The value of the size of foramen magnum in sex determination. J Clin Forensic Med. 2000;7:147–9. doi: 10.1054/jcfm.2000.0430. [DOI] [PubMed] [Google Scholar]
- 4.Ahern JC. Foramen magnum position variation in pan troglodytes, plio-pleistocene hominids, and recent Homo sapiens: Implications for recognizing the earliest hominids. Am J Phys Anthropol. 2005;127:267–76. doi: 10.1002/ajpa.20082. [DOI] [PubMed] [Google Scholar]
- 5.Muthukumar N, Swaminathan R, Venkatesh G, Bhanumathy SP. A morphometric analysis of the foramen magnum region as it relates to the transcondylar approach. Acta Neurochir (Wien) 2005;147:889–95. doi: 10.1007/s00701-005-0555-x. [DOI] [PubMed] [Google Scholar]
- 6.Uysal S, Gokharman D, Kacar M, Tuncbilek I, Kosa U. Estimation of sex by 3D CT measurements of the foramen magnum. J Forensic Sci. 2005;50:1310–4. [PubMed] [Google Scholar]
- 7.Galatius A, Berta A, Frandsen MS, Goodall RN. Interspecific variation of ontogeny and skull shape among porpoises (Phocoenidae) J Morphol. 2011;272:136–48. doi: 10.1002/jmor.10900. [DOI] [PubMed] [Google Scholar]
- 8.Uthman AT, Al-Rawi NH, Al-Timimi JF. Evaluation of foramen magnum in gender determination using helical CT scanning. Dentomaxillofac Radiol. 2012;41:197–202. doi: 10.1259/dmfr/21276789. [DOI] [PMC free article] [PubMed] [Google Scholar]
- 9.Raghavendra Babu YP, Kanchan T, Attiku Y, Dixit PN, Kotian MS. Sex estimation from foramen magnum dimensions in an Indian population. J Forensic Leg Med. 2012;19:162–7. doi: 10.1016/j.jflm.2011.12.019. [DOI] [PubMed] [Google Scholar]
- 10.Jain D, Jasuja O, Nath S. Evaluation of foramen magnum in sex determination from human crania by using discriminant function analysis. El Med J. 2014;2:89–92. [Google Scholar]
- 11.Ruth AA, Raghanti MA, Meindl RS, Lovejoy CO. Locomotor pattern fails to predict foramen magnum angle in rodents, strepsirrhine primates, and marsupials. J Hum Evol. 2016;94:45–52. doi: 10.1016/j.jhevol.2016.01.003. [DOI] [PubMed] [Google Scholar]
- 12.Holland TD. Sex determination of fragmentary crania by analysis of the cranial base. Am J Phys Anthropol. 1986;70:203–8. doi: 10.1002/ajpa.1330700207. [DOI] [PubMed] [Google Scholar]
- 13.Russo GA, Kirk EC. Foramen magnum position in bipedal mammals. J Hum Evol. 2013;65:656–70. doi: 10.1016/j.jhevol.2013.07.007. [DOI] [PubMed] [Google Scholar]
- 14.Wanebo JE, Chicoine MR. Quantitative analysis of the transcondylar approach to the foramen magnum. Neurosurgery. 2001;49:934–41. doi: 10.1097/00006123-200110000-00027. [DOI] [PubMed] [Google Scholar]
- 15.Avci E, Dagtekin A, Ozturk AH, Kara E, Ozturk NC, Uluc K, et al. Anatomical variations of the foramen magnum, occipital condyle and jugular tubercle. Turk Neurosurg. 2011;21:181–90. doi: 10.5137/1019-5149.JTN.3838-10.1. [DOI] [PubMed] [Google Scholar]
- 16.Ashton EH, Spence TF. Age changes in the cranial capacity and foramen magnum of hominoids. Proc Zool Soc Lond. 1958;130:169–81. [Google Scholar]
- 17.Radinsky L. Relative brain size – A new measure. Science. 1967;155:836–8. doi: 10.1126/science.155.3764.836. [DOI] [PubMed] [Google Scholar]
- 18.Acer N, Sahin B, Ekinci N, Ergür H, Basaloglu H. Relation between intracranial volume and the surface area of the foramen magnum. J Craniofac Surg. 2006;17:326–30. doi: 10.1097/00001665-200603000-00020. [DOI] [PubMed] [Google Scholar]
- 19.Richards GD, Jabbour RS. Foramen magnum ontogeny in Homo sapiens: A functional matrix perspective. Anat Rec (Hoboken) 2011;294:199–216. doi: 10.1002/ar.21319. [DOI] [PubMed] [Google Scholar]
- 20.Routal RR, Pal GP, Bhagwat SS. Metrical studies with sexual dimorphism in foramen magnum of human crania. J Anat Soc India. 1984;2:85–9. [Google Scholar]
- 21.Edwards K, Viner MD, Schweitzer W, Thali MJ. Sex determination from the foramen magnum. JOFRI. 2013;1:186–92. [Google Scholar]
- 22.Loyal P, Ongeti K, Pulei A, Mandela P, Ogeng'o J. Gender related patterns in the shape and dimensions of the foramen magnum in an adult Kenyan population. Anat J Afr. 2013;2:138–41. [Google Scholar]
- 23.Kamath VG, Muhammed A, Radhakrishna S, Radhakrishna A. Binary logistic regression analysis of foramen magnum dimensions for sex determination. Anat Res Int. 2015;2015:1–9. doi: 10.1155/2015/459428. [DOI] [PMC free article] [PubMed] [Google Scholar]
- 24.Henríquez-Pino J, Cricenti SV, Didio LJ. Morphometry of the foramen magnum and its relantioship to skull types on Brazillian individuals. Rev Chil Anat. 1995;13:159–64. [Google Scholar]
- 25.Aragão JA, de Oliveira Pereira R, de Moraes RZ, Reis FP. Morphological types of foramen magnum. Annu Res Rev Biol. 2014;4:1372. [Google Scholar]
- 26.Sahoo S, Giri SK, Panda SK, Panda P, Chandra Sahu M, Mohapatra C. Morphometric analysis of the foramen magnum and the occipital condyles. Int J Pharm Sci Rev Res. 2015;33:198–204. [Google Scholar]
- 27.Govsa F, Ozer MA, Celik S, Ozmutaf NM. Three-dimensional anatomic landmarks of the foramen magnum for the craniovertebral junction. J Craniofac Surg. 2011;22:1073–6. doi: 10.1097/SCS.0b013e3182107610. [DOI] [PubMed] [Google Scholar]
- 28.Morton SG. Crania Americana: Or a Comparative View of the Skulls of Various Aboriginal Nations of North and South America: To which is Prefixed an Essay on the Varieties of the Human Species. Philadelphia: Dobson; 1839. [PMC free article] [PubMed] [Google Scholar]
- 29.Morton SG. Catalogue of Skulls of Man and the Inferior Animals in the Collection of Samuel George Morton. 3rd ed. Philadelphia: Merrihew AND Thompson; 1849. [Google Scholar]
- 30.Meigs JA. Catalogue of Human Crania, in the Collection of the Academy of Natural Sciences of Philadelphia: Based Upon the Third Edition of Dr. Morton' “Catalogue of Skulls,” & C. Philadelphia: JB Lippincott and Co; 1857. [Google Scholar]
- 31.Blake CC. On the Cranial Characters of the Peruvian Races of Men. Vol. 2. Transactions of the Ethnological Society of London; 1863. pp. 216–31. [Google Scholar]
- 32.Fabian A. The curious cabinet of Dr. Morton. In: Dilworth L, editor. Acts of Possession: Collecting in America. New Brunswick: Rutgers University Press; 2003. pp. 112–37. [Google Scholar]
- 33.Gruber P, Henneberg M, Böni T, Rühli FJ. Variability of human foramen magnum size. Anat Rec (Hoboken) 2009;292:1713–9. doi: 10.1002/ar.21005. [DOI] [PubMed] [Google Scholar]
- 34.Abramoff MD, Magalhaes PJ, Ram SJ. Image Processing with ImageJ. Biophotonics Int. 2004;11:36–42. [Google Scholar]
- 35.Schneider CA, Rasband WS, Eliceiri KW. NIH image to imageJ: 25 years of image analysis. Nat Methods. 2012;9:671–5. doi: 10.1038/nmeth.2089. [DOI] [PMC free article] [PubMed] [Google Scholar]
- 36.Zdilla MJ, Hatfield SA, McLean KA, Cyrus LM, Laslo JM, Lambert HW, et al. Circularity, solidity, axes of a best fit ellipse, aspect ratio, and roundness of the foramen ovale: A morphometric analysis with neurosurgical considerations. J Craniofac Surg. 2016;27:222–8. doi: 10.1097/SCS.0000000000002285. [DOI] [PMC free article] [PubMed] [Google Scholar]
- 37.Rohlf FJ. TpsDig, Version 2.22. 2015 [Google Scholar]
- 38.Adams DC, Otárola-Castillo E. Geomorph: An R package for the collection and analysis of geometric morphometric shape data. Methods Ecol Evol. 2013;4:393–9. [Google Scholar]
- 39.Klingenberg CP. MorphoJ: An integrated software package for geometric morphometrics. Mol Ecol Resour. 2011;11:353–7. doi: 10.1111/j.1755-0998.2010.02924.x. [DOI] [PubMed] [Google Scholar]
- 40.Márquez EJ, Cabeen R, Woods RF, Houle D. The measurement of local variation in shape. Evol Biol. 2012;39:419–39. doi: 10.1007/s11692-012-9159-6. [DOI] [PMC free article] [PubMed] [Google Scholar]
- 41.Zdilla MJ, Fijalkowski KM. The shape of the foramen ovale: A visualization aid for cannulation procedures. J Craniofac Surg. 2017;28:548–51. doi: 10.1097/SCS.0000000000003325. [DOI] [PubMed] [Google Scholar]
- 42.Lakhtakia PK, Premsagar IC, Bisaria KK, Bisaria SD. A tubercle at the anterior margin of the foramen magnum. J Anat. 1991;177:209–10. [PMC free article] [PubMed] [Google Scholar]
- 43.Vazquez JF, Verona JA, Balbas JA, Porrero MG, Ayucar EB. Tubercle at the foramen magnum. Skull Base Surg. 1996;6:169–70. doi: 10.1055/s-2008-1058641. [DOI] [PMC free article] [PubMed] [Google Scholar]
- 44.Prakash BS, Padma Latha K, Menda JL, Ramesh BR. A tubercle at the anterior margin of foramen magnum. Int J Anat Var. 2011;4:118–9. [Google Scholar]
- 45.Oetteking B. On the morphological significance of certain cranio-vertebral variations. Anat Rec. 1923;25:339–53. [Google Scholar]
- 46.Jaffar AA. Anatomical and clinical correlates of the precondylar tubercle. J Morphol Sci. 2014;31:182–6. [Google Scholar]
- 47.Broman GE., Jr Precondylar tubercles in American whites and negroes. Am J Phys Anthropol. 1957;15:125–35. doi: 10.1002/ajpa.1330150114. [DOI] [PubMed] [Google Scholar]
- 48.Vasudeva N, Choudhry R. Precondylar tubercles on the basiocciput of adult human skulls. J Anat. 1996;188(Pt 1):207–10. [PMC free article] [PubMed] [Google Scholar]
- 49.Patil GV, Shishirkumar Bony tubercle on the anterior border of foramen magnum – A case study. IJSR. 2012;3:57–8. [Google Scholar]
- 50.Moore WJ, Lavelle CL. Growth of the Facial Skeleton in the Hominoidea. London: Academic Press; 1974. [Google Scholar]
- 51.Lieberman DE, Pearson OM, Mowbray KM. Basicranial influence on overall cranial shape. J Hum Evol. 2000;38:291–315. doi: 10.1006/jhev.1999.0335. [DOI] [PubMed] [Google Scholar]
- 52.Argenta LC, David LR, Wilson JA, Bell WO. An increase in infant cranial deformity with supine sleeping position. J Craniofac Surg. 1996;7:5–11. doi: 10.1097/00001665-199601000-00005. [DOI] [PubMed] [Google Scholar]
- 53.Martínez-Lage JF, Ruíz-Espejo AM, Gilabert A, Pérez-Espejo MA, Guillén-Navarro E. Positional skull deformities in children: Skull deformation without synostosis. Childs Nerv Syst. 2006;22:368–74. doi: 10.1007/s00381-005-1233-2. [DOI] [PubMed] [Google Scholar]
- 54.Steinberg JP, Rawlani R, Humphries LS, Rawlani V, Vicari FA. Effectiveness of conservative therapy and helmet therapy for positional cranial deformation. Plast Reconstr Surg. 2015;135:833–42. doi: 10.1097/PRS.0000000000000955. [DOI] [PubMed] [Google Scholar]
- 55.McNeill RW, Newton GN. Cranial base morphology in association with intentional cranial vault deformation. Am J Phys Anthropol. 1965;23:241–50. doi: 10.1002/ajpa.1330230312. [DOI] [PubMed] [Google Scholar]
- 56.Antón SC. Intentional cranial vault deformation and induced changes of the cranial base and face. Am J Phys Anthropol. 1989;79:253–67. doi: 10.1002/ajpa.1330790213. [DOI] [PubMed] [Google Scholar]
- 57.Turk AE, McCarthy JG, Thorne CH, Wisoff JH. The “back to sleep campaign” and deformational plagiocephaly: Is there cause for concern? J Craniofac Surg. 1996;7:12–8. doi: 10.1097/00001665-199601000-00006. [DOI] [PubMed] [Google Scholar]
- 58.Branch LG, Kesty K, Krebs E, Wright L, Leger S, David LR, et al. Deformational plagiocephaly and craniosynostosis: Trends in diagnosis and treatment after the “back to sleep” campaign. J Craniofac Surg. 2015;26:147–50. doi: 10.1097/SCS.0000000000001401. [DOI] [PubMed] [Google Scholar]


