

Abstract
Background
Studies assessing the differential impact of sex on outcomes of aortic valve replacement (AVR) yielded conflicting results. We sought to investigate sex‐related differences in AVR utilization, patient risk profile, and in‐hospital outcomes using the Nationwide Inpatient Sample.
Methods and Results
In total, 166 809 patients (63% male and 37% female) who underwent AVR between 2003 and 2014 were identified, and 48.5% had a concomitant cardiac surgery procedure. Compared with men, women were older and had more nonatherosclerotic comorbid conditions including hypertension, diabetes mellitus, obstructive pulmonary disease, atrial fibrillation/flutter, and anemia but fewer incidences of coronary and peripheral arterial disease and prior sternotomies. In‐hospital mortality was significantly higher in women (5.6% versus 4%, P<0.001). Propensity matching was performed to assess the impact of sex on the outcomes of isolated AVR and yielded 28 237 matched pairs of male and female participants. In the propensity‐matched groups, in‐hospital mortality was higher in women (3.3% versus 2.9%, P<0.001). Along with vascular complications and blood transfusion (6% versus 5.6%, P=0.027 and 40.4% versus 33.9%, P<0.001, respectively). Rates of stroke, permanent pacemaker implantation, and acute kidney injury requiring dialysis were similar (2.4% versus 2.4%, P=0.99; 6% versus 6.3%, P=0.15; and 1.4% versus 1.3%, P=0.14, respectively). Length of stay median and interquartile range were both similar between groups (7±6 days). Rates of nonhome discharge were higher among women (27.9% versus 19.6%, P<0.001).
Conclusions
Women have worse in‐hospital mortality following AVR compared with men. Coupled with the accumulating evidence suggesting higher magnitude of benefit of transcatheter AVR over AVR in women, women should perhaps be offered transcatheter AVR over AVR at a lower threshold than men.
Keywords: aortic valve replacement, aortic valve stenosis, disparities, outcome
Subject Categories: Women, Valvular Heart Disease, Aortic Valve Replacement/Transcather Aortic Valve Implantation, Quality and Outcomes
Clinical Perspective
What Is New?
In a large contemporary US database, women underwent aortic valve replacement for aortic stenosis less than men.
Aortic valve replacement in women was associated with worse in‐hospital mortality and higher cost compared with men.
What Are the Clinical Implications?
Women had worse outcomes with aortic valve replacement compared with men, and this was consistent over 12 years.
These data should be considered when assessing suitability of women for transcatheter or surgical aortic valve replacement.
Introduction
Sex‐related differences in the incidence, pathophysiology, presentation, treatment, and outcomes of cardiovascular diseases including aortic stenosis (AS) have been studied extensively.1 Aortic valve replacement (AVR) has historically been the gold standard treatment of calcific AS.2 The outcomes of AVR have improved significantly nationwide in the past decade.3 Several studies have assessed the differential impact of sex on outcomes of AVR but yielded conflicting results.4, 5, 6, 7, 8, 9, 10, 11, 12, 13 The interest in examining the sex gap in AS patients has been renewed with the introduction and widespread adoption of transcatheter AVR (TAVR). Recently, a report from the American College of Cardiology (ACC) and TVT registry and a large meta‐analysis showed superior outcomes with TAVR in women compared with men.1, 14 We hypothesized that female patients have worse outcomes following AVR compared with propensity‐matched male patients. We propose that if our hypothesis is true, perhaps women should be offered TAVR over surgical AVR at a lower threshold compared with men, given the mounting evidence of better outcomes of TAVR in women versus men.
We aimed to utilize a large national database to investigate (1) trends of AVR utilization in women versus men over a 12‐year period, (2) sex differences in risk profile of patients undergoing AVR, (3) in‐hospital morbidity and mortality of AVR in men versus women and (4) the trends of these outcomes over time.
Methods
Study Data
The Nationwide Inpatient Sample (NIS) was used to derive patient‐relevant information between January 2003 and December 2014. The NIS is the largest publicly available all‐payer administrative claims–based database and contains information about patient discharges from ≈1000 nonfederal hospitals in 45 states. It contains clinical and resource utilization information on 5 million to 8 million discharges annually, with safeguards to protect the privacy of individual patients, physicians, and hospitals. These data are stratified to represent ≈20% of US inpatient hospitalizations across different hospital and geographic regions (random sample). National estimates of the entire US hospitalized population were calculated using the Agency for Healthcare Research and Quality sampling and weighting method.
Study Population
Patients with a discharge diagnosis of aortic valve stenosis (International Classification of Diseases, Ninth Revision, Clinical Modification [ICD‐9‐CM] codes 424.1, 395.0, 395.2, 396.2, 746.3) who underwent AVR (ICD‐9‐CM procedure code 35.20 and 35.21) during the study period were identified from the NIS database.
Trends of Utilization and Outcomes of AVR
The trend of surgical AVR during the 12‐year study period were assessed using weighted values (national estimates). The Mann–Kendall test was used to evaluate trends of AVR in male and female patients. Baseline comorbidities were described, and in‐hospital morbidity and mortality were assessed and compared between sexes.
Comparative Outcomes Analysis
To account for potential confounding factors and to reduce the effect of selection bias, a propensity score–matching model was developed using logistic regression to derive 2 matched groups for comparative outcomes analysis. After excluding patients who underwent concomitant cardiac surgery, patients who underwent “isolated” AVR were entered into a nearest neighbor 1:1 variable ratio, parallel, balanced propensity score–matching model using a caliper of 0.01 to ensure perfect matching. Table S1 lists all covariates that we included in the propensity score models. We performed multiple imputations to impute missing values for race (missing in 16% of observations) using the fully conditional specification method (an iterative Markov chain Monte Carlo algorithm) using age, sex, insurance status, comorbid conditions, hospital region, and clinical characteristics. This method adheres to the recommendations provided by the Healthcare Cost and Utilization Project (HCUP)15 for handling missing racial data. To estimate the cost of hospitalization, the NIS data were merged with cost‐to‐charge ratios available from the HCUP. We estimated the cost of each inpatient stay by multiplying the total hospital charge with cost‐to‐charge ratios.
The primary end point was in‐hospital death. Secondary outcomes included procedural mortality (defined as death occurring on the same hospital day as AVR), vascular complications, pacemaker implantation, transient ischemic attack, stroke, blood transfusion, acute kidney injury requiring dialysis, cardiac tamponade, hospital length of stay, cost of hospitalization, and discharge disposition. Subgroup analyses were performed for the outcomes of in‐hospital mortality in the propensity score–matched groups to assess the impact of age, age, race, teaching status, and primary and selected relevant major comorbidities on the differences in mortality between male and female participants.
Statistical Analyses
Descriptive statistics are presented as frequencies with percentages for categorical variables. Mean, standard deviation, median, and interquartile range were reported for continuous measures. Baseline characteristics were compared using a Pearson χ2 test and Fisher exact test for categorical variables and an independent‐samples t test for continuous variables. Trend weights accounting for changes in the NIS sampling design are available only for data between 1998 and 2011. For 2012 and 2013, trend weights were not available, and the standard survey weights were used. Matched categorical variables were presented as frequencies with percentages and compared using the McNemar test. Matched continuous variables were presented as means with standard deviations and compared using a paired‐samples t test. A type I error rate of <0.05 was considered statistically significant. All statistical analyses were performed using SPSS version 24 (IBM Corp) and R, version 3.3.1 (R Foundation for Statistical Computing).
Results
In total, 166 809 patients underwent AVR between 2003 and 2014 (weighted national estimates: 825 721 patients), of whom 105 106 (63%) were male and 61 703 (37%) were female. The utilization disparity in AVR was constant throughout the study period (Figure 1). Baseline characteristic profiles were distinctly different between men and women, as detailed in Table 1. Compared with men, women were older (70±13 versus 67±14 years, P<0.001) and had higher rates of hypertension, diabetes mellitus, chronic obstructive lung disease, and anemia. In contrast, coronary and peripheral arterial disease and history of prior sternotomy were more prevalent in men. The majority of AVRs (67.4%) were performed at teaching hospitals, and 32.8% were performed during an unplanned admission. More women had Medicare/Medicaid insurance compared with men (75.4% versus 63.6%, P<0.001). Bioprosthetic valve utilization increased from 46% in 2003 to 65% in 2014, and this upward trend was similar for men and women (Figure 1). Concomitant cardiac surgery was common (48.5%); men were more likely to undergo simultaneous coronary artery bypass grafting (42.8% versus 33.6%, P<0.001), whereas women were more likely to undergo simultaneous mitral valve replacement (8.7% versus 4.8%, P<0.001). In‐hospital mortality was significantly higher in women than in men (5.6% versus 4%, P<0.001; Table 2). Women had higher rates of vascular complications (5.8% versus 5.5%, P<0.001), permanent pacemaker implantation (7.2% versus 6.6%, P<0.001), and blood transfusion (40.9% versus 35.4%, P<0.001). Rates of stroke were similar in men and women (2.7% versus 2.9%, P=0.096).
Figure 1.
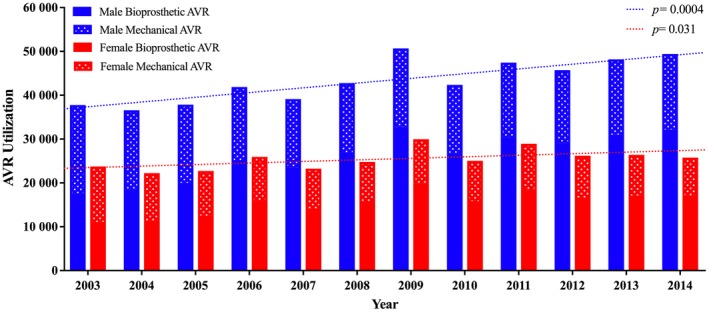
Utilization trends of surgical aortic valve replacement in men and women between 2003 and 2014. AVR indicates aortic valve replacement.
Table 1.
Characteristics of Patients Undergoing Surgical AVR Between 2003 and 2014 (Including Combined Procedures)
| Characteristic | All Patients (n=166 809) | Male (n=105 106) | Female (n=61 703) | P Value |
|---|---|---|---|---|
| Age, y, mean (SD) | 68 (14) | 67 (14) | 70 (13) | <0.0001 |
| Race, n (%) | <0.0001 | |||
| White | 139 714 (83.8) | 87 946 (83.7) | 51 768 (83.9) | |
| Black | 8516 (5.1) | 5186 (4.9) | 3330 (5.4) | |
| Hispanic | 10 084 (6) | 6745 (6.4) | 3339 (5.4) | |
| Medical comorbidity, n (%) | ||||
| Hypertension | 106 535 (63.9) | 66 374 (63.1) | 40 161 (65.1) | <0.0001 |
| Diabetes mellitus | 42 900 (25.7) | 26 503 (25.2) | 16 397 (26.6) | <0.0001 |
| Prior sternotomy | 7195 (4.3) | 5592 (5.3) | 1603 (2.6) | <0.0001 |
| Chronic pulmonary disease | 33 513 (20.1) | 20 342 (19.4) | 13 171 (21.3) | <0.0001 |
| Atrial fibrillation/flutter | 72 999 (43.8) | 45 971 (43.7) | 27 028 (43.8) | 0.794 |
| Cardiogenic shock | 6565 (3.9) | 4051 (3.9) | 2514 (4.1) | 0.026 |
| Anemia | 30 713 (18.4) | 18 366 (17.5) | 12 347 (20) | <0.0001 |
| Coagulopathy | 39 755 (23.8) | 25 040 (23.8) | 14 715 (23.8) | 0.91 |
| Conduction abnormalities | 5438 (3.3) | 3578 (3.4) | 1860 (3) | <0.0001 |
| Peripheral vascular disease | 29 535 (17.7) | 20 115 (19.1) | 9420 (15.3) | <0.0001 |
| Chronic renal disease | 21 029 (12.6) | 14 239 (13.5) | 6790 (11) | <0.0001 |
| Coronary artery disease | 82 622 (49.5) | 55 339 (52.7) | 27 283 (44.2) | <0.0001 |
| Metastatic cancer | 293 (0.2) | 207 (0.2) | 86 (0.1) | 0.007 |
| Liver disease | 2542 (1.5) | 1740 (1.7) | 802 (1.3) | <0.0001 |
| Aortic prosthesis | ||||
| Bioprosthetic | 100 999 (60.50) | 63 399 (60.3) | 37 600 (60.9) | 0.013 |
| Mechanical | 66 005 (39.6) | 41 816 (39.8) | 24 189 (39.2) | 0.019 |
| Concomitant procedures, n (%) | ||||
| Coronary artery bypass | 65 781 (39.4) | 44 960 (42.8) | 20 821 (33.7) | <0.0001 |
| Percutaneous coronary intervention | 699 (0.4) | 461 (0.4) | 238 (0.4) | 0.106 |
| Mitral valve valvuloplasty | 5278 (3.2) | 3406 (3.2) | 1872 (3) | 0.02 |
| Mitral valve replacement | 10 441 (6.3) | 5050 (4.8) | 5391 (8.7) | <0.0001 |
| Annuloplasty | 5278 (3.2) | 3406 (3.2) | 1872 (3) | 0.02 |
| Open ASD\VSD repair | 3403 (2) | 2108 (2) | 1295 (2.1) | 0.194 |
| IABP/LV assist device use | 7462 (4.5) | 4905 (4.7) | 2557 (4.1) | <0.0001 |
| Hospital characteristics, n (%) | ||||
| Teaching hospital | 112 372 (67.4) | 71 079 (67.6) | 41 293 (66.9) | 0.003 |
| Hospital bed size | 0.074 | |||
| Small | 11 249 (6.7) | 6993 (6.7) | 4256 (6.9) | |
| Medium | 30 336 (18.2) | 19 226 (18.3) | 11 110 (18) | |
| Large | 125 224 (75.1) | 78 887 (75.1) | 46 337 (75.1) | |
| Rural location | 5924 (3.6) | 3782 (3.6) | 2142 (3.5) | 0.177 |
| Nonelective admission status, n (%) | 54 717 (32.8) | 34 718 (33) | 19 999 (32.4) | 0.009 |
| Primary payer, n (%) | <0.0001 | |||
| Medicare/Medicaid | 113 333 (67.9) | 66 835 (63.6) | 46 498 (75.4) | |
| Private including HMO | 46 358 (27.8) | 33 143 (31.5) | 13 215 (21.4) | |
| Self‐pay/no charge/other | 7118 (4.3) | 5128 (4.9) | 1990 (3.2) | |
| Median household income, n (%) | <0.0001 | |||
| 0 to 25th percentiles | 35 947 (21.5) | 21 889 (20.8) | 14 058 (22.8) | |
| 26th to 50th percentiles | 43 307 (26) | 26 958 (25.6) | 16 349 (26.5) | |
| 51st to 75th percentiles | 43 431 (26) | 27 572 (26.2) | 15 859 (25.7) | |
| 76th to 100th percentiles | 44 124 (26.5) | 28 687 (27.3) | 15 437 (25) | |
ASD indicates atrial septal defect; AVR, aortic valve replacement; HMO, health maintenance organization; IABP, intra‐aortic balloon pump; LV, left ventricular; VSD, ventricular septal defect.
Table 2.
In‐Hospital Outcomes of Patients Undergoing Surgical AVR Between 2003 and 2014 (Including Combined Procedures)
| All Patients (n=166 809) | Male (n=105 106) | Female (n=61 703) | P Value | |
|---|---|---|---|---|
| Clinical outcome, n (%) | ||||
| In‐hospital death | 7591 (4.6) | 4165 (4) | 3426 (5.6) | <0.0001 |
| Procedural death | 947 (0.6) | 493 (0.5) | 454 (0.7) | <0.0001 |
| Vascular complications | 9392 (5.6) | 5815 (5.5) | 3577 (5.8) | 0.024 |
| Vascular complications requiring surgery | 6810 (4.1) | 4344 (4.1) | 2466 (4) | 0.174 |
| Permanent pacemaker implantation | 11 453 (6.9) | 6980 (6.6) | 4473 (7.2) | <0.0001 |
| Transient ischemic attack | 570 (0.3) | 345 (0.3) | 225 (0.4) | 0.219 |
| Clinical stroke | 4634 (2.8) | 2866 (2.7) | 1768 (2.9) | 0.096 |
| Acute kidney injury | 26 264 (15.7) | 17 432 (16.6) | 8832 (14.3) | <0.0001 |
| Acute kidney injury requiring dialysis | 2934 (1.8) | 1811 (1.7) | 1123 (1.8) | 0.146 |
| Blood transfusion | 62 473 (37.5) | 37 254 (35.4) | 25 219 (40.9) | <0.0001 |
| Cardiac tamponade | 1512 (0.9) | 985 (0.9) | 527 (0.9) | 0.084 |
| Discharge status, n (%) | <0.0001 | |||
| Discharged home | 114 714 (68.8) | 77 727 (74) | 36 987 (59.9) | |
| Discharged SNF/NH/IC | 44 134 (26.5) | 22 996 (21.9) | 21 138 (34.3) | |
| Length of stay, d, median (IQR) | 8 (7) | 8 (7) | 8 (8) | <0.0001 |
| Cost of hospitalization, $, mean (SD) | 56 260 (41 280) | 55 834 (40 937) | 56 985 (41 849) | <0.0001 |
AVR indicates aortic valve replacement; IC, intermediate care; IQR, interquartile range; NH, nursing home; SNF, skilled nursing facility.
Outcomes of Isolated AVR
Among the 166 809 patients who underwent AVR during the study period, 85 975 (51.5%) had isolated AVR. The majority of these patients (60.8%) were men. Baseline characteristics and in‐hospital outcomes of the unmatched groups of men and women who underwent isolated AVR are shown in Tables S2 and S3. Propensity score matching yielded 28 237 matched pairs of male and female patients who underwent isolated AVR (Figure 2). Variables used in propensity matching are listed in Table S1. Baseline characteristics were well matched between groups (Table 3, Figure S1). After propensity matching, in‐hospital mortality remained significantly higher in women than in men (3.3% versus 2.9%, P=0.001; Table 4). Although in‐hospital mortality decreased among both men and women over time, the significant gap between men and women remained constant throughout the study period (Figure 3). Vascular complications and blood transfusions were more frequent in female than male patients (6% versus 5.6%, P=0.027; and 40.4% versus 33.9%, P<0.001, respectively; Table 4). Rates of stroke, permanent pacemaker implantation, and acute kidney injury requiring dialysis were similar in male and female patients (2.4% versus 2.4%, P=0.99; 6.1% versus 6.3%, P=0.36; and 1.4% versus 1.3%, P=0.14, respectively). Length of stay was longer for women (10.1±9.6 versus 9.6±9 days, P<0.001), and rates of nonhome discharge (skilled nursing facility, nursing home, or intermediate care) were higher for women (27.9% versus 19.6%, P<0.001). Cost of hospitalization was similar for the 2 groups ($50 111±24 372 for women versus $49 774±34 701 for men, P=0.248).
Figure 2.
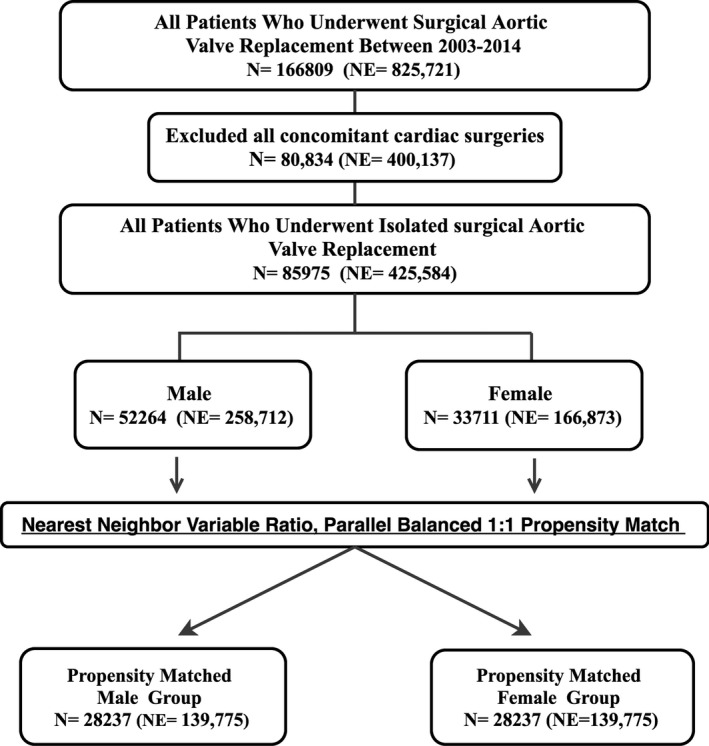
Study flow chart. NE indicates national estimate.
Table 3.
Characteristics of Propensity Score–Matched Patients Undergoing Isolated Surgical AVR Between 2003 and 2014
| Characteristic | Male (n=28 237) | Female (n=28 237) | P Value |
|---|---|---|---|
| Age, y, mean (SD) | 68 (13.3) | 68 (14.1) | 0.561 |
| Race, n (%) | 0.988 | ||
| White | 23 721 (84) | 23 732 (84) | |
| Black | 1475 (5.2) | 1469 (5.2) | |
| Hispanic | 1591 (5.6) | 1560 (5.5) | |
| Medical comorbidity, n (%) | |||
| Hypertension | 18 255 (64.6) | 18 278 (64.7) | 0.846 |
| Diabetes mellitus | 6757 (23.9) | 6774 (24) | 0.874 |
| Prior sternotomy | 1017 (3.6) | 960 (3.4) | 0.262 |
| Chronic pulmonary disease | 5713 (20.2) | 5708 (20.2) | 0.966 |
| Atrial fibrillation/flutter | 11 429 (40.5) | 11 537 (40.9) | 0.354 |
| Cardiogenic shock | 716 (2.5) | 687 (2.4) | 0.45 |
| Anemia | 5259 (18.6) | 5293 (18.7) | 0.72 |
| Coagulopathy | 6166 (21.8) | 6136 (21.7) | 0.767 |
| Conduction abnormalities | 936 (3.3) | 924 (3.3) | 0.796 |
| Peripheral vascular disease | 4586 (16.2) | 4634 (16.4) | 0.586 |
| Chronic renal disease | 2781 (9.8) | 2782 (9.9) | 0.99 |
| Coronary artery disease | 6905 (24.5) | 6943 (24.6) | 0.714 |
| Metastatic cancer | 41 (0.1) | 39 (0.1) | 0.911 |
| Liver disease | 368 (1.3) | 375 (1.3) | 0.825 |
| Aortic prosthesis | |||
| Bioprosthetic | 16 954 (60) | 16 961 (60.1) | 0.958 |
| Mechanical | 11 324 (40.1) | 11 313 (40.1) | 0.931 |
| Concomitant procedures, n (%) | |||
| Percutaneous coronary intervention | 109 (0.4) | 103 (0.4) | 0.73 |
| IABP/LV assist device use | 549 (1.9) | 529 (1.9) | 0.557 |
| Hospital characteristics, n (%) | |||
| Teaching hospital | 19 207 (68) | 19 207 (68) | 0.99 |
| Hospital bed size | 0.617 | ||
| Small | 1874 (6.6) | 1868 (6.6) | |
| Medium | 5075 (18) | 5068 (17.9) | |
| Large | 21 288 (75.4) | 21 301 (75.4) | |
| Rural location | 1012 (3.6) | 1029 (3.6) | 0.719 |
| Nonelective admission status, n (%) | 7957 (28.2) | 7968 (28.2) | 0.962 |
| Primary payer, n (%) | 0.165 | ||
| Medicare/Medicaid | 19 489 (69) | 19 301 (68.4) | |
| Private including HMO | 7648 (27.1) | 7818 (27.7) | |
| Self‐pay/no charge/other | 1100 (3.9) | 1118 (4) | |
| Median household income, n (%) | 0.866 | ||
| 0 to 25th percentiles | 6257 (22.2) | 6232 (22.1) | |
| 26th to 50th percentiles | 7303 (25.9) | 7342 (26) | |
| 51st to 75th percentiles | 7357 (26.1) | 7352 (26) | |
| 76th to 100th percentiles | 7320 (25.9) | 7311 (25.9) | |
AVR indicates aortic valve replacement; HMO, health maintenance organization; IABP, intra‐aortic balloon pump; LV, left ventricular.
Table 4.
In‐Hospital Outcomes of Propensity Score–Matched Patients Undergoing Isolated Surgical AVR Between 2003 and 2014
| Male (n=28 237) | Female (n=28 237) | P Value | |
|---|---|---|---|
| Clinical outcome, n (%) | |||
| In‐hospital death | 806 (2.9) | 943 (3.3) | 0.001 |
| Procedural death | 87 (0.3) | 117 (0.4) | 0.042 |
| Vascular complications | 1581 (5.6) | 1705 (6) | 0.027 |
| Vascular complications requiring surgery | 1178 (4.2) | 1237 (4.4) | 0.228 |
| Permanent pacemaker implantation | 1686 (6) | 1769 (6.3) | 0.15 |
| Transient ischemic attack | 108 (0.4) | 81 (0.3) | 0.059 |
| Clinical stroke | 682 (2.4) | 682 (2.4) | 0.99 |
| Acute kidney injury | 3881 (13.7) | 2968 (10.5) | <0.0001 |
| Acute kidney injury requiring dialysis | 404 (1.4) | 363 (1.3) | 0.144 |
| Blood transfusion | 9563 (33.9) | 11 386 (40.4) | <0.0001 |
| Cardiac tamponade | 267 (0.9) | 209 (0.7) | 0.009 |
| Discharge status, n (%) | <0.0001 | ||
| Discharged home | 21 831 (77.3) | 19 342 (68.5) | |
| Discharged SNF/NH/IC | 5545 (19.6) | 7882 (27.9) | |
| Length of stay, d, median (IQR) | 7 (6) | 7 (6) | <0.0001 |
| Cost of hospitalization, $, mean (SD) | 49 774 (34 701) | 50 111 (24 372) | 0.248 |
AVR indicates aortic valve replacement; IC, intermediate care; IQR, interquartile range; NH, nursing home; SNF, skilled nursing facility.
Figure 3.

Trends of in‐hospital mortality following isolated surgical aortic valve replacement in men and women between 2003 and 2014.
A subgroup analysis of the propensity score–matched cohorts showed that the differential impact of sex on in‐hospital mortality was consistent among subcohorts of patients stratified based on age (<65 versus >65 years); hospital teaching status; race; insurance status; and the presence of diabetes mellitus, peripheral vascular disease, or atrial fibrillation (Figure S2).
Sensitivity Analysis
To further assess for residual confounding, a rule‐out approach to sensitivity analysis was used to illustrate how strongly a single unmeasured confounder would need to be associated with female sex and a significant outcome end point to fully explain our findings (Figure S3).16 To fully explain the observed difference in blood transfusion rates between male and female patients undergoing AVR, a confounder would have to be 2 times more likely to be associated with female than male sex and, concurrently, increase the risk of blood transfusion by 6 times.
Discussion
The major findings of the current investigations are as follows. First, men undergo surgical AVR for AS more than women, Second, women who underwent AVR in the United States between 2003 and 2014 were older and had distinctive risk profiles and demographics compared with men. Third, women had higher unadjusted and adjusted in‐hospital mortality following AVR than men, and this was consistent over time. Fourth, after risk adjustment, women had more vascular complications and blood transfusions than men and were more likely to be discharged to a skilled nursing facility, nursing home, or intermediate care center.
The higher utilization of AVR in men compared with women in this study (63% versus 37%, P<0.001) is consistent with previous studies.17, 18, 19 Several plausible explanations can be postulated from the existing literature. Regarding disparity in the incidence of AS, historical echocardiographic data showed that the risk of developing AS was 2‐fold higher in men than in women20; however, nationwide claim‐based studies in hospitalized patients showed a less pronounced disparity in AS diagnosis between men and women. Among 113 847 patients admitted with an aortic valve disorder diagnosis in the United States, 55.1% were men.21 A similar study in Sweden showed that men constituted 52% of all patients newly diagnosed with AS.22 Even a lower incidence of new AS diagnosis in men was observed in a large Scottish registry of 19 733 patients, of whom 46.8% were men.23 Regarding disparity in referral for testing, women with AS were less likely to be seen by a specialist and less likely to be referred for testing.19 Regarding disparity in referral to surgery, women diagnosed with AS had unfavorable preoperative baseline characteristics compared with men at the time of presentation and thus were less likely to be referred to surgical treatment.4, 9, 24 Interestingly, this disparity in referral to valve replacement is not seen with the current TAVR practice; in the United States and Germany, women composed 52% and 55%, respectively, of all patients undergoing TAVR, respectively.25, 26 Furthermore, compared with women, men had much higher prevalence of coronary artery disease (52.7% versus 44.2%, P<0.001) and were more likely to undergo coronary artery bypass grafting (42.8% versus 33.7%, P<0.001). Although speculative, perhaps many men underwent AVR for lesser degrees of aortic valve disease at the time of coronary bypass, contributing to the larger number of men undergoing AVR overall. The disparity of AVR utilization in women seems to be more pronounced in the most recent year (Figure 1). This could be related to the introduction of TAVR. Since TAVR became commercially available in the United States in 2011, women have been referred more often to TAVR versus AVR compared with men (Figure S4). This may explain the later divergence of utilization trends of AVR between men and women (Figure 1).
In line with the majority of previous studies, we found distinctive risk profiles for men and women undergoing AVR.4, 6, 11, 12, 17, 27 Women undergoing AVR (isolated or combined) were older and had more nonatherosclerotic comorbid conditions at presentation including hypertension, diabetes mellitus, chronic obstructive pulmonary disease, atrial fibrillation/flutter, and anemia compared with men. In contrast, men presented with higher incidences of coronary and peripheral arterial disease and prior sternotomies. The impact of sex on the pathophysiology of valvular heart disease has not been studied extensively. In addition, the focus of research on this topic has been to investigate sex differences in ventricular responses to pressure and volume overload posed by valvular disease rather than evaluating differences in the mechanism of AS itself.28 Nevertheless, 3 recent studies found important differences between men and women with regard to the development, extent, and progression of aortic valve calcifications supporting sex‐related differences in the mechanism of AS.29, 30, 31 Our findings of distinct risk profiles between men and women with AS at a community level support this notion and call for further research in sex‐specific disease mechanisms.
To date, there is no contemporary large‐scale study assessing sex‐related differences in clinical outcomes following AVR. Evidence from the available series conflicts with older studies showing no difference in post‐AVR mortality between men and women and more contemporary studies showing worse short‐ and long‐term outcomes in women compared with men (Table S4). In this real‐world study of 166 809 patients, in‐hospital mortality was significantly higher in women compared with men following both combined AVR (odds ratio: 1.4; 95% confidence interval [CI], 1.36–1.49; P<0.0001) and isolated AVR (unadjusted odds ratio: 1.3; 95% CI, 1.45–1.39; P<0.0001; adjusted odds ratio: 1.2; 95% CI, 1.07–1.29; P=0.001). The higher mortality rate in women was consistent throughout the 12‐year study period and was seen among most subgroups of patients (Figure S2). Compared with men, women had more vascular complications and blood transfusions but similar rates of stroke, permanent pacemaker implantation, and acute kidney injury requiring dialysis. Although cost of hospitalization was similar, resource utilization was higher for women because of the significantly higher need for intermediate care or skilled nursing after discharge (27.9% versus 19.6%, P<0.001). This could be related to the higher incidence of vascular complications and blood transfusions in women but also could be related to the higher incidence of frailty among older women with AS.32
The discussion of our findings would be incomplete without alluding to the emerging data demonstrating superior outcomes of TAVR in women compared with men and a higher magnitude of benefit of TAVR versus surgical AVR in women than in men.1, 14, 24, 33 A large report from the ACC/TVT registry examined sex differences among 11 808 patients who underwent TAVR and found no difference in in‐hospital mortality in women versus men after TAVR but significantly better 1‐year mortality in women versus men (adjusted hazard ratio: 0.73; 95% CI, 0.63–0.85; P<0.001).14 Similarly, in a patient‐level meta‐analysis including 11 310 patients, women had similar mortality to men at 30 days but had significantly better long‐term survival (adjusted hazard ratio: 0.79; 95% CI, 0.73–0.86; P=0.001), despite higher rates of in‐hospital complications.1 A subgroup analysis of the PARTNER trial showed that women who underwent TAVR had better short‐term (6.8% versus 13.1%; P=0.07) and long‐term (hazard ratio: 0.67; 95% CI, 0.44–1.0; P=0.049) mortality compared with women who underwent AVR.24 Likewise, a subgroup analysis of the pivotal CoreValve trial showed superior 1‐year survival in women who underwent TAVR versus those who underwent AVR (12.7% versus 21.8%; P=0.03).33 It is worth noting that in this study, we found that ≈28% of isolated AVRs were performed during nonelective admissions (Table 3). Isolated AVR during a nonelective admission is associated with a 43% increase in cost ($217 660±187 318 versus $151 817±124 094, P<0.001). Further studies are needed to assess the impact of procedural status (elective versus nonelective) on cost of AVR in the TAVR era.
Limitations
This study has a number of limitations. First, the NIS is an administrative database that aims to gather data for billing purposes and can be limited by erroneous coding; however, the HCUP quality control measures should minimize these possibilities. Furthermore, the hard clinical end points used in our analysis are difficult to miscode. Second, the NIS allows detailed assessment of in‐hospital outcomes; however, certain laboratory and echocardiographic data as well as some procedural details such as aortic valve gradient, valve size, and ejection fractions are not captured. In addition, long‐term mortality data are unavailable in this database. Third, the potential for unmeasured confounders may bias the outcome results in the propensity score–matched cohorts; however, we believe that our rigorous propensity matching and the sensitivity analysis adequately addressed this selection bias.
Conclusion
In a contemporary nationwide analysis, AVR is performed less often in women then in men. Women also have worse in‐hospital mortality and are more likely to be discharged to a nursing home or intermediate care facility compared with men. These data, coupled with the accumulating evidence suggesting superiority of TAVR over AVR in women, underscore the need for a rigorous controlled trial specifically in female patients to properly study mortality differences between treatment modalities.
Disclosures
None.
Supporting information
Table S1. Variables Used for Propensity Score Matching
Table S2. Characteristics of Patients Undergoing Isolated Surgical Aortic Valve Replacement Between 2003 and 2014
Table S3. In‐Hospital Outcomes of Patients Undergoing Isolated Surgical Aortic Valve Replacement Between 2003 and 2014
Table S4. Summary of the Literature on Sex Disparity Following Surgical and Transcatheter Aortic Valve Replacement
Figure S1. Standardized mean differences before and after propensity score matching.
Figure S2. Subgroup analysis of sex disparity in in‐hospital mortality following isolated surgical aortic valve replacement (male used as a reference group).
Figure S3. Sensitivity analysis for required strength of an unmeasured confounder. Each line splits the area into 2: The upper right corner of the graph above the confines of a line represents all parameter combinations of an association between an unmeasured confounder and the treatment (aortic valve replacement [AVR] in female patients; y‐axis) with the outcome (blood transfusion; x‐axis) required to move the measured odds ratio (OR) to null. Conversely, the lower left corner represents all parameter combinations of an association between an unmeasured confounder and the treatment and outcome that would not move the measure OR to null.
Figure S4. Proportion of TAVR and SAVR among men and women who underwent aortic valve replacement since commercial approval of TAVR. SAVR indicates surgical aortic valve replacement; TAVR, transcatheter aortic valve replacement.
(J Am Heart Assoc. 2017;6:e006370 DOI: 10.1161/JAHA.117.006370.)28935681
References
- 1. O'Connor SA, Morice MC, Gilard M, Leon MB, Webb JG, Dvir D, Rodes‐Cabau J, Tamburino C, Capodanno D, D'Ascenzo F, Garot P, Chevalier B, Mikhail GW, Ludman PF. Revisiting sex equality with transcatheter aortic valve replacement outcomes. A collaborative, patient‐level meta‐analysis of 11,310 patients. J Am Coll Cardiol. 2015;66:221–228. [DOI] [PubMed] [Google Scholar]
- 2. Joseph J, Naqvi SY, Giri J, Goldberg S. Aortic stenosis: pathophysiology, diagnosis, and therapy. Am J Med. 2016;130:253–263. [DOI] [PubMed] [Google Scholar]
- 3. Thourani VH, Suri RM, Gunter RL, Sheng S, O'Brien SM, Ailawadi G, Szeto WY, Dewey TM, Guyton RA, Bavaria JE, Babaliaros V, Gammie JS, Svensson L, Williams M, Badhwar V, Mack MJ. Contemporary real‐world outcomes of surgical aortic valve replacement in 141,905 low‐risk, intermediate‐risk, and high‐risk patients. Ann Thorac Surg. 2015;99:55–61. [DOI] [PubMed] [Google Scholar]
- 4. Fuchs C, Mascherbauer J, Rosenhek R, Pernicka E, Klaar U, Scholten C, Heger M, Wollenek G, Czerny M, Maurer G, Baumgartner H. Gender differences in clinical presentation and surgical outcome of aortic stenosis. Heart. 2010;96:539–545. [DOI] [PubMed] [Google Scholar]
- 5. Conrotto F, D'Ascenzo F, Salizzoni S, Presbitero P, Agostoni P, Tamburino C, Tarantini G, Bedogni F, Nijhoff F, Gasparetto V, Napodano M, Ferrante G, Rossi ML, Stella P, Brambilla N, Barbanti M, Giordana F, Grasso C, Biondi Zoccai G, Moretti C, D'Amico M, Rinaldi M, Gaita F, Marra S. A gender based analysis of predictors of all cause death after transcatheter aortic valve implantation. Am J Cardiol. 2014;114:1269–1274. [DOI] [PubMed] [Google Scholar]
- 6. Duncan Al, Lin J, Koch CG, Gillinov AM, Xu M, Starr NJ. The impact of gender on in‐hospital mortality and morbidity after isolated aortic valve replacement. Anesth Analg. 2006;103:800–808. [DOI] [PubMed] [Google Scholar]
- 7. Buchanan GL, Chieffo A, Montorfano M, Maisano F, Latib A, Godino C, Cioni M, Gullace MA, Franco A, Gerli C, Alfieri O, Colombo A. The role of sex on VARC outcomes following transcatheter aortic valve implantation with both Edwards SAPIEN TM and Medtronic CoreValve Revalving System devices: the Milan registry. EuroIntervention. 2011;7:556–563. [DOI] [PubMed] [Google Scholar]
- 8. Morris JJ, Schaff HV, Mullany CJ, Morris PB, Frye RL, Orszulak TA. Gender differences in left ventricular functional response to aortic valve replacement. Circulation. 1994;90:II183–II189. [PubMed] [Google Scholar]
- 9. Bech‐Hanssen O, Wallentin I, Houltz E, Beckman Suurkula M, Larsson S, Caidahl K. Gender differences in patients with severe aortic stenosis: impact on preoperative left ventricular geometry and function, as well as early postoperative morbidity and mortality. Eur J Cardiothorac Surg. 1999;15:24–30. [DOI] [PubMed] [Google Scholar]
- 10. Hamed O, Persson PJ, Engel AM, McDonough S, Smith JM. Gender differences in outcomes following aortic valve replacement surgery. Int J Surg. 2009;7:214–217. [DOI] [PubMed] [Google Scholar]
- 11. Aranki SF, Rizzo RJ, Couper GS, Adams DH, Collins JJ Jr, Gildea JS, Kinchla NM, Cohn LH. Aortic valve replacement in the elderly. Effect of gender and coronary artery disease on operative mortality. Circulation. 1993;88:17–23. [PubMed] [Google Scholar]
- 12. Ibrahim MF, Paparella D, Ivanov J, Buchanan MR, Brister SJ. Gender‐related differences in morbidity and mortality during combined valve and coronary surgery. J Thorac Cardiovasc Surg. 2003;126:959–964. [DOI] [PubMed] [Google Scholar]
- 13. Doenst T, Ivanov J, Borger MA, David TE, Brister SJ. Sex‐specific long‐term outcomes after combined valve and coronary artery surgery. Ann Thorac Surg. 2006;81:1632–1636. [DOI] [PubMed] [Google Scholar]
- 14. Chandrasekhar J, Dangas G, Yu J, Vemulapalli S, Suchindran S, Vora AN, Baber U, Mehran R. Sex‐based differences in outcomes with transcatheter aortic valve therapy: TVT registry from 2011 to 2014. J Am Coll Cardiol. 2016;68:2733–2744. [DOI] [PubMed] [Google Scholar]
- 15. Houchens R. Missing Data Methods for the NIS and the SID. HCUP Methods Series Report # 2015‐01. http://www.hcup-us.ahrq.gov/reports/methods/methods.jsp. Agency for Healthcare Research and Quality. Published January 22, 2015. Accessed January 1, 2017. [Google Scholar]
- 16. Schneeweiss S. Sensitivity analysis and external adjustment for unmeasured confounders in epidemiologic database studies of therapeutics. Pharmacoepidemiol Drug Saf. 2006;15:291–303. [DOI] [PubMed] [Google Scholar]
- 17. Kulik A, Lam BK, Rubens FD, Hendry PJ, Masters RG, Goldstein W, Bédard P, Mesana TG, Ruel M. Gender differences in the long‐term outcomes after valve replacement surgery. Heart. 2009;95:318–326. [DOI] [PubMed] [Google Scholar]
- 18. Elhmidi Y, Piazza N, Mazzitelli D, Wottke M, Lange R, Bleiziffer S. Sex‐related differences in 2197 patients undergoing isolated surgical aortic valve replacement. J Card Surg. 2014;29:772–778. [DOI] [PubMed] [Google Scholar]
- 19. Bach DS, Radeva JI, Birnbaum HG, Fournier AA, Tuttle EG. Prevalence, referral patterns, testing, and surgery in aortic valve disease: leaving women and elderly patients behind? J Heart Valve Dis. 2007;16:362–369. [PubMed] [Google Scholar]
- 20. Stewart BF, Siscovick D, Lind BK, Gardin JM, Gottdiener JS, Smith VE, Kitzman DW, Otto CM. Clinical factors associated with calcific aortic valve disease. J Am Coll Cardiol. 1997;29:630–634. [DOI] [PubMed] [Google Scholar]
- 21. Badheka AO, Singh V, Patel NJ, Arora S, Patel N, Thakkar B, Jhamnani S, Pant S, Chothani A, Macon C, Panaich SS, Patel J, Manvar S, Savani C, Bhatt P, Panchal V, Patel N, Patel A, Patel D, Lahewala S, Deshmukh A, Mohamad T, Mangi AA, Cleman M, Forrest JK. Trends of hospitalizations in the United States from 2000 to 2012 of patients >60 years with aortic valve disease. Am J Cardiol. 2015;116:132–141. [DOI] [PubMed] [Google Scholar]
- 22. Martinsson A, Li X, Andersson C, Nilsson J, Smith JG, Sundquist K. Temporal trends in the incidence and prognosis of aortic stenosis: a nationwide study of the Swedish population. Circulation. 2015;131:988–994. [DOI] [PubMed] [Google Scholar]
- 23. Berry C, Lloyd SM, Wang Y, Macdonald A, Ford I. The changing course of aortic valve disease in Scotland: temporal trends in hospitalizations and mortality and prognostic importance of aortic stenosis. Eur Heart J. 2013;34:1538–1547. [DOI] [PubMed] [Google Scholar]
- 24. Williams M, Kodali SK, Hahn RT, Humphries KH, Nkomo VT, Cohen DJ, Douglas PS, Mack M, McAndrew TC, Svensson L, Thourani VH, Tuzcu EM, Weissman NJ, Kirtane AJ, Leon MB. Sex‐related differences in outcomes after transcatheter or surgical aortic valve replacement in patients with severe aortic stenosis. Insights from the PARTNER Trial (Placement of Aortic Transcatheter Valve). J Am Coll Cardiol. 2014;63:1522–1528. [DOI] [PubMed] [Google Scholar]
- 25. Holmes DR Jr, Brennan JM, Rumsfeld JS, Dai D, O'Brien SM, Vemulapalli S, Edwards FH, Carroll J, Shahian D, Grover F, Tuzcu EM, Peterson ED, Brindis RG, Mack MJ. Clinical outcomes at 1 year following transcatheter aortic valve replacement. JAMA. 2015;313:1019–1028. [DOI] [PubMed] [Google Scholar]
- 26. Eggebrecht H, Bestehorn M, Haude M, Schmermund A, Bestehorn K, Voigtländer T, Kuck KH, Mehta RH. Outcomes of transfemoral transcatheter aortic valve implantation at hospitals with and without on‐site cardiac surgery department: insights from the prospective German aortic valve replacement quality assurance registry (AQUA) in 17 919 patients. Eur Heart J. 2016;37:2240–2248. [DOI] [PubMed] [Google Scholar]
- 27. Valencia‐Serrano FM, Cabrera‐Bueno F, Rodríguez‐Bailón I, Sánchez‐Espín G, Such M, Orrit J, Porras C, Melero JM. Influence of sex on perioperative outcomes in patients undergoing valve replacement for severe aortic stenosis. Rev Esp Cardiol (Engl Ed). 2009;62:31–38. [PubMed] [Google Scholar]
- 28. Shames S, Gillam LD. Sex differences in aortic valve calcification. Circ Cardiovasc Imaging. 2013;6:8–10. [DOI] [PubMed] [Google Scholar]
- 29. Nguyen V, Mathieu T, Melissopoulou M, Cimadevilla C, Codogno I, Huart V, Duval X, Vahanian A, Messika‐Zeitoun D. Sex differences in the progression of aortic stenosis and prognostic implication: the COFRASA‐GENERAC Study. JACC Cardiovasc Imaging. 2016;9:499–501. [DOI] [PubMed] [Google Scholar]
- 30. Thaden JJ, Nkomo VT, Suri RM, Maleszewski JJ, Soderberg DJ, Clavel MA, Pislaru SV, Malouf JF, Foley TA, Oh JK, Miller JD, Edwards WD, Enriquez‐Sarano M. Sex‐related differences in calcific aortic stenosis: correlating clinical and echocardiographic characteristics and computed tomography aortic valve calcium score to excised aortic valve weight. Eur Heart J. 2016;37:693–699. [DOI] [PMC free article] [PubMed] [Google Scholar]
- 31. Aggarwal SR, Clavel MA, Messika‐Zeitoun D, Cueff C, Malouf J, Araoz PA, Mankad R, Michelena H, Vahanian A, Enriquez‐Sarano M. Sex differences in aortic valve calcification measured by multidetector computed tomography in aortic stenosis. Circ Cardiovasc Imaging. 2013;6:40–47. [DOI] [PubMed] [Google Scholar]
- 32. Green P, Russo M, Arnold S, Doshi D, Pichard A, Szeto W, Makkar R, Babaliaros V, Fearon W, Svensson L, Webb J, Nazif T, Zajarias A, Quader N, Parvataneni R, Kirtane A, Cohen D, Mack M, Leon M. TCT‐36 frailty in intermediate risk patients undergoing transcatheter or surgical aortic valve replacement, cut points and relationship with outcomes: an analysis of the placement of aortic transcatheter valves (PARTNER) 2 cohort a randomized trial. J Am Coll Cardiol. 2016;68:B15. [Google Scholar]
- 33. Skelding KA, Yakubov SJ, Kleiman NS, Reardon MJ, Adams DH, Huang J, Forrest JK, Popma JJ. Transcatheter aortic valve replacement versus surgery in women at high risk for surgical aortic valve replacement (from the CoreValve US High Risk Pivotal Trial). Am J Cardiol. 2016;118:560–566. [DOI] [PubMed] [Google Scholar]
Associated Data
This section collects any data citations, data availability statements, or supplementary materials included in this article.
Supplementary Materials
Table S1. Variables Used for Propensity Score Matching
Table S2. Characteristics of Patients Undergoing Isolated Surgical Aortic Valve Replacement Between 2003 and 2014
Table S3. In‐Hospital Outcomes of Patients Undergoing Isolated Surgical Aortic Valve Replacement Between 2003 and 2014
Table S4. Summary of the Literature on Sex Disparity Following Surgical and Transcatheter Aortic Valve Replacement
Figure S1. Standardized mean differences before and after propensity score matching.
Figure S2. Subgroup analysis of sex disparity in in‐hospital mortality following isolated surgical aortic valve replacement (male used as a reference group).
Figure S3. Sensitivity analysis for required strength of an unmeasured confounder. Each line splits the area into 2: The upper right corner of the graph above the confines of a line represents all parameter combinations of an association between an unmeasured confounder and the treatment (aortic valve replacement [AVR] in female patients; y‐axis) with the outcome (blood transfusion; x‐axis) required to move the measured odds ratio (OR) to null. Conversely, the lower left corner represents all parameter combinations of an association between an unmeasured confounder and the treatment and outcome that would not move the measure OR to null.
Figure S4. Proportion of TAVR and SAVR among men and women who underwent aortic valve replacement since commercial approval of TAVR. SAVR indicates surgical aortic valve replacement; TAVR, transcatheter aortic valve replacement.