

Summary
Simultaneous hyperactivation of Wnt and antioxidant response (AR) are often observed during oncogenesis. However, it remains unclear how the β-catenin-driven Wnt and the Nrf2-driven AR mutually regulate each other. The situation is compounded because many players in these two pathways are redox-sensors, rendering bolus-redox-signal-dosing methods uninformative. Herein we examine the ramifications of single-protein-target-specific AR-upregulation in various knockdown lines. Our data document that Nrf2/AR strongly inhibits β-catenin/Wnt. The magnitude and mechanism of this negative regulation are dependent on the direct interaction between β-catenin-N-terminus and β-TrCP1 (an antagonist of both Nrf2 and β-catenin), and independent of binding between Nrf2 and β-TrCP1. Intriguingly, β-catenin positively regulates AR. Because AR is a negative regulator of Wnt regardless of β-catenin-N-terminus, this switch of function is likely sufficient to establish a new Wnt/AR equilibrium during tumorigenesis.
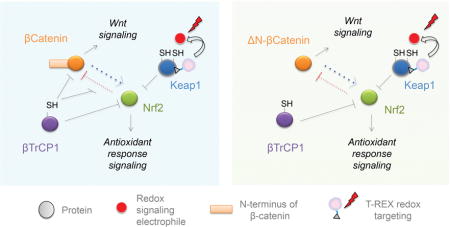
Graphical Abstract
INTRODUCTION
The Nrf2-driven antioxidant response (AR) is the master stress-signaling axis critical for coping with various endogenous and environmental reactive chemical signals (Kensler, et al., 2007). Recent research alludes to multiple lines of crosstalk between AR and other signaling cascades, many of which are also reportedly regulated by reactive species (Bryan, et al., 2013; Ma, 2013; Hayes and Dinkova-Kostova, 2014; Harder, et al., 2015). However, how these upstream Nrf2 regulators function as a cohort to regulate basal AR remains unclear, and how the cell upregulates AR during endogenous redox signaling is also debated. These uncertainties can be traced to context/tissue-specific variations that usher nuanced changes in basal and stimulated redox signaling, as well as the differential between the two (i.e., redox-modification-specific signaling response). The redox signal-induced state is hard to investigate because of drawbacks in conventional bulk electrophile exposure methods typically used to study redox signaling. Downstream phenotypes from bolus methods are likely a complex function of positive and negative effects on both on- and off-targets that form a context-dependent ensemble response (Jacobs and Marnett, 2010; Rudolph and Freeman, 2009). Since AR induction is gaining traction as a therapeutic intervention (Smirnova, et al., 2011; Suzuki, et al.), this gap in our knowledge impinges our ability to predict response to AR-inducing therapies and understand impact of individual off-target proteins modified by AR-inducing electrophilic drugs (Liby, et al., 2007; Crunkhorn, 2012; Houghton, et al., 2016; Prosperini and Pontecorvo, 2016).
We recently developed T-REX, a method that interrogates how non-enzymatic redox modification affects temporal function and signaling trajectories in response to a chemical signal input targeted at a specific protein of interest (POI) (Figure 1A) (Fang, et al., 2013; Lin, et al., 2015; Parvez, et al., 2015; Parvez, et al., 2016; Long, et al., 2017a; Long, et al., 2016; Long, et al., 2017b). T-REX uses a bio-inert photocaged precursor to a specific reactive signal. The photocaged precursor covalently binds HaloTag fused to the POI. At a precise time, the reactive endogenous lipid-derived electrophile (LDE) such as 4-hydroxynonenal (HNE) is released from the photocage, creating a high local concentration of HNE, chemically modifying the POI, provided the POI is able to react rapidly with HNE. Using a functional readout, the precise magnitude and timescale of signal output can be measured as a direct consequence of the specific LDE-signal input to a specific POI. Many built-in controls render T-REX-stewarded responses “POI-specific”: (1) when HaloTag and POI are expressed as separate proteins, POI is not tagged by LDE and no downstream signaling occurs upon T-REX; and (2) point-mutants of specific sensing Cys on POIs abolish sensing and response to LDE upon T-REX. However, such mutants are not always applicable, e.g., the key electrophile-sensor and negative regulator of AR, Keap1, carries several sensor Cys’s that are active even under electrophile-limited conditions deployed in T-REX.
Figure 1. T-REX coupled with shRNA-knockdown investigates co-players in Keap1-alkylation-specific AR.

(A) T-REX enables a user-controlled targeted redox perturbation in vivo: photocaged precursor to reactive LDE covalently binds HaloTag fused to any POI. After washing away unbound precursor, photouncaging rapidly (t1/2 < 1 min) releases LDE. Proximity enhancement (Long, et al., 2016) facilitates selective modification of first-responding sensor-POI, unveiling on-target redox responses. (B) Model of Nrf2 regulation. “SH”s mark redox-sensitive proteins. This study probes the functional impacts of T-REX- enabled Keap1-alklylation-specific redox events in cells in which either PTEN, GSK3β, or β-TrCP (marked by “hairpins”) is depleted.
One major question in AR regulation is the relative importance and redox-context-specific contributions of two parallel Nrf2-degradation pathways (Figure 1B). The two E3-ubiquitin ligase adaptors, Keap1 and β-TrCP, degrade Nrf2 through two distinct/functionally-uncoupled domains on Nrf2, the Neh2 and Neh6 degrons (Figure S1A), respectively. It is challenging to parse these events because numerous regulators (e.g., Keap1 and β-TrCP) and signal propagators (e.g., PTEN, GSK3β) in both paths (Figure 1B) are redox sensitive (Bryan, et al., 2013; Hayes and Dinkova-Kostova, 2014).
Keap1 is believed to be the principal electrophile sensor in the cell. We previously showed—using qRT-PCR, western blot, and luciferase assays—that T-REX-mediated Keap1-specific LDE-modification upregulates AR (and endogenous AR-driven genes) to an extent similar to that from bolus LDE flooding (3–4-fold) (Lin, et al., 2015; Parvez, et al., 2015). Similar fold-AR-upregulation has been reported by us and others for various electrophiles, including HNE (Huang, et al., 2012; Levonen, et al., 2004; Chen, et al., 2009; Zou, et al., 2016; Kachadourian, et al., 2011; Dev, et al., 2015; Trott, et al., 2008). Protein targets beyond Keap1 may be responsible for the pharmacological action of the electrophilic drug tecfidera (dimethylfumarate) (Blewett, et al., 2016). Both stimulatory and inhibitory effects on Nrf2/AR have been implicated for electrophilic modifications of many AR regulators (Sporn and Liby, 2012). Under bolus dosing, many of these events likely compensate for each other giving a deceptively simple reason for the similarities between T-REX and bolus-HNE-dosing in terms of AR. The potentially-divergent subcellular roles of β-TrCP paralogs—β-TrCP1 and β-TrCP2—with largely indistinguishable biological properties further complicate the redox navigation of Keap1-dependent degradation pathway in controlling Nrf2/AR (Seo, et al., 2009). Herein we investigate the effect of knockdown of 3 redox-sensitive AR-modulators—PTEN, GSK3β, and β-TrCP (Dozza, et al., 2004; Hayes and Dinkova-Kostova, 2014)—on T-REX-mediated Keap1-specific HNEylation and downstream signaling, specifically in the backdrop of non-HNE-globally-modified proteome. PTEN, GSK3β, and β-TrCP were believed to function in pathways orthogonal to the canonical Keap1-pathway (Figure 1B).
RESULTS
Basal AR regulation is functional in knockdown lines
Against non-targeted shRNA controls, PTEN, GSK3β, and β-TrCP knockdown was 50–85% by western blot and immunofluorescence (Figure 2A, S1B–G, and S2, Table S1). Out of 2 β-TrCP isoforms, we focused on the nuclear-localized β-TrCP1 (Table S2), since β-TrCP1 truncation mutants are reported (Gerstein, et al., 2002), and Keap1-dependent nuclear-Nrf2–AR-signaling initiates in the cytosol. Thus, β-TrCP1 likely exerts its function downstream of cytosolic-Keap1-HNEylation. We confirmed that β-TrCP1 is nuclear-localized in HEK293T and HeLa (Figure 2B and S1H–I) (Lassot, et al., 2001; Spiegelman, et al., 2001; Davis, et al., 2002; Seo, et al., 2009; Cuadrado, 2015). Isoform-specific knockdown was confirmed at the transcript level by qRT-PCR (Figure S1J and Table S2). One shRNA targeting β-TrCP1 [sh-βTrCP(2)] slightly increased β-TrCP2 mRNA. This likely reflects a compensating pathway (Lai and Crews, 2017). However, as we disclose below, both β-TrCP1-targeting shRNAs gave similar phenotypic outputs, indicating that β-TrCP1 and β-TrCP2 behave orthogonally during Wnt/AR crosstalk. All knockdown lines grew at a rate similar to controls (Figure S1K).
Figure 2. Nuclear β-TrCP1 is necessary for Keap1-HNEylation-specific AR upregulation; bolus HNE exposure masks this requirement.

(A) β-TrCP1 knockdown efficiency in two different shRNA-expressing lines from immunofluorescence (IF). Also see Figure S2. (B) Top panels: IF imaging in HeLa [anti-Halo (Table S1)] shows nuclear localization of Halo-β-TrCP1 as previously reported for β-TrCP1 (Seo, et al., 2009). AHCY—a known cytosolic protein—provides contrast (Hershfield, et al., 1985). Lower panels: Similar results were found with overexpression of untagged β-TrCP1 and IF imaging using β-TrCP antibody. Scale bar, 20 βm. (C) Effects of knockdowns, compared to non-targeted-shRNA controls, on the relative magnitude of Keap1-alkylation-specific AR. Note: for untreated [(i), (ii), (iii)], all signals are normalized to shControl; for other data [(iv)–(ix)], each bar is normalized to its respective value in the untreated set; the value in the untreated set is unity. Results from: untreated HEK293T cells [(i)–(iii); control cells set to 1]; bolus HNE dosing (25 βM HNE, 18 h) [(iv)–(vi); each relative to respective untreated set to 1]; T-REX (Keap1-specific-HNEyation) in cells [(vii)–(ix); each relative to respective untreated set to 1]. Inset: luciferase AR-reporters. The ratio of firefly (ARE) over Renilla (constitutive, CMV) gives AR. Data present Mean±s.d. with each bar graph from n>3 independent biological replicates.
AR levels under non-stimulated conditions were as expected based on the current model (Figure 1B). Halo-Keap1 and myc-Nrf2 were ectopically co-expressed in these cells along with pARE::firefly and pCMV::Renilla (internal control) luciferase reporters (Figure 2C, inset). In each β-TrCP1 knockdown line [shβ-TrCP(1) and shβ-TrCP(2)—generated using two different hairpins targeting specific β-TRCP1 coding regions], basal AR increased [Figure 2C(i)]. This outcome supports the known Nrf2–AR-suppressor role of β-TrCP under non-stimulated conditions and indicates that β-TrCP1 regulates basal AR in these cells (Figure 1B). Consistent with PTEN-depletion activating Akt and antagonizing GSK3β-augmented β-TrCP-mediated Nrf2 degradation (Figure 1B), basal AR is higher in both shβ-PTEN(1) and shPTEN(2) lines [Figure 2C(ii)]. Depletion of GSK3β promotes AR-activation in both shGSK3β lines [Figure 2C(iii)]. These observations validated these engineered cells.
Knockdown lines can mount HNE-induced AR
The prevailing model (Figure 1B) predicts that none of the proteins knocked down (PTEN, GSK3β, and β-TrCP) regulate Nrf2–AR signaling in a Keap1-dependent manner. The β-TrCP/GSK3β-mediated AR-regulatory axis is still functional in Keap1-knockout MEFs and A549 cells (Chowdhry, et al., 2013). Significant increases in Nrf2 protein levels occur upon GSK3β-knockdown or inhibition, independent of Keap1 (Rada, et al., 2011). Consistent with this viewpoint, bolus HNE treatment of knockdown cells transfected with Halo-Keap1/Nrf2/pARE::firefly-luciferase/pCMV::Renilla-Luciferase led to a broadly similar level of AR upregulation (4–5-fold) in all knockdown and control lines, relative to the same lines unexposed to bolus HNE [Figure 2C(iv–vi)]. Thus all knockdown lines have similar capacity to mount AR in response to global HNE stress. The global-HNE-induced fold-AR-upregulation is similar to that reported by us and others (Lin, et al., 2015; Huang, et al., 2012; Levonen, et al., 2004; Parvez, et al., 2015; Parvez, et al., 2016), and likely reflects the large number of AR-responsive genes (Chorley, et al., 2012), numerous Keap1-independent AR-regulators (Bryan, et al., 2013), and evolutionarily-conserved negative feedback mechanisms (Sykiotis and Bohmann, 2008). Thus, the ability to mount HNE-induced AR is weakly influenced by changes in AR regulation in the ground state.
β-TrCP/GSK3β knockdown lines are conditionally hypomorphic for Keap1-HNEylation-specific AR
Unexpectedly, T-REX (Keap1-targeted HNEylation) in these knockdown cells unveiled the following cell behavior [Figure 2C(iv–vi) vs. (vii–ix)]: AR-fold-upregulation (relative to corresponding T-REX-controls) was (1) in PTEN-knockdown lines similar to control lines [Figure 2C(viii)]; (2) attenuated in GSK3β-knockdown lines; and (3) severely compromised (or ‘hypomorphic’) in β-TrCP1-knockdown lines [Figure 2C(vii)]. We define ‘hypomorphism’ as a background showing an attenuated phenotype such as reduced fold-upregulation in AR following T-REX on Keap1.
AR hypomorphism is not due to defective T-REX
We focused on functional analysis of β-TrCP1 depletion because: (1) β-TrCP1 and Keap1 are largely considered to regulate Nrf2 autonomously, binding Nrf2 independently at different sites (Figure S1A) and have different cellular localizations; and (2) β-TrCP1-depletion triggered the strongest AR-suppression upon Keap1-specific HNEylation [Figure 2C(vii)]. Halo-Keap1 expression levels were similar across all our knockdown lines (Figure S3A). Keap1-targeted HNEylation efficiency was similar in control and knockdown lines (Figure S3B–C), and to that previously obtained in cells stably expressing Halo-Keap1 (Lin, et al., 2015; Parvez, et al., 2016). Consistent with luciferase assay data (Figure 2C), the same suppression of Keap1-HNEylation-specific AR-upregulation was measured by flow cytometry in β-TRCP1-knockdown cells transfected with pARE::GFP (Figure S3D). Thus, the observed hypomorphism is not due to differential regulation, latency of luciferase, or differences in luciferase stability in the knockdown lines.
We proposed 3 reasons to explain targeted-redox-singling-specific hypomorphism: differences in toxicity profile for bolus HNE vs. T-REX; Keap1-modification-specific AR-upregulation requires β-TrCP1 to bind Nrf2; there is an unknown HNE-sensitive nuclear-β-TrCP-mediated pathway that operates independently of the Neh6-domain of Nrf2 (Figure S1A).
AR hypomorphism is not due to toxicity
Consistent with our previous data, neither T-REX nor HNE were excessively toxic to cells, although global HNE flooding was more toxic to HEK293T than Keap1-targeted HNEylation. 25 μM HNE (18 h) (conditions used above) upregulated apoptosis (Figure S3E) and caused extracellular release of lactate dehydrogenase (LDH) (Figure S3F). By contrast, T-REX induced neither (Figure S3E–F). A positive control (staurosporine, 10 μM) showed >10-fold upregulation in caspase-3/7 activity (Figure S3E). AlamarBlue viability assay showed that 136 μM HNE was highly toxic, but neither T-REX nor 25 μM HNE was particularly detrimental (Figure S3G). Thus, differential toxicity cannot account for the observed β-TrCP1-dependent suppression of T-REX-mediated Keap1-HNEylation-specific AR-upregulation [Figure 2C(vii–ix) and S3D].
β-TrCP1/GSK3β binding to Nrf2 is not required for Keap1-HNEylation-specific AR-upregulation
To investigate whether β-TrCP1 binding to Nrf2 is required for Keap1-alkylation-specific AR, we used HEK293T expressing Halo-Keap1 and either of the Nrf2 “Neh6-deletion” mutants lacking one of the two functionally-coupled β-TrCP1/2-binding sites (Δ343–347/Δ382–387), or the phosphorylation-defective double mutant (S344A/S347A) (Figure S3H). Each mutant showed higher basal AR compared to wt-Nrf2 (Figure S3I), consistent with these Nrf2 mutants showing reduced β-TrCP-mediated degradation and further showing that β-TrCP functionally modulates basal AR in HEK293T (Figure 1B, S1A, and S3H). Since both sites (343–347 or 382–387) are required for optimal β-TrCP occupancy on Nrf2 (Chowdhry, et al., 2013), such an outcome is expected.
Measurements of AR in these mutant-Nrf2-expressing cells using luciferase assays following T-REX HNEylation of Keap1 revealed that the β-TrCP-binding-defective Nrf2-mutants gave AR-upregulation similar to cells expressing wt-Nrf2 (Figure S3J). To independently validate this and reduce artifacts due to having numerous copies of the AR-reporter, we engineered a monoclonal cell line expressing a single integrated copy of the ARE::GFP reporter in a defined, characterized genomic locus: the same fold increase in AR was measured for wt and mutants-Nrf2 (Figure 3A). Thus, modulation in β-TrCP1 binding to Nrf2 (Figure S1A and S3H) does not affect how cells mount Keap1-HNEylation-specific AR.
Figure 3. β-catenin promotes AR regardless of its N-terminus.

(A) AR fold-upregulation after T-REX-mediated Keap1-specific HNEylation in monoclonal HEK293T lines stably expressing a single copy of ARE::GFP that have been transfected with either Nrf2-wt or the three Nrf2–β-TrCP1-binding-defective mutants (Figure S3H), separately. See Figure S3J. (B) Nrf2-AR axis with a postulated novel modulator of Nrf2 that is regulated by β-TrCP1. (C) β-catenin stimulates AR regardless of its N-terminus. Post transfection with ARE::firefly luciferase, CMV::renilla, CMV::Nrf2 and the indicated plasmid in HEK293T, and AR was measured after 2 days. See also Figure S4B. (D) As in (C) except either wt or Δ89-β-catenin (balanced against an empty vector) was varied. (E) AR in HEK293T transfected with ARE::firefly luciferase, CMV::renilla, either empty plasmid or plasmid encoding ΔN89β-catenin, and varying amounts of CMV::Nrf2, measured after 2 days post transfection.
Thus, there is at least one additional modulator of Nrf2 that is regulated by β-TRCP1. Because GSK3β-knockdown was isotypic with β-TrCP1-knockdown [Figure 2C(vii) and (ix)], and because GSK3β co-regulates many β-TrCP1-regulated events (Cadigan and Nusse, 1997; Xu, et al., 2009; Fuchs, et al., 2004), we hypothesized that this newly-identified process is co-regulated by GSK3β and β-TrCP1. This GSK3β/β-TrCP1-regulated protein/pathway is most likely HNE-sensitive (Figure 3B), which would explain why hypomorphism was alleviated under bolus-dosing conditions [Figure 2C(iv and vi) vs. (vii and ix)].
A β-TrCP1/GSK3β-co-regulated pathway that may crosstalk with AR
One candidate that satisfies all our requirements is β-catenin—a redox-sensitive transcription factor that regulates canonical Wnt signaling (Figure S4A) important in development and cancers (Polakis, 2012). Reports differ on how Wnt signaling affects AR. Wnt signaling upregulates GST (an AR-driven gene) (Wang, et al., 2015; Li, et al., 2004), and the Wnt3A isoform (an upstream agonist within Wnt axis) also stimulates AR and effect was Keap1-independent (Rada, et al., 2015).
One report states that Wnt3A upregulates Nrf2 in a β-catenin-independent manner. Others claim β-catenin in conjunction with Keap1 promotes Nrf2-ubiquitination and cytosolic accumulation, indicating a multifactorial negative regulatory role (Kim, et al., 2012). Curcumin—a known electrophilic Nrf2 agonist—suppresses Wnt (Ryu, et al., 2008) but the effects of reactive species on Wnt are generally controversial (Funato, et al., 2006; Shin, et al., 2004). This complex regulation is expected because Wnt signaling intersects with both oncogenic and tumor-suppressor redox-sensitive pathways. These conflicting data indicate there is context-dependent crosstalk between AR and Wnt, and regulators of both pathways intercommunicate.
β-catenin stimulates AR
We investigated what role β-catenin plays in Wnt and AR crosstalk. We chose HEK293T, HeLa, and COS-7 cells for: (1) Relatively high levels of ectopic expression in these cells allow a large number of constructs to be studied using reporter assays and qRT-PCR. (2) Regulation of AR and Wnt is reportedly quite different between various lines (Song, et al., 2014). (3) We validated that: (a) β-catenin N-terminus (including introns) is frequently mutated in cancer cells, and (b) the N-terminus, and a large portion of the WD40-repeats within β-TrCP1, were intact, by sequencing the genomic DNA of each line (Table S3–S4).
Because of the disease relevance, we examined several β-catenin N-terminal-mutants that constitutively hyperactivate Wnt (Figure S4A, inset). This deletion of 89-residues at the N-terminus results in a mutant that lacks GSK3β/β-TrCP-regulation through the removal of the β-TrCP1-binding site, DSGI35HS. Thus, the ΔN(89)-β-catenin mutant mimics the regulation intrinsic to AR-hypomorphic β-TrCP-knockdown lines. We additionally studied ΔN(47)-β-catenin—a mutant with altered regulation similar to ΔN(89)-β-catenin—that has been recorded in cancers (Alomar, et al., 2016), and the point mutant S33Y that inhibits β-TrCP-binding to β-catenin. S33Y—and similar mutations are found in pilomatricomas (Chan, et al., 1999), SW48 colorectal cancer cells (Sparks, et al., 1998) and hepatocarcinomas (Zucman-Rossi, et al., 2006).
We found that Wnt activation by—overexpression of both β-catenin wild-type (wt) and the constitutive mutants—moderately stimulated AR across all lines (Figure 3C and S4B)1. Thus, Wnt and AR are functionally interconnected.
β-catenin stimulates AR via a mechanism independent of Nrf2 expression
ΔN(89)-β-catenin expression had minimal effect on Nrf2 levels [Figure S4C(i)], indicating that these effects were not due to effects on promoter-activity/protein-stability. To investigate how the observed crosstalk between Wnt and AR depends on Nrf2 expression and the relevance of β-catenin’s N-terminus, we overexpressed wt- and ΔN(89)-β-catenin. Both wt- and ΔN(89)-β-catenin exerted a dose-dependent (maximally 2-fold) AR stimulation in HEK293T (Figure 3D). Dose response was similar between the N-terminal deletion mutants and wt, although the EC50 for the mutant was lower (Figure 3D). AR-stimulation was linearly correlated with Nrf2 amount both in native and cells expressing ΔN(89)-β-catenin (Figure 3E). Finally, this effect was also observed in HEK293T transfected with a β-TrCP1-binding-defective Nrf2-mutant (Δ343–347-Nrf2) [Figure S3H and S4C(ii)]. Thus, β-catenin can stimulate AR regardless of its own N-terminus, or β-TrCP1 occupancy on Nrf2.
Nrf2 is a negative regulator of Wnt
We next investigated how Nrf2 regulates Wnt signaling using the “TOP/FOP” reporter (Figure S4A). This assay uses a β-catenin-responsive ‘T-cell factor (TCF)-element driving luciferase’ (TOP) and a mutated element (non-β-catenin-responsive, FOP) also driving luciferase (Figure S4A, inset). The ratio of signals from these two reporters—each normalized to Renilla luciferase as internal control (and thus eliminating CMV promoter modulation)—reflects β-catenin-specific canonical Wnt signaling, as opposed to the non-canonical non-β-catenin-driven Wnt pathway. Consistent with previous studies (Zhang, et al., 2008), TOP signal was approximately 2-fold above FOP under non-stimulated conditions.
We stimulated canonical Wnt signaling using two different methods. Our Strategy A was transfection of wt-β-catenin. As expected, the ectopically-expressed wt-β-catenin is regulated similarly to endogenous β-catenin, and β-catenin-specific Wnt activation (reported by TOP/FOP) was observed in all lines. The dynamic range of this reporter assay is low in HeLa, and thus analyses focused on HEK293T and COS7 [Figure 4A(i) and S4D(i)].
Figure 4. Dose response relationship between Wnt signaling and AR signaling.

(A) Inset: Schematic of the TOP/FOP assay for Wnt activity: one set of cells is transfected with the TOP reporter, CMV::Renilla luciferase, empty vector [for 4A(i)], and indicated additional plasmid(s) as indicated; and a second set of cells is transfected with the FOP reporter, CMV::Renilla luciferase, Nrf2 plasmid [for 4A(ii)], and additional plasmid(s) as indicated. After 2 days, Wnt signaling was measured. Note: axes for 4A(i) and 4A(ii) are different. [The TOP construct contains 3 Wnt-specific binding sites for TCF (T-cell factor) transcription factors and the firefly (ff) luciferase (Luc) reporter under control of a minimal promoter. The FOP construct is identical to the TOP reporter but has the 3 TCF-binding sites mutated, rendering it inactive]. (B) At 1-day post-transfection of HEK293T with TOP or FOP, empty vector or Nrf2, and CMV::Renilla, samples were exposed to varying concentrations of CHIR99021 (with or without HNE) and after 24 h, Wnt activity was measured [Nrf2 (blue) and (empty vector + 25 μM HNE) (green) are coincidental for all concentrations of CHIR99021]. (C) The indicated cells were treated with either DMSO or CHIR99021 (10 μM) for 24 h, then TCF7 mRNA was measured using qRT-PCR. (D–F) HEK293T cells were transfected with plasmids encoding the indicated transgene. After 48 h, LEF1 (D), TCF7 (E), and C-MYC (F) mRNA were measured using qRT-PCR. Data present Mean ± s.e.m. with each bar graph from n>3 independent biological replicates.
All β-catenin-mutant-constructs—Δ(89), Δ(47), Δ(5–59), and S33Y (Figure S4A, inset)—consistently upregulated β-catenin-specific Wnt signaling in HEK293T [Figure 4A(i) and S4D(i)]. Beyond Δ(89), Δ(47) and S33Y mutations, ΔN(5–59)-deletion is also found in patients of childhood hepatoblastomas (Koch, et al., 1999). Although subtle differences exist in the extent of upregulation, all β-TrCP-binding-defective N-terminal-mutants of β-catenin activated Wnt to a higher level than transfection of wt-β-catenin in both HEK293T (~4-fold) and COS7 (~1.5-fold) [Figure 4A(i) and S4D(i)]. Importantly, upon co-transfection of Nrf2 (at 1 equiv with respective to β-catenin), Nrf2 inhibited Wnt signaling in both lines and for all constructs [Figure 4A(ii) and S4D(ii); compare Y-axis values with those in Figure 4A(i) and S4D(i)]. Intriguingly, the relative extent of Nrf2-dependent Wnt-inhibition—between wt- and mutant-β-catenin constructs—was different (Figure S5A), implying that regulation in the presence and absence of β-catenin-N-terminus is different. In both HEK293T and COS7, the extent of Nrf2-driven Wnt-suppression was on the whole higher for wt-β-catenin compared to β-catenins bearing N-terminal deletions/mutation (Figure S5A).
Since β-catenin N-terminal mutations/truncations are linked to cancer, this observation indicates that the interplay between Wnt and AR is different between healthy and disease states. Importantly, this effect was seen with all N-terminal mutants, including S33Y-point mutant which retains several other known phospho-regulatory sites [such as casein kinase 1 phosphorylation at Ser45 (Cruciat, 2014)]. Thus, impaired β-TrCP1-binding to β-catenin is the root cause of the observed β-catenin-N-terminus-dependent differences in responsivity of Wnt signaling to Nrf2.
Nrf2 downregulates endogenous Wnt signaling
Our Strategy B to stimulate Wnt signaling involved the use of Wnt-agonist, CHIR99021—a small molecule that upregulates β-catenin through GSK3β inhibition (Wu, et al., 2015). In HEK293T, 10 μM CHIR99021 upregulated Wnt signaling 10,000-fold above background (Figure 4B). mRNA abundance of TCF7—an established β-catenin/Wnt-driven gene—was also upregulated by 1.5–10-fold in all 3 lines (Figure 4C), thereby corroborating the results of the TOP/FOP-assay [Figure 4A (inset), and 4B].
Nrf2 suppressed CHIR99021-stimulated Wnt-signaling in HEK293T by two-fold (Figure 4B). The fold-inhibition of Wnt-pathway-activity by Nrf2-overexpression was maintained over a >10-fold range of CHIR99021 (Figure 4B), indicating that Nrf2 inhibition of Wnt is independent of β-catenin levels/overexpression. 25 μM HNE treatment of the CHIR99021-stimulated but otherwise native HEK293T cells (that activates Nrf2/AR) also resulted in Wnt suppression (Figure 4B). The same downregulation was measured in COS7 (Figure S5B). Hence, Nrf2 suppresses Wnt-activation, although nuanced differences were observed across cell lines.
Finally, we examined the effect of Nrf2-overexpression on endogenous β-catenin-driven genes, using qRT-PCR. Two genes, LEF1, and c-MYC, in addition to TCF7, were selected. First, we confirmed that overexpression of various β-catenin-constructs upregulated LEF1 (Figure 4D). These constructs included wt- and GFP-fused2-wt-β-catenins, and ΔN(89)-, ΔN(47)-, and S33Y-mutants. Nrf2-overexpression in HEK293T suppressed LEF1 mRNA-abundance (Figure 4D). This Nrf2-dependent fold-suppression was broadly similar to the fold-stimulation by β-catenin constructs (Figure 4D). There was also suppression of TCF7 upon Nrf2-transfection, and overexpression of various β-catenin constructs upregulated TCF7 (Figure 4E). Since CHIR99021 also upregulated TCF7 mRNA in all lines (Figure 4C), these data are consistent with this pathway functioning at the endogenous level in these cells. Finally, Nrf2-overexpression downregulated c-MYC (Figure 4F). Thus, Nrf2 overall downregulates endogenous β-catenin-controlled genes, although the response is context dependent.
Nrf2 upregulation changes dose-response pattern between wt- and ΔN-β-catenin-driven Wnt signaling: the effect cannot be explained by the corresponding changes in protein level
Wnt-activity increased linearly with increasing ΔN(89)-β-catenin when balanced by co-transfection with an empty vector [Figure 5A (
 ) (Y-axes in log-scale)]. But a non-linear relationship between Wnt activity and ΔN(89)-β-catenin was observed in the presence of Nrf2 (
 , Figure 5A). The fold suppression of Nrf2-driven Wnt inhibition (i.e., the ratio of Wnt signaling as a function of ΔN(89)-β-catenin in null background, over Nrf2-overexpressing background) showed a hook/prozone effect (Figure 5B) (Weinstock and Schnaidt, 2013; Long, et al., 2016). Nrf2-expression elicited only a minor effect on ΔN(89)-β-catenin protein levels (Figure 5C), and given the ‘ΔN(89)-β-catenin plasmid’ vs. ‘Wnt activity’ titration data (Figure 5A), the β-catenin protein-level changes are not sufficient to explain the high fold suppression seen in the downstream assays.
Figure 5. Nrf2 is a negative regulator of Wnt signaling dependent on the β-catenin N-terminus.

(A) HEK293T were transfected with TOP or FOP, CMV::Renilla, differing amounts of ΔN89-β-catenin (balanced with empty vector) with either empty vector or Nrf2. The y-axis is in log scale, making blue line appear curved but it best-fits a straight line (linear fit slope: 1500 ± 53, R2=0.995). (B) Data from (A) are shown as the ratio of Wnt signaling for empty vector/Nrf2 and expressed as a function of CMV::ΔN(89)-β-catenin dose. Wnt activity shows a hook/prozone effect upon titrating ΔN89-β-catenin in a Nrf2-overexpressing background. (C) HEK293T cells were transfected with ΔN(89)-β-catenin (Flag-tagged) together with either empty vector or Nrf2 (myc-tagged). After 48 h, levels of ΔN(89)-β-catenin were assessed by anti-Flag IF. (D) Same as (A) but β-catenin-GFP was used. The y-axis is in log scale, making blue line appear curved but it best-fits a straight line. (E) HEK293T cells expressing control shRNA were transfected with the indicated β-catenin construct, TOP or FOP, CMV::Renilla (see inset in Fig. 4A) and varying amounts of Nrf2 plasmid balanced with empty vector. After 48 h, Wnt signaling was assessed. Inset: At 1 equiv Nrf2, β-catenin N-terminal deletion mutants have higher Wnt activity than wt-β-catenin. (F) As in (E), except β-catenin with or without GFP fusion is compared over Nrf2 titration. Inset: HEK293T cells were transfected with TOP or FOP, the indicated β-catenin construct, and CMV::renilla, and Wnt signaling was measured after 48 h. (G) Same as (E) except indicated shRNA knockdown lines were used. Note: Nrf2 titration against wt-β-catenin in (E) is reshown in (F) and (I) for comparison. (H) Same as (E) except the indicated HEK293T lines were used. (I) The indicated HEK293T lines were transfected with wt-β-catenin, TOP or FOP, CMV::Renilla, 0.05 equivalents of Nrf2, and the plasmid encoding the indicated transgene or empty vector, and Wnt activity was measured after 48 h. (see β-TrCP-domain structure in Fig. S5I). Data present Mean ± s.e.m. with each bar graph from n>3 independent biological replicates.
Wnt signaling also increased with increasing wt-β-catenin (with or without GFP fusion) (Figure 5D and S5C). The response per unit plasmid was elevated (2.5 fold) in β-TrCP1 knockdown lines (Figure S5C), consistent with this construct being regulated by β-TrCP1. The fold-increase in Wnt signaling upon β-TrCP1-knockdown is similar to that found for transfection of β-catenin-N-terminal-deletion-mutants. Nrf2 suppressed wt-β-catenin signaling by >10-fold at all concentrations studied in both control and knockdown lines (Figure 5D and S5C). No increase in Wnt signaling was observed at high concentrations of plasmid (Figure 5D and S5C), unlike in the case of the N-terminal deletion mutant (Figure 5A). Nrf2 also had little effect on wt-β-catenin expression (Figure S5D). Thus, protein level effects are at most a modest component of the observed differential Wnt signaling suppression by Nrf2, between wt- and ΔN(89)-β-catenin-expressing cells. Thus, Nrf2 is an inhibitor of Wnt signaling, but inhibition is not primarily associated with β-catenin stability.
Nrf2 regulation of β-catenin/Wnt is dependent on the β-catenin N-terminus
Having established that Wnt signaling was downregulated by Nrf2-upregulation with interesting dependence on the β-catenin N-terminus, we investigated the quantitative relationship between Nrf2 plasmid and Wnt-signaling that is upregulated by wt-β-catenin, wt-β-catenin-GFP, ΔN(89)- and ΔN(47)-mutants (Figure S4A, inset).
Titration of the Nrf2 plasmid into cells co-transfected with wt-β-catenin (with or without GFP fusion) and measuring Wnt activity showed a cooperative inhibition profile with a Hill coefficient of between 3 and 4 (Figure 5E–F). Interestingly, there was no cooperativity when the N-terminal-deletion mutants were used, indicating again that there are mechanistic differences between how Nrf2 regulates wt- vs. N-terminal-mutant-β-catenin signaling. At high Nrf2 expression (1 equiv Nrf2 plasmid), as described above, the deletion mutants showed proportionally higher Wnt signaling than wt-β-catenin (Figure 5E inset). This is consistent with cooperative inhibition that should lead to proportionally higher inhibition relative to non-cooperative systems at concentrations significantly higher than EC50. This observation explains why we found that N-terminal β-catenin mutants were resistant to 1 equiv. Nrf2 plasmid [(Figure S5A), and Figure 4A(ii) and S4D(ii): compare respective Y-axes with those in Figure 4A(i) and S4D(i)].
Since both wt- and N-terminal-deleted β-catenins are regulated differently by β-TrCP1, and Wnt signaling is higher in the deletion mutants in otherwise native cells [Figure 4A(i)], absolute expression levels of β-catenin-wt and -deletion constructs are likely different. However, changes in concentration alone cannot explain a switch from cooperative to non-cooperative behavior (Figure 5E). Furthermore, although the GFP- and non-tagged wt-β-catenin constructs elicited 5-fold different Wnt upregulation (Fig. 5F inset), Nrf2 overexpression inhibited both cases with similar cooperativity and with very similar EC50’s (EC50 =0.27 vs. 0.2, and Hill coefficient for both = 3.6) (Figure 5F). Thus Nrf2 inhibitory potency toward Wnt and mechanism is not correlated to Wnt levels in the absence of Nrf2 overexpression. A similar conclusion was drawn from the CHIR99021 titration (Figure 4B). This result provides further evidence that the observed outcome is not due to trivial effects, such as competition between Nrf2 and β-catenin for β-TrCP1 binding. The linearity of our plasmid titrations [Figure 3E, and 5A, 5D and S5C (Y-axes in log scale)], and the fact that Nrf2 had little effect on wt-β-catenin-GFP or Nrf2-GFP expression [Figure S4c(i), 5C, S5D] confirms that proteolytic regulation of Nrf2 by β-TrCP1 is not affected by additional wt-β-catenin, at the protein levels we are studying, and vice versa.
We proceeded to titrate Nrf2 plasmid into sh-Control (
), sh-β-TrCP1 (
 ), and sh-GSK3β (
) cells expressing wt-β-catenin (Figure 5G; and for similar titration with GFP-fusion, see Figure 5F and S5E), and measured Wnt activity. The β-TrCP1- and GSK3β-knockdown lines showed enhanced basal Wnt activity for all β-catenin concentrations (Figure S5F). The cooperativity was retained in sh-Control cells (
), although it was lost in knockdown cells (
,
) (Figure 5G and S5G), indicating that β-TrCP1 binding to the N-terminus of β-catenin modulates how Nrf2 inhibits Wnt signaling. The EC50s (fit to non-cooperative equation) were 0.05 and 0.09 for β-TrCP1 and GSK3β, (
,
) respectively; whereas for sh-Control cells (
), the EC50 was 0.27 with a Hill coefficient of 3.6 (Figure 5G and S5G). A similar output was observed for β-catenin-GFP.
), and sh-GSK3β (
) cells expressing wt-β-catenin (Figure 5G; and for similar titration with GFP-fusion, see Figure 5F and S5E), and measured Wnt activity. The β-TrCP1- and GSK3β-knockdown lines showed enhanced basal Wnt activity for all β-catenin concentrations (Figure S5F). The cooperativity was retained in sh-Control cells (
), although it was lost in knockdown cells (
,
) (Figure 5G and S5G), indicating that β-TrCP1 binding to the N-terminus of β-catenin modulates how Nrf2 inhibits Wnt signaling. The EC50s (fit to non-cooperative equation) were 0.05 and 0.09 for β-TrCP1 and GSK3β, (
,
) respectively; whereas for sh-Control cells (
), the EC50 was 0.27 with a Hill coefficient of 3.6 (Figure 5G and S5G). A similar output was observed for β-catenin-GFP.
By contrast, there was very little difference between EC50 (non-cooperative) for Nrf2-inhibition of ΔN(89)-β-catenin-promoted Wnt-signaling in either β-TrCP1-knockdown (
 ) or sh-Control (
) lines (0.05 vs 0.07 equiv.) (Figure 5H). As a corollary, we showed that Nrf2 was proportionally less effective at inhibiting Wnt caused by the deletion/point mutants than wt-β-catenin at Nrf2 concentrations significantly above the EC50 (i.e., close to 1.0 equiv. Nrf2) (Figure S5H, compare ‘sh-Control’ bars).
) or sh-Control (
) lines (0.05 vs 0.07 equiv.) (Figure 5H). As a corollary, we showed that Nrf2 was proportionally less effective at inhibiting Wnt caused by the deletion/point mutants than wt-β-catenin at Nrf2 concentrations significantly above the EC50 (i.e., close to 1.0 equiv. Nrf2) (Figure S5H, compare ‘sh-Control’ bars).
Furthermore, the difference between these mutants and wt-β-catenin was lower (although not fully equivalent) in β-TrCP1-knockdown lines relative to that in controls (Figure S5H). This is likely a manifestation of cooperative behavior of Nrf2-induced inhibition in wt-β-catenin/Wnt signaling; i.e., at high Nrf2 concentrations, Nrf2 inhibition of Wnt is more significant in wt-β-catenin-expressing cells than that in either N-terminal-mutants-expressing cells or β-TrCP1-knockdown lines (Figure S5H).
These data indicate that β-TrCP1 manages how Nrf2 regulates Wnt (Figure 6). Although we cannot fully rule out other factors for all Nrf2-concentrations (notably, high Nrf2-concentrations where ΔN(89)-β-catenin and deletion mutations were not completely epistatic), the fact that ΔN(89)-β-catenin behaved similarly: (A) to wt-β-catenin in β-TrCP1-knockdown lines; and (B) in control and β-TrCP1-knockdown lines through most of the Nrf2 titration (i.e., all conditions were epistastic) is an indication that β-TrCP1 is the predominant mediator of the difference between deletion mutants and wt-β-catenin in native lines. Thus, occupancy of β-TrCP1 on β-catenin (Figure S4A, inset) affects how potently and by what mechanism Nrf2 affects Wnt signaling. Since the Nrf2 inhibition effect does not significantly affect β-catenin stability, and suppression of cooperativity is epistatic between the β-catenin-deletion mutants and β-TrCP1-knockdown, it is likely β-TrCP1 has additional regulatory roles when bound to the β-catenin N-terminus.
Figure 6.

β-TrCP1 regulates both β-catenin and Nrf2 stability through their GSK3β-regulated degrons. However, Nrf2 strongly inhibits β-catenin-dependent Wnt signaling, and β-catenin moderately stimulates Nrf2-dependent AR. The inhibition of β-catenin by Nrf2 is mediated by β-TrCP1-occupancy on β-catenin. Thus, cells with N-terminal mutated/truncated β-catenin that is unable to bind β-TrCP1 (ΔN-β-catenin) are much more susceptible to Nrf2/AR-mediated Wnt inhibition (Right Panel) than wt cells whose β-catenin contains a functional N-terminus (Left).
At low levels of Nrf2, β-TrCP1 upregulates Wnt
We proceeded to investigate what components of β-TrCP1 modulated the response of β-catenin to Nrf2. We first examined the extent of differential rescue of Wnt activity by wt-β-TrCP1 (mouse origin) exogenously-introduced to sh-control and sh-β-TrCP1 cells. This was done under the conditions of low Nrf2, i.e., at concentrations below EC50 in Figure 5G such that ectopic Nrf2 only imposed a minor effect on Wnt in sh-control cells (Figure 5G, ■) whereas a corresponding ~2.5-fold suppression in sh-β-TrCP1 cells (Figure 5G,
). Consistent with our model above, Wnt-activity regain was higher in β-TrCP1-knockdown lines than in controls (Figure 5I, compare ‘empty’ vs. ‘wt-β-TrCP1’ in each set). Importantly, elevation of Wnt signaling was also found when using a Nrf2-mutant compromised for β-TrCP1 binding (Δ343–347) (Figure S5I), indicating that the interplay of Wnt and AR is independent of β-TrCP1’s ability to bind Nrf2.
We replicated these experiments with a truncated version of mouse (m)-β-TrCP1 that features only the substrate-recognition motif [possessing only the 1st through 7th WD domains of mβ-TrCP1 (Figure S5J); termed WD40(1–7)] in place of full-length m-β-TrCP1. Surprisingly, this construct suppressed Wnt signaling in all backgrounds (Figure 5I), indicating some off-target effects may be at play. Nevertheless, WD40(1–7) construct was unable to rescue Wnt activity: there was no increase in Wnt activity in knockdown lines relative to control lines (Figure 5I). We thus conclude that binding alone of WD40(1–7)-domain within β-TrCP1 to β-catenin is insufficient to protect from Nrf2 antagonism of Wnt.
These data paint a picture that Nrf2 downregulates Wnt (a positive regulator of AR) differently in sh-control and β-TrCP1-knockdown cells. Thus, the suppression of Keap1-alkylation-specific AR-upregulation in β-TrCP1-knockdown lines [Figure 2C(vii)] could stem from the differential responsiveness of β-TrCP1-knockdown lines to Nrf2 activation; i.e., control cells are relatively unresponsive to small increases in Nrf2 when Nrf2 is in low concentration, because they respond cooperatively to Nrf2: over the same concentration range, β-TrCP1-knockdown cells are highly responsive to small changes in Nrf2 levels. The downregulation of Wnt and concomitant downregulation in AR, caused by Nrf2-upregulation, could serve to countermand Nrf2-driven AR-upregulation.
Keap1-selective HNEylation downregulates Wnt signaling more than bolus HNE dosing
Having established that a complex, HNE-dependent regulatory role exists between Nrf2/AR and β-catenin/Wnt pathways, we evaluated how Keap1-specific-HNEylation affects Wnt. We also examined how ΔN-β-catenin (which mimics β-TrCP-deficient cells) integrates into this process.
The different outcomes between bolus HNE dosing and T-REX (Keap1-specific-alkylation) [Figure 2C(iv) vs. (vii)] could be explained by the fact that Wnt signaling may be affected differently by the two regimens and off-target effects associated with bulk HNE-exposure could upregulate compensating pathways that mask the effects of this specific interaction. Indeed, in cells transfected with Halo-Keap1, Nrf2, and ΔN-β-catenin [along with either a TOP or FOP and CMV-Renilla control reporters (Figure 4A, inset)], T-REX caused a more significant downregulation of Wnt signaling than bolus HNE dosing (Figure S6A), as we would predict.
Wnt upregulation suppresses Keap1-selective AR
Given the complex interplay between Wnt and AR, and the number of redox-sensitive players that mediate this interaction, we finally evaluated how Wnt upregulation influences AR activation selectively enabled by T-REX. Cells pre-treated with the Wnt-agonist CHIR99021, and subjected to Keap1-targeted HNEylation, showed AR-suppression of statistical significance relative to samples not pre-treated with the Wnt agonist (Figure S6B). This result reinforces our conclusion that the β-catenin-driven Wnt pathway crosstalks with AR in Keap1-alkylation-specific redox signaling.
DISCUSSION
Our study documents that protein-specific redox signaling can help elucidate new pathway connections that are applicable to the ground and redox-stimulated states. As our appreciation for nuanced redox signaling improves, it is our hope that more redox-dependent pathways will be investigated/evaluated in this manner. Starting with the curious finding that cells with reduced expression of β-TrCP1 or GSK3β are as an ensemble unable to mount AR through Keap1-selective HNEylation, we began a quest to understand the interplay of Nrf2 and another pathway regulated by β-TrCP1/GSK3β. We postulated that the unknown pathway was β-catenin/Wnt signaling. In this way, we gained further insights into the complex regulatory loop involving Nrf2, β-catenin, Keap1 and β-TrCP1.
Our data indicate degradation-independent functions of β-TrCP1 are relevant and have been previously overlooked: such a new regulatory mode may explain the conflicting behavior of β-TrCP in cancer (Zheng, et al., 2016). Links between Nrf2/AR and Wnt signaling were known, but these have been conflicting and presented little in the way of a generalizable understanding. Given the complexity of the systems, and the cooperative behavior we discovered, this is now understandable. Subtle variations across cell lines and downstream genes further muddy the waters, although in most instances the same general message arises.
Our data show that the reciprocal regulation between Nrf2/AR and Wnt signaling is dependent on several factors, including expression levels of each gene, specific mutations, expression of Keap1, β-TrCP1/GSK3β and also redox signaling. Critically, the effect Nrf2 expression exerts on AR and Wnt signaling are not equal, nor are they mutually regulated. Thus, basal and redox-stimulated signaling are highly context dependent and require independent evaluations. This is most clearly described by the differences in the way that the N-terminus of β-catenin regulates Wnt and AR. In the case of Wnt signaling, the N-terminus functions in collaboration with β-TrCP1 to countermand Nrf2-mediated inhibition, at least at low-to-moderate Nrf2 levels. Interestingly, in cells expressing wt-β-catenin, Nrf2 cooperatively inhibits Wnt signaling, leading to an ‘inversion’ at high Nrf2 concentrations; i.e., β-catenin-N-terminus mutants are resistant to high Nrf2 levels relative to wt-β-catenin. On the other hand, Wnt stimulates AR regardless of the N-terminus of β-catenin, in a relatively simple manner. Although the fold changes in AR are much smaller than that measured for Nrf2-driven Wnt inhibition, it is noteworthy that the fold responsivity of AR is significantly smaller than Wnt activation.
Wnt upregulation is sufficient to usher oncogenic transformation in certain cells (Nusse and Varmus, 1982). AR is also often upregulated in cancers (Sporn and Liby, 2012; Menegon, et al., 2016). From our data, these two scenarios are for the most part antagonistic, as Nrf2 strongly inhibits Wnt. It is thus likely that cancer cells must undergo reprogramming to accommodate AR and β-catenin co-upregulation. Importantly, common mutations to β-catenin that stimulate Wnt signaling, also sensitize Wnt signaling to AR, so in these lines, additional reprogramming may be necessary. Critically, AR retains its negative regulation of Wnt signaling independent of the β-catenin N-terminus, so it is likely that AR will auto-regulate/countermand hyperactive Wnt signaling. This delicate balance may be exploitable for drug discovery in numerous ways. AR may serve to prevent excessive upregulation of Wnt, which offers an alternative explanation for why AR downregulation is toxic for some cancer cells. Alternatively, N-terminal β-catenin mutant-expressing cells should be hypersensitive to AR-induced Wnt-signaling suppression relative to normal somatic cells.
Significance
Redox-sensitive pathways have proven difficult to study. Because of the promiscuity of these reactive signals, typical assay conditions result in deleterious outputs such as cell death and mask many nuanced phenotypes that occur under endogenous conditions. Recent work has shown that redox-modification of a single protein elicits signaling. This result suggests that modified proteins are independent states that merit study using precision interrogations. One interesting situation where several redox-signaling pathways intersect is during oncogenesis; many cancer cells upregulate the antioxidant response (AR) and several other redox-responsive pathways. How these pathways crosstalk and accommodate each other continues to be an area of huge debate. Herein, lentiviral-shRNA-derived knockdown in combination with T-REX-single-protein redox-targeting unveiled that nuclear β-TRCP assists Keap1-electrophilic-modification-specific Nrf2 signaling to drive AR. This compartmentalized coupling was not apparent using bolus approaches. Subsequent investigations led to the discovery that β-catenin—a β-TRCP-regulated driver of Wnt signaling (a key pathway in oncogenesis)—is a central player in Nrf2/AR. Intriguingly, β-catenin is an AR-promoter. This effect is independent of the β-catenin N-terminus, where β-TrCP binds. Conversely, Nrf2 antagonizes the β-catenin/Wnt pathway. Loss of β-catenin N-terminus or knockdown of β-TrCP renders inhibition more efficient. Thus, sensitization of Wnt signaling to Nrf2 inhibition in β-TrCP-knockdown lines counteracts AR upregulation, leading to reduced AR-upregulation upon T-REX-mediated Keap1-specific-alkylation in these knockdown lines. Our data indicate that N-terminal β-catenin mutations—commonly found in Wnt-dependent cancers—contribute to both Wnt and AR reprogramming during oncogenesis. Cancer cells that upregulate Wnt through preventing β-TrCP-binding to β-catenin, may be highly susceptible to Nrf2-mediated Wnt suppression.
CONTACT FOR REAGENT AND RESOURCE SHARING
Further information and requests for resources and reagents should be directed to and will be fulfilled by the Lead Contact, Yimon Aye (ya222@cornell.edu)
EXPERIMENTAL MODEL AND SUBJECT DETAILS
Cell lines
HEK293T, HeLa, and COS-7 cells were cultured in DMEM-Glutamax (Invitrogen 41090-036) supplemented with 10% v/v FBS (Sigma-Aldrich, F2442), 5% NEAA (Invitrogen A11140-050) and 5% pyruvate (Invitrogen 11360-070) in the presence of 1X penicillin-streptomycin antibiotics (Invitrogen 15140-122). HEK293T cells stably expressing His6-Halo-Keap1 were cultured as in HEK293T cells except that 1.5 μg/mL puromycin (Invitrogen A11138-03) was included. Cells were cultivated in adherent culture plates (Corning) in a humidified atmosphere of 5% CO2 at 37 °C and harvested by trypsinization (Invitrogen 25300-054). Cell lines were validated to be free of mycoplasma contamination using a MycoGuard® Mycoplasma PCR detection Kit from Genecopoeia
Generation of knockdown cell lines using lentivirus
HEK293T packaging cells were seeded and grown overnight in antibiotic free media in 6-well plates. At 80% confluence, each well was transfected with packaging plasmid (pCMV-R8.74psPAX2, 500 ng), envelope plasmid (pCMV-VSV-G, 50 ng) and pLKO vector (500 ng) using TransIT.LT1 as per the manufacturer’s protocol. After 18 h media was removed and replaced with 20% serum containing media. After 24 h, media was collected, spun down and passed through a 0.8 micron filter and stored at −80 °C or used directly.
Cells in log phase were treated with 1 ml of virus supernatant (from above) in 8 μg/ml polybrene in a total of 6 ml of media in a 6-well plate. After 24 h, media was removed and replaced with media containing 2 μg/ml puromycin (which was 100% toxic to all lines used in this study). Cells were cultured till plate was confluent, then cells were split and moved to a 10 cm dish in 2 μg/ml puromycin containing media and grown till confluent again. At this point the line was considered to be “selected”, and expression of target gene was analyzed by western blot and compared to shRNA controls. Up to passage 5 was used for these cells and they were typically grown in 1.5 μg/ml puromycin.
METHOD DETAILS
Plasmids
Mammalian expression plasmids: phrGFP-Keap1 (28025), pcDNA3_myc3-Nrf2 (21555), M50 Super 8x TOPFlash (12456), M51 Super 8x FOPFlash (12457), ΔN(89) β-catenin (19288), ΔN(47)-β-catenin (19287), S33Y-β-catenin (19286), β-catenin (16828),β-catenin GFP (71367), mouse wt-βTrCP1 (20718), and mouse WD40 1–7 (62977) plasmids were from Addgene. pFN21A_HaloTag®-GSK3β and pFN21A_HaloTag®-β-TrCP1 were from Promega categorized HaloTag ORF clones. The pRK793 TEV protease (S219V mutant) bacterial expression plasmid (8827) was a kind gift of Dr. Jeffrey Boucher, Brandeis University, MA. pET28a empty vector and pET28a_His6_Halo-HA plasmid were kindly provided by Professor Lizbeth Hedstrom, Brandeis University, MA. pMIR-CMV_eGFP-RNRα plasmid was a gift from Professor JoAnne Stubbe’s laboratory at MIT, MA. pGL4.37[luc2P/ARE/Hygro] and pGL4.75[hRluc/CMV] vectors were purchased from Promega. Empty pcDNA3 plasmid was a gift from Dr. Barbara Baird (Cornell University, Ithaca, NY). pFN21A HaloTag® CMV Flexi® Vector was a kind gift of Promega. All cloning primers were shown in Table S3. pFN21A_HaloTag®-Keap1 was cloned as follows. Step 1: Keap1 was PCR-cloned out from phrGFP-Keap1 using the Step-1 forward and reverse primers shown. In Step 2, the PCR product from Step 1 was PCR-extended using the extender primers shown. In Step 3, the resultant mega primer product from Step 2 was PCR-cloned into pFN21A_HaloTag®-β-TrCP1 plasmid linearized using Pvul1 restriction enzyme. pFN21A_β-TrCP1 (without the HaloTag®) was generated as follows. Step 1: β-TrCP1 was PCR-cloned out from pFN21A_HaloTag®-β-TrCP1 using the indicated primers in Table S3. In Step 2, the PCR product from Step 1 was PCR-extended using the extender primers shown. In Step 3, the resultant mega primer product from Step 2 was PCR-cloned into PFN21A_HaloTag®-β-TrCP1 plasmid (generated above) linearized using Bcl1 restriction enzyme. An “empty” pFN21a vector (control plasmid for β-TrCP1) was generated by scrambling the Kozak sequence of the pFN21A_HaloTag®-β-TrCP1 plasmid. Briefly, the one-step PCR protocol using the primers shown in Table S3 was employed after cutting the pFN21A_β-TrCP1 plasmid (made above) with NheI. ARE::GFP reporter plasmid was cloned as follows. Step 1: eGFP sequence was PCR-cloned out from the plasmid encoding CMV_eGFP-RNRα (above) using the Step-1 primers shown in Table S3. The PCR product from Step 1 was extended using the Step-2 primers indicated. Step 3 involves digesting pGL4.37[luc2P/ARE/Hygro] vector (above) with EcoR1 followed by PCR-cloning of the PCR-product from Step 2 which serves as the mega primer for this final cloning step. Individual plasmids were validated by sequencing the entire gene at the Cornell University sequencing core facility.
The ‘empty vector’ plasmid used in this work is capable of creating mRNA from the CMV promoter (that drives transgene expression in the expression plasmids). This mRNA will also contain an SV40 poly-A tail sequence and is processed by the poly-A tail machinery. In this way, the empty vector controls for several aspects of “stress” that the transfection procedure may put on the cell, thereby serving as a better control than, for instance, a promoter-less plasmid.
shRNAs
The following shRNA sequences were used in pLKO1 vector. The shRNA plasmids for GSK3β, βTRCP, PTEN, and Akt were gifts from Dr. Andrew Grimson (Cornell University, Ithaca, NY). For details, see lentivirus production and infection method sections.
shControls
CGCGATCGTAATCACCCGAGT (lac Z, shControl 1)
GTCGAGCTGGACGGCGACGTA (GFP, shControl 2)
shβ-TrCP1
GCGTTGTATTCGATTTGATAA (1)
GCTGAACTTGTGTGCAAGGAA (2)
AGATGTGGAAGACATAGTTTA (3)
shGSK3β
AGCAAATCAGAGAAATGAAC (1)
CATGAAAGTTAGCAGAGACAA (2)
shPTEN
ATTTCGGGCACCGCATATTAA (1)
GGGCTTTAACTGTAGTATTTG (2)
Chemicals, reagents, and equipment/software
All chemicals were from Sigma-Aldrich and were of the highest grade unless otherwise stated. Cyanine5(Cy5)-azide was from Lumiprobe (B3030). TCEP was from ChemImpex. Chemical syntheses of Ht-preHNE alkyne and HNE-alkyne are reported in SI. Hygromycin B and Zeocin were from Invitrogen. AlamarBlue® was from Invitrogen, used as the manufacturer’s instructions. Minimal Essential Media, RPMI, Opti-MEM, Dulbecco’s PBS, 100X pyruvate (100 mM), 100X non-essential amino acids (11140-050) and 100X penicillin streptomycin (15140-122) were from Gibco. Protease inhibitor cocktail complete EDTA-free was from Roche. All primers were from IDT. Phusion HotStartII polymerase was from Thermo and all the restriction enzymes were from NEB. HEK293T cells were from American Type Culture Collection (ATCC). 1X PBS (Dulbecco’s phosphate-buffered saline), 1X TrypLETM Express (stable trypsin-like enzyme with phenol red), 1X DMEM, AlamarBlue® cell viability reagent (DAL1100), 10mg/ml puromycin, and 100X penicillin-streptomycin were from Invitrogen. Fetal bovine serum (FBS) (F2442) was from Sigma. Serum-compatible broad-spectrum transfection reagent TransIT-2020 was from Mirus Bio LLC. Polyethylenimine (PEI) was from Polyscience Inc. (23966). CHIR-99021 was from Sigma. Quick –DNA™ Miniprep Plus kit (D4068) for genomic DNA isolation was from Zymo Research. His6-Tev-S219V and His6-Halo-HA were recombinantly expressed and purified from E. coli using TALON affinity chromatography (Clontech).
Transient transfection of mammalian cells
Transient transfection was performed in most cases at 50–60% confluency using Mirus TransIT-2020 (Mirus MIR5400) according to the manufacturer’s protocol. In cases in which polyethylenimine (PEI) (Polyscience Inc, 23966) transfection was performed (e.g., Figure 7), the cells were allowed to reach a higher cell density (60–70% confluency) at the point of transfection. Briefly, 6 μl of 1 mg/ml PEI stock solution [prepared and stored as frozen aliquots in sterile filtered water (pH 7.4)] was mixed with 1.5 μg of plasmid DNA in 150 μl of serum-free media. Subsequent to 15 min-incubation period, the resulting mixture was diluted into complete cell growth media (1.5 ml). ~60–70% confluent monolayered cells in an 8 cm2 adherent culture dish were subsequently treated with the resulting solution. Experiments were performed 24-h post transfection.
Analysis of cell growth in shRNA-integrated cell lines
For each of the shRNA-knockdown HEK293T lines, 70000 cells were plated in duplicate wells of a 6-well plate. At each indicated time point (24, 48, 72h), cells were harvested by trypsinization and 20 μl of the final cell suspension in 1X PBS was mixed with 20 μl of trypan blue solution (Hyclone SV30084.01). The mixture was loaded onto a hemacytometer (Hausser Scientific 1490) and 4 areas of 1 mm2 were manually counted and averaged. Data is presented as the mean of duplicate wells ± SD.
Cell lysis, SDS-PAGE, and western blotting
Whole cell lysates was prepared by three cycles of rapid freeze-thaw in a chilled freshly prepared lysis buffer containing 50 mM Hepes buffer (pH 7.6), 1% Nonidet P-40, and 0.3 mM TCEP. Cell extract was clarified by centrifugation at 16,000 × g for 8 min at 4 °C. Total protein concentration in lysate was determined using Bradford Assay. SDS-PAGE was carried out using polyacrylamide gels (typically 10%) on a Bio-Rad miniprotean II apparatus. Transfer was carried out using a tank apparatus in transfer buffer (Towbin Buffer containing 15% MeOH). Samples were transferred onto PVDF membrane that had been pre-equilibrated in 100% MeOH for 3 min, then transfer buffer until required, at 90V for 1 h, then 90 V for 3–4 h in an ice bath with stirring. Blots were blocked in 5–10% fat free milk (Wegmans) then exposed to primary and secondary antibodies in 1% fat free milk. All blocking/incubation/wash solutions were made in 100 mM Tris pH 7.6, 150 mM NaCl, 0.05% Tween-20. Aside from last wash prior to visualization that did not contain Tween-20. Mostly blocking was carried out for 1 h at room temperature (rt), and the blot was incubated with primary antibody overnight at 4 oC. Secondary antibody incubation was for 40–60 min. When required, HRP was inhibited using sodium azide, or blot was stripped using SDS/BME solution at 55 °C.
AlamarBlue® assays
2000 or 4000 (identical results were obtained) cells were plated in black 96-well plates (total volume 100 μl) and allowed to grow for 48 h. After this time cells were transfected with the indicated plasmid if applicable and allowed to grow for another 48 h. After this time, AlamarBlue® (10 μl) was added and cells were maintained at 37 °C. At the appropriate time point, number of cells was measured using fluorescence as per the manufacturer’s protocol. Data shown are mean ± standard deviation of at least 8 independent replicates.
LDH-release assays
This was carried out using the Pierce LDH cytotoxicity Assay Kit (88953) as per the manufacturer’s instructions. LDH was not inhibited by up to 25 μM for up to 18 h incubation.
Caspase activity assays
Cells were transfected with 1:1:1:0.025 Halo-Keap1: Myc-Nrf2: ARE::Firefly luciferase: CMV::Renilla luciferase as described and subjected to T-REX conditions, controls, HNE or staurosporine as described in main text. After 18 h, media was removed from cells then cells were lysed in passive 1X lysis buffer, then separately assayed for (1) caspase activity by adding 40 μL lysate to 150 μL 50 mM HEPES (pH 7.6), 0.1% CHAPS, 5 mM DTT, 10 μM Ac-DEVD-AMC and measuring time dependent AMC release by fluorescence (ex: 360 nm; em: 460 nm) on a Biotek Cytation 3 in a 96-well black plate. (2) AR was measured using the dual reporter assay as described. Caspase activity was normalized to the signal for renilla luciferase.
T-REX targeting of Keap1 in knockdown cells and shControl cells
Growth media were changed to complete media that do not contain puromycin 24 h prior to treatment with HaloTag-targetable caged precursors. All steps hereafter were handled in the dark. Cells were treated with the designated HaloTag-targetable caged precursor at a final concentration of 25 μM for 2.5 h in serum-free media. Rinsing (x3) was performed every 30 min over 1.5 h with the serum-free media. For the samples designated for light exposure, plate covers were removed and mono-layered adherent cultures were exposed to 365 nm, 5 mW/cm2 lamp for 20 min at room temperature (at ~1.5 cm distance from the light source) and re-incubated at 37 °C for a further 5 min prior to harvest. Subsequent to centrifugation (500 × g, 8 min) and washing with 1X PBS (x2), the resultant cell pellets were flash-frozen in liq N2 and subjected to 3 cycles of freeze-thaw in 15 μl lysis buffer that contained in final concentrations, 50 mM Hepes (pH 7.6), 0.3 mM TCEP and 1% Nonidet. All steps hereafter were performed at 4 °C. Debris was removed by centrifugation (18,000 × g, 8 min). A portion of the clarified lysate was made up to final volume of 25 μl containing, in final concentrations, 50 mM Hepes (pH 7.6), 1.0 mg/ml lysate protein (measured by Bradford assay), and 0.2 mg/ml His6-Tev-S219V. The mixture was incubated at 37 °C for 45 min, and subsequently subjected to Click reaction. Briefly, in a final volume of 30L, the reaction mixture contained, in final concentrations, 42 mM Hepes (pH 7.6), 1.7 mM TCEP, 5% v/v tBuOH, 1% wt/v SDS, 1 mM CuSO4, 0.1 mM TBTA, 10 μM Cy5 azide and Tev-protease-treated lysate above. Subsequent to 30-min incubation at 37 °C, the reaction was quenched with 5 μl of 4X Laemmli buffer that contained 6% BME and further incubated for 5 min at 37 °C. 20 μl was directly loaded into each well of 10% polyacrylamide gel. Upon completion of the gel-electrophoresis, the gel was rinsed with ddH2O (x2, 5 min) and analyzed for Cy5 signal on a Bio-Rad ChemiDoc-MP and, where applicable, the gel was subsequently transferred to a PVDF membrane for western blot analysis.
ARE-luciferase assays
Unless otherwise specified, Cignal Antioxidant Response Reporter (luc) Kit (CCS-5020L) was from Qiagen and used according to the manufacturer’s protocol. In specific cases as indicated in the figure legends, a mixture of luciferase plasmids (pGL4.37, E364A from Promega and pGL4.75, E693A from Promega, used as a 20:1 pGL4.37/pGL4.75 mixture) was used instead of the plasmid mixture in the commercially available Qiagen kit. Following 18 h of treatment, cells were lysed with lysis buffer (Promega). Transcription activity was determined by the expression of firefly luciferase and was normalized to the Renilla luciferase levels by using a dual luciferase reporter assay kit (Promega). Data collection was done on a BioTek cytation3 multi-mode microplate reader.
ARE-GFP reporter assays using flow cytometry
Cells were transfected with 1:1:1 Halo-TEV-Keap1 (this construct must not express a fluorescent protein, such as DSRED): myc-Nrf2 (or mutant Nrf2): pARE::GFP using TransIT-2020 (Mirus Bio) for 24 h. After this time, T-REX was performed as described elsewhere in this SI. When required (18 h post light shining) cells were trypsinized and resuspended in 1% FBS in PBS. Gating was carried out as follows: live cells are first gated by forward (size) and side scatter to give a general population of healthy cells. This specific gating is applied to each data set (e.g., photocaged precursor Ht-PreHNE alone, light alone, etc.). This population should be a single group and be the largest single population for each data set. We gated the scatter group in several ways, and similar downstream results were obtained, but it is important that every data set (including all appropriate controls) is gated the same way. The average (geometric mean) green fluorescence of the viable population was then measured for each set of cells. For the integrated ARE::GFP reporter line, experiments were carried out as above, except no ARE::GFP plasmid was used.
TOP/FOP Wnt activity assay
HEK293T cells were transfected with plasmids encoding TOP::firefly luciferase, CMV::Renilla luciferase, varying ratios of CMV::ΔN-β-catenin:null, and either null or Nrf2. An equivalent set of cells were transfected with the same plasmid sets except FOP::firefly luciferase was substituted for TOP::luciferase. After 48 h, Wnt levels were measured after lysing cells with lysis buffer (Promega). Transcription activity was determined by the expression of firefly luciferase and was normalized to the Renilla luciferase levels by using a dual luciferase reporter assay kit (Promega). Data collection was done on a BioTek cytation3 multi-mode microplate reader. Data is reported by taking the ratio of TOP (or FOP):Renilla luciferase, then dividing the average of TOP by FOP.
Immunofluorescence analysis
Cells were grown in 35 mm glass bottom plates to appropriate confluence and treated as described. At the conclusion of the experiment, cells were fixed by addition of 2 ml MeOH (−20 °C) for 20 min (−20 °C). MeOH was removed and PBS was added and stored at 4 °C for days to weeks. Cells were then washed 3 times with PBS and carried straight on to blocking. When required cells were treated with 2 ml imaging blocking buffer: 3% BSA & 0.2% Triton x-100 in PBS at 37 °C for 1 h. Plates were washed 2 times with PBS (1 ml), then treated with primary antibody, in antibody incubation buffer (dilutions specified in TableS1): 1% BSA and 0.02% Triton x-100 in PBS, using 120–150 μl to cover only the glass portion of the plate. Plates were incubated at rt for 2 h. Primary antibody was removed (it could be reused at least 3 times) and plates were washed two times with PBS (1 ml). Then secondary antibody (120–150 μl; 1:1000 dilution in antibody incubation buffer) was added (1 h). Plates were washed one time in PBS containing 1 μg/ml DAPI, then once with PBS and stored at 4 °C until ready to image.
Generation of monoclonal HEK293T lines expressing a single copy of pARE::GFP reporter construct
HEK293T cells were transfected with ARE:GFP plasmid described above. 24-hours post transfection, selection was begun with 200 μg/ml Hygromycin in complete cell-growth media. At every 2nd or 3rd day, the existing media were replaced with fresh media containing 200 μg/ml Hygromycin until around 20% to 30% survival of cells were noted in the culture plate (typically this process takes 10 to 15 days). At this point, the selection pressure was lowered to 50 to 100 μg/ml of Hygromycin in the complete growth media until the cells began to grow and form colonies (typically this process takes 2 to 3 weeks). When the size of those colonies reached around 3 mm in diameter, individual clones were trypsinized by Pyrex® cloning cylinders (Corning catalog no. 3166-10) and culturing was continued in a 6 well-plate until confluency was reached. Each plate of cells was harvested and either the cell stocks were generated, or the downstream response assays were performed as appropriate. In this case, flow-cytometry and live-cell-imaging analyses of ARE::GFP upregulation in response to HNE time/dose were validated in each clone.
qRT-PCR analysis
qRT-PCR analysis was performed as previously described (Long, et al., 2017; Parvez, et al., 2015). Briefly, total RNA was extracted and purified using TRIzol® Plus RNA Purification kit (Life Technologies, 1218355) per manufacturer’s suggestion. Cells from each 35 mm dishes (8 cm2) were homogenized in 1 ml TRIzol reagent for 2 min. Around 600 ng of the total isolated RNA was reverse transcribed using SuperScript® III Reverse Transcriptase (Life Technologies, 18080093). qRT-PCR analysis was performed with iQ™ SYBRR Green Supermix (Bio-Rad, 170-8880) on a MyiQ™ Single-Color Real-Time PCR Detection System (Bio-Rad, 170-9740). In a total volume of 20 μl the PCR reaction mix contained, in final concentrations, 1X iQ™ SYBR® Green Supermix, 0.35 μM each of the forward and reverse primers and 20 ng of template cDNA. The qPCR program was set for 3 min at 95 °C followed by 45-repeat cycles comprising heating at 95 °C for 10 s and at 55 °C for 30 s. The expected products were of ~100–150 bp in size. The primers used for each gene are specified in Table S2. All primers were validated as specified previously (Parvez, et al., 2015).
Verification of genomic DNA sequences
Genomic DNA was isolated from HEK293T, HeLa, and COS-7 cells using Quick –DNA™ Miniprep Plus kit per manufacturer’s recommendations. The entire gene was amplified in fragments using the indicated primers. DNA was sequenced using the primers in Table S2. The results are summarized in Table S3–S4.
QUANTIFICATION AND STATISTICAL ANALYSIS
In gel fluorescence analysis, western blot, and Coomassie
Western blots were all imaged using HRP-conjugated secondary or primary antibodies. Gels were stained using Coomassie brilliant blue. In gel fluorescence analysis and imaging of the Coomassie-stained gels were performed on Bio-Rad ChemiDoc-MP imaging system. Densitometric quantitation was made by Bio-Rad Image Lab software (v 4.1). Cy5 excitation source was red epi illumination and emission filter used was 695/55 filter. Light exposure experiments were performed with the use of a hand-held UV lamp (Fisher, S45157, 365 nm, longwave 4 W tube at 5 mW/cm2). Data were analyzed using Graphpad Prism. Data are presented as mean +/− s.d or s.e.m as indicated. A two-tailed unpaired t-test was used to determine differences between control and experimental samples. A p-value of <0.05 was considered significant. p-values are either explicitly stated on each bar or denoted with an asterisk (*). In all figures, Student’s t-test was performed to determine significance. n.s = non-significant, *p < 0.05, **p < 0.01, ***p< 0.001 and ****p < 0.0001. Minimally N =3 independent biological replicates for each data set were performed.
Luciferase assay and flow-cytometry data
Luciferase reporter assay data were collected on a BioTekTM Cytation™ 3 cell imaging multi-mode microplate reader. Flow cytometry was carried out on a Beckman Dickinson LSR-II flow cytometer (Cornell Biotechnology Flow Cytometers Core Facility) equipped with 407, 488, 633 nm lasers. Typically single color analysis was conducted. For two-color analysis chromatically orthogonal fluorophores (488, 647 nm) were used without compensation. Curve fitting and data analysis were performed using GraphPad Prism (v 6.0). Typically significance was analyzed using the T-test. P values were obtained by an unpaired T-test. Cell counting was performed by Countess II (Invitrogen). Data are presented as mean +/− s.d or s.e.m as indicated. A two-tailed unpaired t-test was used to determine differences between control and experimental samples. A p-value of <0.05 was considered significant. p-values are either explicitly stated on each bar or denoted with an asterisk (*). In all figures, Student’s t-test was performed to determine significance. n.s = non-significant, *p < 0.05, **p < 0.01, ***p< 0.001 and ****p < 0.0001. Minimally N =3 independent biological replicates for each data set were performed.
Quantification of imaging data
Olympus CKX31 microscope system was used for light microscopy and Zeiss LSM710 for confocal microscopy. Quantification was performed using the histogram function in Image-J (NIH). For all instances, at least 40 cells from multiple independent frames were captured. Plotted data show mean ± s.e.m > 40-cells-per-point. Most of the magnification settings were 40X water objective with 10X digital zoom. Imaging data shown are mean and s.e.m. and significance was assessed using the T-test. A p-value of <0.05 was considered significant. p-values are either explicitly stated on each bar or denoted with an asterisk (*). In all figures, Student’s t-test was performed to determine significance. n.s = non-significant, *p < 0.05, **p < 0.01, ***p< 0.001 and ****p < 0.0001.
Supplementary Material
Acknowledgments
Prof. Andrew Grimson and Dr. Rene Giessler for lentiviral-based shRNA technique transfer; NSF CAREER, NIH New Innovator, Sloan Fellowship, Beckman Young Investigator, ONR Young Investigator (Y.A); HHMI Fellowship (S.P.); NIH CBI Fellowship (to J.R.P.); NSF-MRI (CHE-1531632, PI: Y.A.) for NMR; Sanjna L. Surya for TEV protease; Flow Cytometry (ESSCF, NYS-DOH, Contract #C026718) and Imaging (NIH 1S10RR025502, PI: R. M. Williams).
Footnotes
One interesting exception we found was β-catenin-GFP. This fusion protein downregulated AR consistently in all lines (Figure S4B). We advise caution using this β-catenin construct in contexts where AR is under investigation.
Although we found that the β-catenin-GFP regulated AR differently to the untagged wt protein (Figure S4B), we found that the GFP-fusion β-catenin functions similarly to wt-β-catenin in the study of Wnt signaling. We thus chose to continue using β-catenin-GFP alongside wt-β-catenin in these experiments to investigate this matter further.
Author Contributions
Conceptualization, Y.A.; Investigation, M.J.C.L., H-Y.L., S.P., Y.Z., J.R.P., and P.H.; (M.J.C.L. generated the knockdown lines, executed imaging, reporter assays, and flow cytometry experiments. H-Y.L. performed AR reporter assays. S.P. and J.R.P. performed qRT-PCR analyses. Y.Z. generated the clonal ARE-GFP- reporter cells and synthesized T-REX probes. J.R.P. and P.H. respectively assisted in knockdown line validations and syntheses); Writing – Y.A. and M.J.C.L. (main text); all authors (SI); S.P. (figures); Funding Acquisition and Supervision, Y.A.
References
- Alomar SY, Mansour L, Abuderman A, Alkhuriji A, Arafah M, Alwasel S, Harrath AH, Almutairi M, Trayhyrn P, Dar JA. β-Catenin accumulation and S33F mutation of CTNNB1 gene in colorectal cancer in Saudi Arabia. Polish Journal of Pathology. 2016;2:156–162. doi: 10.5114/pjp.2016.61452. [DOI] [PubMed] [Google Scholar]
- Blewett MM, Xie J, Zaro BW, Backus KM, Altman A, Teijaro JR, Cravatt BF. Chemical proteomic map of dimethyl fumarate-sensitive cysteines in primary human T cells. Sci Signal. 2016;9:rs10. doi: 10.1126/scisignal.aaf7694. [DOI] [PMC free article] [PubMed] [Google Scholar]
- Bryan HK, Olayanju A, Goldring CE, Park BK. The Nrf2 cell defence pathway: Keap1-dependent and -independent mechanisms of regulation. Biochemical pharmacology. 2013;85:705–717. doi: 10.1016/j.bcp.2012.11.016. [DOI] [PubMed] [Google Scholar]
- Cadigan KM, Nusse R. Wnt signaling: a common theme in animal development. Genes & development. 1997;11:3286–3305. doi: 10.1101/gad.11.24.3286. [DOI] [PubMed] [Google Scholar]
- Chan E, Gat U, McNiff JM, Fuchs E. A common human skin tumour is caused by activating mutations in [beta]-catenin. Nat Genet. 1999;21:410–413. doi: 10.1038/7747. [DOI] [PubMed] [Google Scholar]
- Chen J, Wang L, Chen Y, Sternberg P, Cai J. Phosphatidylinositol 3 kinase pathway and 4-hydroxy-2-nonenal-induced oxidative injury in the RPE. Invest Ophthalmol Vis Sci. 2009;50:936–942. doi: 10.1167/iovs.08-2439. [DOI] [PMC free article] [PubMed] [Google Scholar]
- Chorley BN, Campbell MR, Wang X, Karaca M, Sambandan D, Bangura F, Xue P, Pi J, Kleeberger SR, Bell DA. Identification of novel NRF2-regulated genes by ChIP-Seq: influence on retinoid X receptor alpha. Nucleic Acids Res. 2012;40:7416–7429. doi: 10.1093/nar/gks409. [DOI] [PMC free article] [PubMed] [Google Scholar]
- Chowdhry S, Zhang Y, McMahon M, Sutherland C, Cuadrado A, Hayes JD. Nrf2 is controlled by two distinct beta-TrCP recognition motifs in its Neh6 domain, one of which can be modulated by GSK-3 activity. Oncogene. 2013;32:3765–3781. doi: 10.1038/onc.2012.388. [DOI] [PMC free article] [PubMed] [Google Scholar]
- Cruciat CM. Casein kinase 1 and Wnt/beta-catenin signaling. Curr Opin Cell Biol. 2014;31:46–55. doi: 10.1016/j.ceb.2014.08.003. [DOI] [PubMed] [Google Scholar]
- Crunkhorn S. Deal watch: Abbott boosts investment in NRF2 activators for reducing oxidative stress. Nature reviews. Drug discovery. 2012;11:96. doi: 10.1038/nrd3655. [DOI] [PubMed] [Google Scholar]
- Cuadrado A. Structural and functional characterization of Nrf2 degradation by glycogen synthase kinase 3/beta-TrCP. Free Radic Biol Med. 2015;88:147–157. doi: 10.1016/j.freeradbiomed.2015.04.029. [DOI] [PubMed] [Google Scholar]
- Davis M, Hatzubai A, Andersen JS, Ben-Shushan E, Fisher GZ, Yaron A, Bauskin A, Mercurio F, Mann M, Ben-Neriah Y. Pseudosubstrate regulation of the SCF(beta-TrCP) ubiquitin ligase by hnRNP-U. Genes & development. 2002;16:439–451. doi: 10.1101/gad.218702. [DOI] [PMC free article] [PubMed] [Google Scholar]
- Dev S, Kumari S, Singh N, Kumar Bal S, Seth P, Mukhopadhyay CK. Role of extracellular Hydrogen peroxide in regulation of iron homeostasis genes in neuronal cells: Implication in iron accumulation. Free Radic Biol Med. 2015;86:78–89. doi: 10.1016/j.freeradbiomed.2015.05.025. [DOI] [PubMed] [Google Scholar]
- Dozza B, Smith MA, Perry G, Tabaton M, Strocchi P. Regulation of glycogen synthase kinase-3beta by products of lipid peroxidation in human neuroblastoma cells. Journal of neurochemistry. 2004;89:1224–1232. doi: 10.1111/j.1471-4159.2004.02413.x. [DOI] [PubMed] [Google Scholar]
- Fang X, Fu Y, Long MJ, Haegele JA, Ge EJ, Parvez S, Aye Y. Temporally controlled targeting of 4-hydroxynonenal to specific proteins in living cells. Journal of the American Chemical Society. 2013;135:14496–14499. doi: 10.1021/ja405400k. [DOI] [PMC free article] [PubMed] [Google Scholar]
- Fuchs SY, Spiegelman VS, Suresh Kumar KG. The many faces of [beta]-TrCP E3 ubiquitin ligases: reflections in the magic mirror of cancer. Oncogene. 2004;23:2028–2036. doi: 10.1038/sj.onc.1207389. [DOI] [PubMed] [Google Scholar]
- Funato Y, Michiue T, Asashima M, Miki H. The thioredoxin-related redox-regulating protein nucleoredoxin inhibits Wnt-[beta]-catenin signalling through Dishevelled. Nat Cell Biol. 2006;8:501–508. doi: 10.1038/ncb1405. [DOI] [PubMed] [Google Scholar]
- Gerstein AV, Almeida TA, Zhao G, Chess E, Shih Ie M, Buhler K, Pienta K, Rubin MA, Vessella R, Papadopoulos N. APC/CTNNB1 (beta-catenin) pathway alterations in human prostate cancers. Genes Chromosomes Cancer. 2002;34:9–16. doi: 10.1002/gcc.10037. [DOI] [PubMed] [Google Scholar]
- Harder B, Jiang T, Wu T, Tao S, Rojo de la Vega M, Tian W, Chapman E, Zhang DD. Molecular mechanisms of Nrf2 regulation and how these influence chemical modulation for disease intervention. Biochemical Society transactions. 2015;43:680–686. doi: 10.1042/BST20150020. [DOI] [PMC free article] [PubMed] [Google Scholar]
- Hayes JD, Dinkova-Kostova AT. The Nrf2 regulatory network provides an interface between redox and intermediary metabolism. Trends in biochemical sciences. 2014;39:199–218. doi: 10.1016/j.tibs.2014.02.002. [DOI] [PubMed] [Google Scholar]
- Hershfield MS, Aiyar VN, Premakumar R, Small WC. S-Adenosylhomocysteine hydrolase from human placenta. Affinity purification and characterization. Biochemical Journal. 1985;230:43–52. doi: 10.1042/bj2300043. [DOI] [PMC free article] [PubMed] [Google Scholar]
- Houghton CA, Fassett RG, Coombes JS. Sulforaphane and Other Nutrigenomic Nrf2 Activators: Can the Clinician’s Expectation Be Matched by the Reality? Oxidative medicine and cellular longevity. 2016;2016:7857186. doi: 10.1155/2016/7857186. [DOI] [PMC free article] [PubMed] [Google Scholar]
- Huang Y, Li W, Kong ANT. Anti-oxidative stress regulator NF-E2-related factor 2 mediates the adaptive induction of antioxidant and detoxifying enzymes by lipid peroxidation metabolite 4-hydroxynonenal. Cell & Bioscience. 2012;2:40. doi: 10.1186/2045-3701-2-40. [DOI] [PMC free article] [PubMed] [Google Scholar]
- Jacobs AT, Marnett LJ. Systems Analysis of Protein Modification and Cellular Responses Induced by Electrophile Stress. Accounts of Chemical Research. 2010;43:673–683. doi: 10.1021/ar900286y. [DOI] [PMC free article] [PubMed] [Google Scholar]
- Kachadourian R, Pugazhenthi S, Velmurugan K, Backos DS, Franklin CC, McCord JM, Day BJ. 2′,5′-Dihydroxychalcone-induced glutathione is mediated by oxidative stress and kinase signaling pathways. Free Radic Biol Med. 2011;51:1146–1154. doi: 10.1016/j.freeradbiomed.2011.05.041. [DOI] [PMC free article] [PubMed] [Google Scholar]
- Kensler TW, Wakabayashi N, Biswal S. Cell survival responses to environmental stresses via the Keap1-Nrf2-ARE pathway. Annu Rev Pharmacol Toxicol. 2007;47:89–116. doi: 10.1146/annurev.pharmtox.46.120604.141046. [DOI] [PubMed] [Google Scholar]
- Kim WD, Kim YW, Cho IJ, Lee CH, Kim SG. E-cadherin inhibits nuclear accumulation of Nrf2: implications for chemoresistance of cancer cells. Journal of cell science. 2012;125:1284–1295. doi: 10.1242/jcs.095422. [DOI] [PubMed] [Google Scholar]
- Koch A, Denkhaus D, Albrecht S, Leuschner I, von Schweinitz D, Pietsch T. Childhood Hepatoblastomas Frequently Carry a Mutated Degradation Targeting Box of the β-Catenin Gene. Cancer Research. 1999;59:269–273. [PubMed] [Google Scholar]
- Lai AC, Crews CM. Induced protein degradation: an emerging drug discovery paradigm. Nature reviews. Drug discovery. 2017;16:101–114. doi: 10.1038/nrd.2016.211. [DOI] [PMC free article] [PubMed] [Google Scholar]
- Lassot I, Segeral E, Berlioz-Torrent C, Durand H, Groussin L, Hai T, Benarous R, Margottin-Goguet F. ATF4 degradation relies on a phosphorylation-dependent interaction with the SCF(betaTrCP) ubiquitin ligase. Molecular and cellular biology. 2001;21:2192–2202. doi: 10.1128/MCB.21.6.2192-2202.2001. [DOI] [PMC free article] [PubMed] [Google Scholar]
- Levonen AL, Landar A, Ramachandran A, Ceaser EK, Dickinson DA, Zanoni G, Morrow JD, Darley-usmar VM. Cellular mechanisms of redox cell signalling: role of cysteine modification in controlling antioxidant defences in response to electrophilic lipid oxidation products. Biochemical Journal. 2004;378:373–382. doi: 10.1042/BJ20031049. [DOI] [PMC free article] [PubMed] [Google Scholar]
- Li N, Alam J, Venkatesan MI, Eiguren-Fernandez A, Schmitz D, Di Stefano E, Slaughter N, Killeen E, Wang X, Huang A, et al. Nrf2 Is a Key Transcription Factor That Regulates Antioxidant Defense in Macrophages and Epithelial Cells: Protecting against the Proinflammatory and Oxidizing Effects of Diesel Exhaust Chemicals. The Journal of Immunology. 2004;173:3467–3481. doi: 10.4049/jimmunol.173.5.3467. [DOI] [PubMed] [Google Scholar]
- Liby KT, Yore MM, Sporn MB. Triterpenoids and rexinoids as multifunctional agents for the prevention and treatment of cancer. Nature reviews. Cancer. 2007;7:357–369. doi: 10.1038/nrc2129. [DOI] [PubMed] [Google Scholar]
- Lin HY, Haegele JA, Disare MT, Lin Q, Aye Y. A generalizable platform for interrogating target- and signal-specific consequences of electrophilic modifications in redox-dependent cell signaling. Journal of the American Chemical Society. 2015;137:6232–6244. doi: 10.1021/ja5132648. [DOI] [PMC free article] [PubMed] [Google Scholar]
- Long MJ, Parvez S, Zhao Y, Surya SS, Wang Y, Zhang S, Aye Y. Akt3 is a privileged first responder in isozyme-specific electrophile response. Nature Chemical Biology. 2017a;13:333–338. doi: 10.1038/nchembio.2284. [DOI] [PMC free article] [PubMed] [Google Scholar]
- Long MJ, Poganik JR, Aye Y. On-Demand Targeting: Investigating Biology with Proximity-Directed Chemistry. Journal of the American Chemical Society. 2016;138:3610–3622. doi: 10.1021/jacs.5b12608. [DOI] [PMC free article] [PubMed] [Google Scholar]
- Long MJ, Poganik JR, Ghosh S, Aye Y. Subcellular Redox Targeting: Bridging in Vitro and in Vivo Chemical Biology. ACS Chem Biol. 2017b;12:586–600. doi: 10.1021/acschembio.6b01148. [DOI] [PMC free article] [PubMed] [Google Scholar]
- Ma Q. Role of nrf2 in oxidative stress and toxicity. Annu Rev Pharmacol Toxicol. 2013;53:401–426. doi: 10.1146/annurev-pharmtox-011112-140320. [DOI] [PMC free article] [PubMed] [Google Scholar]
- Menegon S, Columbano A, Giordano S. The Dual Roles of NRF2 in Cancer. Trends in Molecular Medicine. 2016;22:578–593. doi: 10.1016/j.molmed.2016.05.002. [DOI] [PubMed] [Google Scholar]
- Nusse R, Varmus HE. Many tumors induced by the mouse mammary tumor virus contain a provirus integrated in the same region of the host genome. Cell. 1982;31:99–109. doi: 10.1016/0092-8674(82)90409-3. [DOI] [PubMed] [Google Scholar]
- Parvez S, Fu Y, Li J, Long MJ, Lin HY, Lee DK, Hu GS, Aye Y. Substoichiometric hydroxynonenylation of a single protein recapitulates whole-cell-stimulated antioxidant response. Journal of the American Chemical Society. 2015;137:10–13. doi: 10.1021/ja5084249. [DOI] [PMC free article] [PubMed] [Google Scholar]
- Parvez S, Long MJ, Lin HY, Zhao Y, Haegele JA, Pham VN, Lee DK, Aye Y. T-REX on-demand redox targeting in live cells. Nature protocols. 2016;11:2328–2356. doi: 10.1038/nprot.2016.114. [DOI] [PMC free article] [PubMed] [Google Scholar]
- Polakis P. Wnt signaling in cancer. Cold Spring Harbor perspectives in biology. 2012:4. doi: 10.1101/cshperspect.a008052. [DOI] [PMC free article] [PubMed] [Google Scholar]
- Prosperini L, Pontecorvo S. Dimethyl fumarate in the management of multiple sclerosis: appropriate patient selection and special considerations. Therapeutics and clinical risk management. 2016;12:339–350. doi: 10.2147/TCRM.S85099. [DOI] [PMC free article] [PubMed] [Google Scholar]
- Rada P, Rojo AI, Chowdhry S, McMahon M, Hayes JD, Cuadrado A. SCF/{beta}-TrCP promotes glycogen synthase kinase 3-dependent degradation of the Nrf2 transcription factor in a Keap1-independent manner. Molecular and cellular biology. 2011;31:1121–1133. doi: 10.1128/MCB.01204-10. [DOI] [PMC free article] [PubMed] [Google Scholar]
- Rada P, Rojo AI, Offergeld A, Feng GJ, Velasco-Martín JP, González-Sancho JM, Valverde ÁM, Dale T, Regadera J, Cuadrado A. WNT-3A Regulates an Axin1/NRF2 Complex That Regulates Antioxidant Metabolism in Hepatocytes. Antioxidants & Redox Signaling. 2015;22:555–571. doi: 10.1089/ars.2014.6040. [DOI] [PMC free article] [PubMed] [Google Scholar]
- Rudolph TK, Freeman BA. Transduction of Redox Signaling by Electrophile-Protein Reactions. Science Signaling. 2009;2:re7–re7. doi: 10.1126/scisignal.290re7. [DOI] [PMC free article] [PubMed] [Google Scholar]
- Ryu MJ, Cho M, Song JY, Yun YS, Choi IW, Kim DE, Park BS, Oh S. Natural derivatives of curcumin attenuate the Wnt/beta-catenin pathway through down-regulation of the transcriptional coactivator p300. Biochem Biophys Res Commun. 2008;377:1304–1308. doi: 10.1016/j.bbrc.2008.10.171. [DOI] [PubMed] [Google Scholar]
- Seo E, Kim H, Kim R, Yun S, Kim M, Han JK, Costantini F, Jho EH. Multiple isoforms of beta-TrCP display differential activities in the regulation of Wnt signaling. Cellular signalling. 2009;21:43–51. doi: 10.1016/j.cellsig.2008.09.009. [DOI] [PMC free article] [PubMed] [Google Scholar]
- Shin SY, Kim CG, Jho EH, Rho MS, Kim YS, Kim YH, Lee YH. Hydrogen peroxide negatively modulates Wnt signaling through downregulation of β-catenin. Cancer Letters. 2004;212:225–231. doi: 10.1016/j.canlet.2004.03.003. [DOI] [PubMed] [Google Scholar]
- Smirnova NA, Haskew-Layton RE, Basso M, Hushpulian DM, Payappilly JB, Speer RE, Ahn YH, Rakhman I, Cole PA, Pinto JT, et al. Development of Neh2-luciferase reporter and its application for high throughput screening and real-time monitoring of Nrf2 activators. Chem Biol. 2011;18:752–765. doi: 10.1016/j.chembiol.2011.03.013. [DOI] [PMC free article] [PubMed] [Google Scholar]
- Song J, Wang Z, Ewing RM. Integrated analysis of the Wnt responsive proteome in human cells reveals diverse and cell-type specific networks. Mol Biosyst. 2014;10:45–53. doi: 10.1039/c3mb70417c. [DOI] [PMC free article] [PubMed] [Google Scholar]
- Sparks AB, Morin PJ, Vogelstein B, Kinzler KW. Mutational Analysis of the APC/β-Catenin/Tcf Pathway in Colorectal Cancer. Cancer Research. 1998;58:1130–1134. [PubMed] [Google Scholar]
- Spiegelman VS, Stavropoulos P, Latres E, Pagano M, Ronai Z, Slaga TJ, Fuchs SY. Induction of beta-transducin repeat-containing protein by JNK signaling and its role in the activation of NF-kappaB. The Journal of biological chemistry. 2001;276:27152–27158. doi: 10.1074/jbc.M100031200. [DOI] [PubMed] [Google Scholar]
- Sporn MB, Liby KT. NRF2 and cancer: the good, the bad and the importance of context. Nature reviews. Cancer. 2012;12:564–571. doi: 10.1038/nrc3278. [DOI] [PMC free article] [PubMed] [Google Scholar]
- Suzuki T, Motohashi H, Yamamoto M. Toward clinical application of the Keap1-Nrf2 pathway. Trends in Pharmacological Sciences. 34:340–346. doi: 10.1016/j.tips.2013.04.005. [DOI] [PubMed] [Google Scholar]
- Sykiotis GP, Bohmann D. Keap1/Nrf2 signaling regulates oxidative stress tolerance and lifespan in Drosophila. Dev Cell. 2008;14:76–85. doi: 10.1016/j.devcel.2007.12.002. [DOI] [PMC free article] [PubMed] [Google Scholar]
- Trott A, West JD, Klaić L, Westerheide SD, Silverman RB, Morimoto RI, Morano KA. Activation of Heat Shock and Antioxidant Responses by the Natural Product Celastrol: Transcriptional Signatures of a Thiol-targeted Molecule. Molecular Biology of the Cell. 2008;19:1104–1112. doi: 10.1091/mbc.E07-10-1004. [DOI] [PMC free article] [PubMed] [Google Scholar]
- Wang S, Gao Y, Song X, Ma X, Zhu X, Mao Y, Yang Z, Ni J, Li H, Malanowski KE, et al. Wnt signaling-mediated redox regulation maintains the germ line stem cell differentiation niche. eLife. 2015;4:e08174. doi: 10.7554/eLife.08174. [DOI] [PMC free article] [PubMed] [Google Scholar]
- Weinstock C, Schnaidt M. The complement-mediated prozone effect in the Luminex single-antigen bead assay and its impact on HLA antibody determination in patient sera. International Journal of Immunogenetics. 2013;40:171–177. doi: 10.1111/j.1744-313X.2012.01147.x. [DOI] [PubMed] [Google Scholar]
- Wu Y, Liu F, Liu Y, Liu X, Ai Z, Guo Z, Zhang Y. GSK3 inhibitors CHIR99021 and 6-bromoindirubin-3′-oxime inhibit microRNA maturation in mouse embryonic stem cells. Sci Rep. 2015;5:8666. doi: 10.1038/srep08666. [DOI] [PMC free article] [PubMed] [Google Scholar]
- Xu C, Kim NG, Gumbiner BM. Regulation of protein stability by GSK3 mediated phosphorylation. Cell cycle (Georgetown, Tex) 2009;8:4032–4039. doi: 10.4161/cc.8.24.10111. [DOI] [PMC free article] [PubMed] [Google Scholar]
- Zhang C, Cho K, Huang Y, Lyons JP, Zhou X, Sinha K, McCrea PD, de Crombrugghe B. Inhibition of Wnt signaling by the osteoblast-specific transcription factor Osterix. Proceedings of the National Academy of Sciences. 2008;105:6936–6941. doi: 10.1073/pnas.0710831105. [DOI] [PMC free article] [PubMed] [Google Scholar]
- Zheng N, Zhou Q, Wang Z, Wei W. Recent advances in SCF ubiquitin ligase complex: Clinical implications. Biochim Biophys Acta. 2016;1866:12–22. doi: 10.1016/j.bbcan.2016.05.001. [DOI] [PMC free article] [PubMed] [Google Scholar]
- Zou Y, Wang J, Peng J, Wei H. Oregano Essential Oil Induces SOD1 and GSH Expression through Nrf2 Activation and Alleviates Hydrogen Peroxide-Induced Oxidative Damage in IPEC-J2 Cells. Oxidative medicine and cellular longevity. 2016;2016:5987183. doi: 10.1155/2016/5987183. [DOI] [PMC free article] [PubMed] [Google Scholar]
- Zucman-Rossi J, Benhamouche S, Godard C, Boyault S, Grimber G, Balabaud C, Cunha AS, Bioulac-Sage P, Perret C. Differential effects of inactivated Axin1 and activated [beta]-catenin mutations in human hepatocellular carcinomas. Oncogene. 2006;26:774–780. doi: 10.1038/sj.onc.1209824. [DOI] [PubMed] [Google Scholar]
Associated Data
This section collects any data citations, data availability statements, or supplementary materials included in this article.