

Abstract
Pancreatic cancer cells overexpressing Mucin 1 (MUC1) rely on aerobic glycolysis and, correspondingly, are dependent on glucose for survival. Our NMR metabolomics comparative analysis of control (S2–013.Neo) and MUC1-overexpressing (S2–013.MUC1) cells demonstrates that MUC1 reprograms glutamine metabolism upon glucose limitation. The observed alteration in glutamine metabolism under glucose limitation was accompanied by a relative decrease in the proliferation of MUC1-overexpressing cells compared with steady-state conditions. Moreover, glucose limitation induces G1 phase arrest where S2–013.MUC1 cells fail to enter S phase and synthesize DNA because of a significant disruption in pyrimidine nucleotide biosynthesis. Our metabolomics analysis indicates that glutamine is the major source of oxaloacetate in S2–013.Neo and S2–013.MUC1 cells, where oxaloacetate is converted to aspartate, an important metabolite for pyrimidine nucleotide biosynthesis. However, glucose limitation impedes the flow of glutamine carbons into the pyrimidine nucleotide rings and instead leads to a significant accumulation of glutamine-derived aspartate in S2–013.MUC1 cells.
Keywords: cancer metabolism, MUC1 overexpression, glutamine metabolism, glucose limitation, NMR metabolomics
Introduction
Otto Warburg first observed an altered glucose metabolism in cancer cells in the 1930s, but our understanding of the underlying mechanism, and how to circumvent the process of malignant transformation and tumor metastasis, still remains elusive.1,2 The key to cancer cells’ high rate of proliferation is the cell’s ability to adapt to varying tumor microenvironments by reprograming its cellular metabolism. These metabolic adaptations are orchestrated by signal transactions, which are correspondingly regulated by oncogenes and tumor suppressor genes.3 For example, MUC1 is involved in a number of signaling pathways,4−6 such as Ras, β-catenin, p120 catenin, and p53, and has been recently identified as a master regulator of metabolism.7,8 Consequently, the level and pattern of MUC1 expression is altered in tumors.4,9 In fact, MUC1 overexpression has been identified in more than 80% of pancreatic adenocarcinomas10 and is also associated with poor prognosis,11 rapid metastasis,12 and chemotherapeutic drug resistance.13
Many cancers have high rates of glucose uptake and metabolize glucose via aerobic glycolysis. Correspondingly, the expression of glycolytic genes such as GAPDH, ALDOA, PKM, and ENO1 is important to cancer cell proliferation under these high glucose conditions.14 Even though aerobic glycolysis is an inefficient approach to produce energy from glucose compared with oxidative phosphorylation,15 the high rate of aerobic glycolysis enhances cancer cell proliferation by shunting glycolytic intermediates into multiple metabolic pathways that generate nucleotides, lipids, amino acids, and reducing equivalents that are all important for cell proliferation.16 At a systemic level, tumors employ diverse mechanisms to maintain a continuous supply of glucose from serum. Impaired glucose tolerance—elevated blood glucose associated with insulin resistance—is the earliest recognized metabolic abnormality in colon, gastric, sarcoma, prostate, localized head, neck, and lung cancers.17 Similarly, more than two-thirds of pancreatic cancer patients have an impaired glucose tolerance.18 Impaired glucose tolerance is also associated with cachexia, an excessive wasting of skeletal muscle and loss of adipose tissue mass,19 and an increase in hepatic glucose production and glucose recycling.17 An improved glucose metabolism that occurs after surgical removal of resectable pancreatic cancer is further evidence that pancreatic cancer is strongly correlated with a systemic alteration in glucose metabolism.20
Glucose deprivation or treatment of cancer cells using glycolytic inhibitor 2-deoxyglucose (2-DG) induces a stress response that leads to a reduction in cancer cell proliferation.21 Because the expression of mitochondrial oxidative phosphorylation genes is essential for cancer cells to proliferate under limited glucose conditions, sensitivity to low glucose or 2-DG is related to defects in mitochondrial respiration.22 Consequently, highly glycolytic pancreatic cancer cells are susceptible to 2-DG treatment, while less glycolytic pancreatic cancers are resistant to 2-DG. However, 2-DG resistant pancreatic cancer cells do respond to a combination treatment of 2-DG and metformin, which is a mitochondrial function inhibitor.23 These results indicate that cancer cell proliferation requires a balance between bioenergetics and biosynthesis that occurs through glucose metabolism.
Glucose is not the only metabolite important for cancer cell proliferation. In fact, there is a growing appreciation of the contribution of other metabolites to cancer cell biology.24 For example, amino acids are vital cellular metabolites that are involved in protein synthesis and signal transduction and are carbon and nitrogen sources for nucleotides and fatty acid synthesis. Consequently, alteration in amino acid metabolism, such as glutamine, has been previously shown to occur in cancer cells.25 Glutamine is the most abundant amino acid in humans, but even though glutamine is generally described as nonessential, it is necessary for the growth of many cultured cancer cell lines. Glutamine is an important source of nitrogen for cultured cancer cells.26,27 In addition, cancer cells use glutamine for essential amino acid transport, activating signaling proteins, and maintaining mitochondrial stability.28 Recently, glutamine has been identified as an important metabolite for the anabolic growth of cancer cells by providing precursors for the biosynthesis of lipids, proteins, and nucleic acids.3,24 Pancreatic cancer cells with a KRAS mutation are dependent on glutamine for NADPH production, which is important for maintaining redox balance and fatty acid synthesis.29 Furthermore, 95% of pancreatic ductal adenocarcinoma has activating mutations in KRAS that regulate cancer metabolism by inducing glucose uptake, channeling of glucose intermediates, and upregulation of glutamine metabolism.30 Thus coordinated glucose and glutamine metabolism appear to be important to cancer cell proliferation, survivability, and response to environmental stress.31
In many tumor cell lines, glutamine is converted to glutamate by glutaminase (GLS). Glutamate is then used to produce α-ketoglutarate (αKG) in the tricarboxylic acid (TCA) cycle.32 In proliferating cells, the TCA cycle is used for both energy production and the generation of biosynthetic intermediates.33 For example, acetyl-CoA is mainly produced from glucose, which is then combined with oxaloacetate (OAA) to form citrate in the TCA cycle. The subsequent oxidation of citrate is then used to generate the necessary reducing equivalents to produce ATP via oxidative phosphorylation, which also regenerates OAA. TCA cycle intermediates are also shuttled into a variety of biosynthetic pathways, which results in OAA being a limiting metabolite for proliferating cells.34 Correspondingly, the inherent interconnectivity of metabolic processes further illustrates the overall importance of metabolism to cancer.35
We previously demonstrated that MUC1 is a master regulator of metabolism. MUC1 physically occupies the promoter regions of multiple glycolytic genes and regulates their expression, and it enhances glucose uptake and contributes to tumor cell proliferation.7 MUC1 promotes these cellular functions by interacting with the hypoxia-inducible factor-1 alpha (HIF1α). HIF1α expression is correlated with an increase in glycolysis and a decrease in mitochondrial oxidative phosphorylation.36 We also observed that the proliferation of cancer cells overexpressing MUC1 was dependent on glucose. Our prior study was conducted using an abundance of glucose where aerobic glycolysis is highly active. Because glucose limitation is closer to the natural environment of a tumor,36 and given the interrelationship of glucose and glutamine metabolism,31 investigating the impact of glucose limitation and MUC1 overexpression on glutamine metabolism is expected to provide additional insights into the cellular biology of pancreatic cancer.
NMR-based metabolomics is routinely used to identify metabolic pathways perturbed as a result of a disease, genetic modification, or environmental stress.37 NMR metabolomics has also been successfully used to investigate various types of cancer, including pancreatic cancer.38 Specifically, 1D 1H NMR experiments in combination with multivariate statistical analysis provide a global metabolic profile for identifying metabolites and pathways responsible for phenotypical variations.39 Isotopically labeled metabolites (e.g., 13C-labeled glucose and amino acids) and 2D NMR experiments (e.g., 2D 1H–13C heteronuclear single quantum coherence (HSQC)) are also commonly used to improve the accuracy in metabolite identification and explore specific metabolic pathways in more depth.40 Herein we used NMR metabolomics and cell-based assays to investigate the metabolic impact of glucose limitation on glutamine metabolism and cell proliferation in control (S2–013.Neo) and MUC1-overexpressing pancreatic cancer cells (S2–013.MUC1). S2–013.MUC1 and S2–013.Neo cells have been extensively used to characterize the impact of MUC1 overexpression in pancreatic cancer cells.7,41−43
Materials and Methods
Cell Cultures for NMR Experiments
S2–013.Neo and S2–013.MUC1 cells were cultured overnight in complete DMEM. For 1D 1H NMR experiments, the cell culture media was either maintained in complete DMEM or changed to DMEM modified to contain only 1 mM glucose. For 2D 1H–13C HSQC NMR experiments, the glucose or glutamine in the DMEM was changed to either U–13C6 glucose (Cambridge Isotope Laboratories, Tewksbury, MA) or U–13C5 glutamine (Cambridge Isotope Laboratories, Tewksbury, MA), respectively. All cell culture media were supplemented with 10% FBS (Atlanta Biologicals, GA). MUC1 over-expressing S2–013 cells were prepared as previously described by Singh et al.5 and Behrens et al.44
Metabolite Extraction and NMR Sample Preparation
To lyse the cells, 1 mL of 80% methanol was added to each cell culture plate, which was then placed in a −80 °C freezer for a minimum of 15 min. The cells and methanol were then removed from the cell culture plate using a cell scraper and collected in an Eppendorf tube. The Eppendorf tubes were centrifuged at 13 000 rpm for 5 min at 4 °C. The supernatant was transferred to a fresh conical tube and 250 μL of distilled water was added to the remaining cell debris. The cell debris and the water were mixed by pipetting, followed by centrifugation at 13 000 rpm for 5 min at 4 °C. The methanol and the water extracts were combined, and the methanol was evaporated using a Speed Vac Plus vacuum centrifuge. The samples were then frozen using liquid nitrogen and the water was removed with a Labconco lyophilizer. The dried samples were then reconstituted using 600 μM of 50 mM phosphate buffer at pH 7.2 (uncorrected) with either 50 μM 3-(tetramethysilane) propionic acid-2,2,3,3-d4 (TMSP) or 500 μM TMSP for the 1D 1H NMR or 2D 1H–13C HSQC NMR experiments, respectively. The samples were centrifuged at 13 000 rpm for 5 min at room temperature to remove any precipitant. The supernatant was then transferred to 5 mm NMR tubes for analysis.
NMR Experiments and Analysis
The NMR experiments were conducted at 298 K using a Bruker Avance III HD 700 MHz spectrometer equipped with a 5 mm inverse quadruple-resonance (1H, 13C, 15N, 31P) cryoprobe with cooled 1H and 13C channels and a z-axis gradient. A SampleJet automated sample changer with Bruker ICON-NMR software was used to automate the NMR data collection. The 1D 1H NMR spectra was collected with 32 K data points, a spectrum width of 5483 Hz, 128 scans, and 16 dummy scans using an excitation sculpting pulse sequence to remove the solvent peak.45 The 2D 1H–13C HSQC NMR spectra were collected at 298 K with 128 scans, 32 dummy scans, and a 1.0 s relaxation delay. The spectrum was collected with 2 K data points and a spectrum width of 4734 Hz in the direct dimension and 64 data points and a spectrum width of 18 864 Hz in the indirect dimension.
The 1D 1H NMR spectra were processed and analyzed using our MVAPACK metabolomics toolkit (http://bionmr.unl.edu/mvapack.php).46 The 1D 1H NMR spectra were Fourier-transformed, autophased, and referenced to TMSP. Residual solvent peaks were removed from the spectrum. The 1D 1H NMR spectra were binned using an intelligent adaptive binning algorithm47 for principal component analysis (PCA) or aligned using the icoshift algorithm48 when the full-resolution spectra were modeled using orthogonal projections to latent structure discriminant analysis (OPLS-DA). The data were normalized using standard normal variate normalization and Pareto-scaled prior to multivariate statistical analysis. Fractions of explained variation (RX2 and RY2) were computed during OPLS-DA model training. OPLS-DA models were internally cross-validated using seven-fold Monte Carlo cross-validation49,50 to compute Q2 values, which were compared with a distribution of null model Q2 values in 1000 rounds of response permutation testing.51 Model results were further validated using CV-ANOVA significance testing.52 Back-scaled loadings plots were generated from OPLS-DA models. Chenomx NMR suite 7.0 (Chenomx, Edmonton, Alberta, Canada) was used for metabolite assignment of 1D 1H NMR spectra.
NMRPipe was used to process the 2D 1H–13C HSQC spectra.53 Peak-picking and peak-matching were accomplished using NMRViewJ Version 8.0.54 Peak intensities were normalized for each 2D 1H–13C HSQC NMR spectrum to the mean peak intensity. Chemical shift references from the Human Metabolomics Database (HMDB) (http://www.hmdb.ca/),55 Platform for RIKEN Metabolomics (PRIMe) (http://prime.psc.riken.jp/),56 and the Madison Metabolomics Consortium Database (MMCD) (http://mmcd.nmrfam.wisc.edu/)57 were used to assign metabolites from the 2D 1H–13C HSQC spectra. Chemical shift errors of 0.08 and 0.25 ppm for the 1H and 13C chemical shifts, respectively, were used to match the experimental chemical shifts with the databases. In addition to chemical shifts, peak splitting patterns and peak shapes were also used to verify metabolite assignments.
Glutamine Uptake Assay
5 × 10⁴ of S2–013.Neo or S2−013.MUC1 cells was seeded per well in a 24-well plate. After 24 h the media for the cells was changed to either 1 mM or 25 mM glucose containing media for 12 h. Then, the cells were starved for glutamine for 2 h, followed by incubation with 1 μCi tritiated glutamine (l-[3,4-3H(N)]) for 3 min. Finally, cells were washed with PBS and lysed in 1% SDS. The lysates were used for [3H] counting by utilizing a scintillation counter. The details of glutamine uptake assay have been reported by Shukla et al.58
Flow Cytometry-based Cell Cycle Analysis
S2–013.Neo and S2–013.MUC1 cells were seeded in a 60 mm cell culture plate at a density of 6 × 10⁵ cells per dish. The cells were incubated overnight in standard DMEM. The media was then replaced with either limited glucose (1 mM glucose) DMEM or high (steady-state) glucose (25 mM glucose)-containing DMEM. The cells were then incubated for an additional 48 h. The cells were harvested by trypsinization and collected using 1% fetal bovine albumin containing 1× PBS in a 15 mL Eppendorf tube. The cells were centrifuged at 1500 rpm for 2 min and the supernatant was removed and the cells washed with 1× PBS. After centrifugation and removing the PBS buffer, 3 mL of ice-cold absolute ethanol was added to each tube while vortexing. The samples were stored overnight at −20 °C. Cells were washed twice with 1× PBS, followed by centrifugation to remove the supernatant. The cell pellets were stained with propidium iodide staining solution (100 μg/mL RNase A and 40 μg/mL propidium iodide in PBS) and incubated for a minimum of 30 min on ice before flow cytometric analysis. Flow cytometric measurements were performed using BD accuri C6 flow cytometry. The data were analyzed using ModFit LT.
Real-Time PCR Analysis
cDNA was prepared by utilizing Super-Script III First-strand Synthesis Kit (Invitrogen). Reactions containing 3.0 μL of cDNA, 2.0 μL of primer mix, and 5.0 μL of Verso 1-Step Sybr green master mix (ThermoFisher Scientific) were prepared in and subjected to quantitative real-time PCR analysis by using an ABI 7500 thermocycler. Each reaction was repeated in triplicate, and the experiments were repeated at least twice to confirm reproducibility. Values were obtained for the threshold cycle (Ct) for each gene and data were analyzed using the standard curve method. Values were normalized to the expression of β-actin, and average expression ± SEM were reported. Primer sequences have been described previously.7
Western Blotting
Western blotting was performed as previously described.59 S2–013.Neo and S2–013.MUC1 proteomes were extracted using a radio immuno-precipitation assay buffer (10 mM Tris-Cl (pH 8.0), 1 mM EDTA, 1% Triton X-100, 0.1% sodium deoxycholate, 0.1% SDS, 140 mM NaCl, and 1 mM phenylmethanesulfonyl fluoride) containing a protease inhibitor mixture (Sigma-Aldrich, St. Louis, MO). A Bradford assay was used to estimate protein concentrations. After SDS-PAGE separation, the protein was transferred to a polyvinylidene difluoride (PVDF) membrane and probed with primary antibodies against MUC1 (Abcam) and β-tubulin (Developmental Studies Hybridoma Bank, Iowa City, IA). Antihamster and antimouse secondary antibodies (Jackson ImmunoResearch Laboratories, West Grove, PA) were used for MUC1 and β-tubulin, respectively.
Results
MUC1 Alters Global Amino Acid Metabolism
S2–013.Neo and S2–013.MUC1 cells were used to study the global alteration in amino acid metabolism caused by MUC1 overexpression. MUC1 overexpression was confirmed by both mRNA levels and Western blot (Figure 1a and Figure S1). 1D 1H NMR spectra were then collected for six biological replicates of S2–013.Neo and S2–013.MUC1 cell lysates and analyzed using multivariate statistics. The resulting 2D PCA scores plot generated from the 1D 1H NMR spectra indicates that S2–013.Neo and S2–013.MUC1 have distinct metabolic profiles (Figure 1b). To identify the metabolites primarily contributing to the class separation in the PCA scores plot, an OPLS-DA model was generated from the 1D 1H NMR data (Figure S2a). The quality of the OPLS-DA model was evaluated on the basis of cross-validation by a Monte Carlo leave-n-out procedure49,50 and CV-ANOVA.52 The resulting R2 (degree of fit), Q2 (predictive ability) and p-value of (0.99, 0.87, and 3.92) × 10–4, respectively, indicate a valid OPLS-DA model. A back-scaled loadings plot (Figure 1c) generated from the OPLS-DA model was used to identify the 1D 1H NMR peaks (metabolites) that contribute to the class separation in the scores plot. The metabolome from the S2–013.MUC1 cells was observed to have elevated levels of branched chain amino acids (leucine, isoleucine, and valine), glutamine, alanine, serine, threonine, and glycine relative to S2–013.Neo cells. Conversely, aspartate and glutamate cellular levels were observed to decrease in S2–013.MUC1 cells relative to S2–013.Neo cells (Figure 1c). It is important to note that other metabolite changes were observed between S2–013.MUC1 and S2–013.Neo cells, but the analysis was focused on changes in amino acids.
Figure 1.

MUC1 alters global amino acid metabolism. (a) Confirmation of MUC1 overexpression in S2−013.Neo and S2−013.MUC1 cells using Western blot (upper panel) and mRNA expression (lower panel). Please see Figure S1 for the full, original Western blot images. (b) PCA scores plot for lysates extracted from S2–013.Neo (red) and S2–013.MUC1 (green) cells. The ellipses correspond to 95% confidence intervals for a normal distribution. (c) Back-scaled loadings plot produced from the OPLS-DA scores generated from 1D 1H NMR spectra of S2–013.Neo and S2–013.MUC1 cells. Please see Figure S2 for the corresponding OPLS-DA scores plots. A valid OPLS-DA model is indicted by R2 of 0.99, Q2 of 0.87, and CV-ANOVA p-value of 3.92 × 10⁻⁴. The metabolites are labeled accordingly (1: Branched chain amino acids, 2: Lactate, 3: Threonine, 4: Unknown, 5: Alanine, 6: N-Acetylaspartate/N-Acetyleglutamate, 7: Glutamate, 8: Glutamine, 9: Glutathione, 10: Aspartate, 11: Creatine/CreatineP, 12: Glycine, 13: Serine).
Glucose Limitation Reprograms Global Amino Acid Metabolism in MUC1-Overexpressed Cells
We previously demonstrated that MUC1 overexpression enhances aerobic glycolysis in pancreatic cancer cells, and proliferation is significantly dependent on the availability of glucose.7 Thus a resulting high level of glycolysis could easily lead to glucose limitation in a tumor’s microenvironment.60 Accordingly, cancer cells face metabolic challenges, mainly hypoxia and nutrient deprivation that induces cellular stress and reduces survivability.22,61 In an effort to understand the metabolic response due to nutrient limitation, we characterized the metabolic impact of glucose limitation and MUC1 overexpression on pancreatic cancer cells. S2–013.Neo and S2–013.MUC1 cell proliferation was monitored for 3 days under steady state (25 mM glucose) and glucose limitation (1 mM glucose) conditions. The immunoblots of MUC1 levels in S2–013.Neo and S2–013.MUC1 at 12 h culture under glucose limitation are shown in Figure S1c. As shown in Figure 2a, S2–013.MUC1 cells are more sensitive to glucose limitation. While S2–013.MUC1 cells have a higher proliferation rate than S2–013.Neo cells, a larger decrease in the number of cells was observed under glucose limitation conditions for S2–013.MUC1 cells, especially at the 3 day time point. 1D 1H NMR spectra were collected for S2–013.Neo and S2–013.MUC1 cell lysates that were cultured for 12 h under either steady-state or glucose limitation. The resulting 3D PCA scores plot generated from the 1D 1H NMR spectra is shown in Figure 2b. Four distinct clusters are clearly visible in the scores plot, which indicates that the metabolomes of the S2–013.Neo and S2–013.MUC1 cells grown under the two media conditions are completely different. A tree diagram generated from the PCA scores using our PCA/PLS-DA utilities (http://bionmr.unl.edu/pca-utils.php) that quantifies the magnitude of the group separations (p value) based on a matrix of Mahalanobis distances is shown in Figure 2c.62 The tree diagram indicates that the S2–013.MUC1 cells cultured under glucose limitation is distinctly separated from the three other groups. Conversely, the two S2–013.Neo cell cultures are nearest neighbors in the tree. This additionally demonstrates the dramatic impact of glucose limitation on S2–013.MUC1 cells.
Figure 2.

Glucose limitation reprograms amino acid metabolism in MUC1 cells. (a) Bar graph representing normalized cell count for 3 days (upper panel). S2–013.Neo and S2–013.MUC1 cells cultured in a medium supplemented with 25 or 1 mM glucose. The cells under each condition were counted daily for 3 days. The cell count was normalized by the first day count for S2–013.Neo cells cultured at 25 mM glucose. The lower panel line graph indicates the difference in the relative cell count between 1 and 25 mM glucose supplemented media for each cell line. The data were obtained by subtracting the relative cell count values of 25 mM from 1 mM glucose cultured cells for each cell line. The solid graph (−) and broken (--) graphs represent the relative difference in S2–013.Neo and S2–013.MUC1 cells, respectively. (b) 3D PCA scores plot generated form 1D 1H NMR spectra of cell lysate collected after S2–013.Neo and S2–013.MUC1 cells were cultured in media supplemented with 25 or 1 mM of glucose. The clusters are colored accordingly: S2−013.Neo cultured in 25 mM glucose (red) S2−013.Neo cultured in 1 mM glucose (blue), S2−013.MUC1 cultured in 25 mM glucose (green), and S2−013.MUC1 cultured in 1 mM glucose (brown). The ellipses correspond to 95% confidence intervals for a normal distribution. Each cluster contains six biological replicates. (c) Tree diagram generated from the PCA scores of panel b, each node is labeled with a p-value calculated from Mahalanobis distances and indicate the statistical significance of cluster separations. The coloring scheme is the same as panel b. (d) Back-scaled loadings plot generated from the OPLS-DA scores plot of S2–013.Neo and S2–013.MUC1 cells cultured in media supplemented with 1 mM glucose. A valid OPLS-DA model is indicted by R2 of 0.99, Q2 of 0.84, and CV-ANOVA p-value of 4.48 × 10⁻⁴. See also Figure S2. The metabolites are labeled accordingly (1: Branched chain amino acids, 2: Lactate, 3: Threonine, 4: Unknown, 5: Alanine, 6: N-Acetylaspartate/N-Acetyleglutamate, 7: Glutamate, 8: Glutamine, 9: Glutathione, 10: Aspartate, 11: Creatine/CreatineP, 12: Glycine, 13: Serine). (e) Metabolite concentrations switch in S2–013.MUC1 cells compared to the S2−013.Neo cells cultured at 25 mM glucose (upper panel) or 1 mM glucose (lower panel). The green and red colors indicate a relative increase or decrease in concentrations, respectively.
To further elucidate the impact of glucose limitation on S2–013.MUC1 cells, an OPLS-DA model was generated from the 1D 1H NMR data (Figure S2b). The resulting R2, Q2, and CV-ANOVA p-value of 0.99, 0.84, and 4.48 × 10⁻⁵, respectively, indicates a valid OPLS-DA model. The back-scaled loading plot generated from the OPLS-DA model is shown in Figure 2d. As expected and consistent with the results described above, significant changes were observed in the relative concentrations of multiple amino acids: branched chain amino acids, glutamine, glutamate, aspartate, and threonine. Interestingly, the relative concentration changes in glutamine, glutamate, and aspartate when going from steady-state to glucose limitation conditions suggest a metabolic switch (Figure 2e). The relative glutamine concentrations are higher in S2–013.MUC1 cells under steady-state conditions, while relative glutamate and aspartate concentrations are lower. The situation reverses under glucose limitation; glutamine concentration decreases and aspartate and glutamate concentrations increase. This reversal in glutamine and other related metabolite concentrations suggests that MUC1 overexpression affects glutamine uptake and glutamine metabolism when glucose is limited.
Glutamine, But Not Glucose, Is the Major Anaplerotic Metabolite in S2–013 Cells
OAA, an intermediate of TCA cycle and a limiting metabolite in proliferating cells,34 is primarily replenished by either glucose-driven pyruvate generation through pyruvate carboxylase activity63 (Figure 3a) or from glutamine metabolism24 (Figure 3b). Thus 13C3–OAA can be produced either from U–13C6 glucose (through pyruvate carboxylase activity) or from U–13C5 glutamine (through the TCA cycle). This provides a simple approach to identify the source of OAA under steady-state or glucose limitation. S2–013.Neo or S2–013.MUC1 cells were cultured in media supplemented with 25 mM U–13C6 glucose and 2 mM glutamine or 2 mM U–13C5 glutamine and 25 mM glucose for 12 h. The cell lysates were then analyzed using a 2D 1H–13C HSQC NMR experiment. 13C3–OAA was only observed when U–13C5 glutamine was present in the culture media (Figure 3 and Figure S3). This result suggests that the anaplerosis reaction of the TCA cycle is mainly supplied by glutamine carbons.
Figure 3.

13C3 oxaloacetate originates from 13C-labeled glutamine. (a) Synthetic scheme illustrating the 13C3-labeling of OAA from U–13C6 glucose. Glucose-derived pyruvate is made by the glycolytic pathway and is converted to OAA by pyruvate carboxylase (PC). (b) Synthetic scheme illustrating the 13C3-labeling of OAA from U–13C5 glutamine. The CH pairs detected by the 2D 1H–13C HSQC NMR experiment are colored red. (c) Expanded view of 2D 1H–13C HSQC spectrum of S2–013.MUC1 cells cultured for 12 h in medium containing 2 mM U–13C5 glutamine and 25 mM 12C6 glucose. The OAA 1H–13C3 NMR peaks are circled. (d) Same view as panel c of 2D 1H–13C HSQC spectrum of S2–013.MUC1 cells cultured for 12 h in medium containing 25 mM U–13C6 glucose and 2 mM 12C5 glutamine. The predicted location of the OAA C3 peak is indicated in the spectrum. Please see Figure S5 for representative 2D 1H–13C HSQC spectra obtained from other cell culture conditions.
MUC1 Alters Glutamine Uptake and Metabolism during Glucose Limitation
We analyzed the effect of glucose limitation on glutamine uptake in both S2–013.Neo and S2−013.MUC1 cells using a 3H glutamine uptake assay.58 As shown in Figure 4a, glucose limitation increases glutamine uptake in S2–013.MUC1 cells but not in S2–013.Neo cells.
Figure 4.

MUC1 alters glutamine uptake and glutamine metabolism. (a) Plot of relative uptake of 3H glutamine by S2–013.Neo or S2–013.MUC1 cells cultured in media supplemented with 25 or 1 mM of glucose. 3H glutamine uptake was normalized to S2−013.Neo cells cultured in media supplemented with 25 mM glucose. (b) Relative concentrations of TCA cycle intermediates derived from 2D 1H–13C HSQC experiments of S2–013.Neo or S2–013.MUC1 cells cultured in media supplemented with U–13C5 glutamine and either 25 or 1 mM of glucose. (c) Relative concentrations of aspartate-derived 2D 1H–13C HSQC experiments of S2–013.Neo or S2–013.MUC1 cells cultured in media supplemented with U–13C5 glutamine and either 25 or 1 mM of glucose. (d) Pyrimidine nucleotide carbons (blue) derived from aspartate during de novo pyrimidine synthesis. Please see Figure S4 for a scheme illustrating the incorporation of aspartate-derived carbon atoms into a pyrimidine nucleotide. (e) Relative concentrations of pyrimidine nucleotides derived from 2D 1H–13C HSQC experiments of S2–013.Neo or S2–013.MUC1 cells cultured in media supplemented with U–13C5 glutamine and either 25 or 1 mM of glucose. The acronyms CXP, UXPG, and UXP correspond to cytidine X phosphate, uridine X phosphate glucose, and uridine X phosphate, respectively. The X indicates that pyrimidine nucleotides could be mono-, di-, or tri-phosphate. The relative concentration of each metabolite was normalized to S2–013.Neo cells cultured with 25 mM glucose.
To investigate the role of MUC1 overexpression in replenishing the TCA cycle, we compared relative concentration changes of OAA, citrate, malate, and succinyl-CoA derived from U–13C5 glutamine between S2–013.MUC1 and S2–013.Neo cells cultured under steady-state or glucose limitation conditions. 2D 1H–13C HSQC NMR spectra indicated that no significant MUC1-dependent alteration in 13C-labeled metabolite concentrations was observed under steady-state glucose conditions (Figure 4b). Relative to steady-state conditions, glucose limitation decreased the incorporation of glutamine 13C-carbons into the TCA cycle intermediates, except for succinyl-CoA. However, comparison of the S2–013.MUC1 and S2–013.Neo cells under glucose limitation indicates that incorporation of glutamine 13C-carbons into the TCA cycle intermediates (except for OAA) increases in S2–013.MUC1 cells. Interestingly, the reduction in OAA is accompanied by an accumulation of aspartate (Figure 4c). Aspartate, which is directly derived from OAA, is an essential precursor for de novo pyrimidine nucleotide biosynthesis. Specifically, the three carbons of the pyrimidine nucleobase originate from aspartate (Figure 4d and Figure S4). Thus the observed accumulation in aspartate also resulted in a sharp decrease in U–13C5 glutamine-derived pyrimidine nucleotides (Figure 4e and Figure S5). Taken together, these results suggest that glucose limitation has a pronounced impact on nucleic acid biosynthesis in MUC1-overexpressing cells.
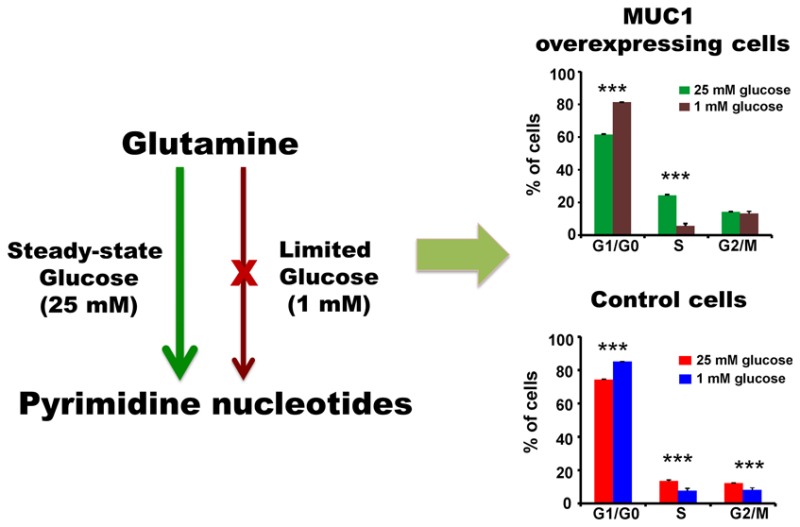
Glucose Limitation Induces G1/G0-Phase Arrest and Decreases the S-Phase Fraction of MUC1-Overexpressed Cells
S2–013.Neo and S2–013.MUC1 cell cycle progression was analyzed under steady-state and glucose limitation conditions. S2–013.Neo and S2–013.MUC1 cells were first cultured in media containing 25 mM glucose for 48 h. The DNA was stained with propidium iodide; then, the cells were analyzed using flow cytometry. S2–013.MUC1 cells were observed to have a higher S-phase fraction (24.3 ± 0.6%) than the S2–013.Neo cells (13.5 ± 0.5%, p = 0.00002). Conversely, the S2–013.Neo cells were observed to have a higher G1/G0-phase fraction (73.5 ± 0.4%) than the S2–013.MUC1 cells (61.5 ± 0.5%, p = 0.0004 (Figure 5a,c,d,f). The S2–013.MUC1 and S2–013.Neo cells were then cultured in media containing 1 mM glucose for 48 h. Glucose limitation decreased the S-phase fraction for both S2–013.MUC1 and S2–013.Neo cells; however, the reduction in the S-phase fraction for S2–013.MUC1 cells (24.3 ± 0.6 to 6 ± 1%, p = 0.00002) was 4.3 times higher than the reduction in the S-phase fraction for S2–013.Neo cells (13.5 ± 0.6 to 8 ± 1%, p = 0.003 (Figure 5b,e,d,f)). The decrease in the S-phase fraction is compensated by a corresponding increase in the G1/G0 phase fraction in both S2–013.MUC1 and S2–013.Neo cells. As expected, the increase in the G1/G0 phase fraction for S2–013.MUC1 cells (62 ± 2 to 81.3 ± 0.5%, p = 0.00007) is higher relative to the S2–013.Neo cells (74.3 ± 0.4 to 85.1 ± 0.1%, p = 0.000001). The cell-cycle analysis shows that glucose limitation causes an increased cell cycle arrest at the G1/G0 phase in MUC1-overexpressing cells compared with controls (Figure 5d,f).
Figure 5.

Glucose limitation induces G1/G0-phase arrest and decreases the S-phase fraction of MUC1-overexpressed cells. Representative flow cytometry pattern obtained by cell-cycle analysis of S2–013.MUC1 cells (a–c) and S2–013.Neo (d–f) cultured at 25 mM glucose containing media (a,d) or 1 mM glucose supplemented media (b,e) for 48 h. The histogram from triplicate experiments shows the percentage of cells in each phase (c: S2–013.MUC1, f: S2–013.Neo). FL2-A corresponds to the area of the DNA florescence signal from the FL2 channel.
Discussion
In general, cancer cell proliferation strongly depends on the availability of glucose,22 but a number of cancer phenotypes have been identified to be also dependent on glutamine.28 This dependency on glutamine, in addition to glucose, cannot be simply explained by a demand for nitrogen in nucleotide biosynthesis or as a source for maintaining nonessential amino acids.24 For example, in KRAS-dependent pancreatic cancer cells, glutamine gets metabolized in a noncanonical pathway to maintain redox homeostasis.29 Nevertheless, this apparent relationship between glucose and glutamine metabolism in cancer cells is not well understood. To address this issue, we initiated an NMR-based metabolomics study to characterize the impact of glucose limitation on glutamine metabolism in pancreatic cancer cells overexpressing MUC1. We previously identified MUC1 as a contributor to cell survivability and a master regulator of metabolism, facilitating glycolysis and glucose uptake.7 Presumably, pancreatic cancer cells under metabolic stress caused by glucose limitation and an elevated aerobic glycolysis are likely to respond by redirecting resources into other metabolic processes. A resulting change in glutamine metabolism is expected because glutamine, a very abundant metabolite, is involved in various biosynthesis, energy, redox homeostasis, and signaling processes, which are all important to cancer proliferation and survivability.32
Our NMR metabolomics analysis indicated a strong correlation between glucose limitation and changes in the cellular concentrations of glutamine, glutamate, and aspartate. Specifically, the cellular concentrations of glutamine decreased in MUC1 overexpressing cells when cultured under glucose limitation. Conversely, cellular concentrations of glutamate and aspartate increased (Figure 2d). Furthermore, glutamine uptake doubled in MUC1-overexpressing cells under glucose limitation conditions compared with steady-state glucose conditions or control cells (Figure 4a). Additionally, growth curves indicate that pancreatic cancer cells overexpressing MUC1 are more sensitive to glucose limitation relative to control cells (Figure 2a). Taken together, these results demonstrate that glucose limitation alters glutamine metabolism and detrimentally affects cell survivability in MUC1-overexpressing pancreatic cancer cells.
Next, the incorporation of glutamine or glucose carbons into other metabolites was monitored by NMR using media supplemented with either U–13C5 glutamine or U–13C6 glucose. The impact of MUC1 overexpression on carbon incorporation was also followed. Importantly, OAA, a TCA cycle metabolite and a limiting metabolite for proliferating cells,34 was only derived from glutamine. This observation was independent of the MUC1 expression levels (Figure 3 and Figure S3). Furthermore, the relative incorporation of glutamine carbons into OAA was lower for MUC1-overexpressing cells under glucose limitation (Figure 4b). In pancreatic cancer, aspartate is directly derived from OAA by the action of aspartate aminotransferase.29 Of particular note, an increased level of glutamine carbon incorporation into aspartate was observed upon glucose limitation in MUC1-overexpressing cells. Because cancer cells use aspartate carbons to make the base rings of pyrimidine during de novo pyrimidine biosynthesis,64 our results indicate that the alteration in glutamine metabolism due to glucose limitation negatively impacts pyrimidine synthesis—an accumulation in aspartate and a correlated dramatic decrease in nucleotides was observed. Cancer cells are very dependent on the de novo synthesis of nucleotides to support DNA replication and RNA synthesis to maintain a high rate of cell proliferation,65 Thus the observed decrease in cell survivability of MUC1-overexpressing cells under glucose limitation may be attributed to a disruption in DNA replication.
The process of DNA replication for cell division is a coordinated event composed of different phases of cell cycle.66 Our analysis of cell-cycle progression indicates that under steady-state glucose conditions MUC1-overexpressing cells have higher S-phase fractions relative to controls. The S-phase is where cells synthesize DNA and prepare for cell division.66 A higher S-phase fraction has been associated with an increase in primary tumor size, extensive nodal involvement and an advanced stage of breast cancer,67,68 and in vitro drug resistance to 15 different anticancer agents in leukemia.69 Of particular note, glucose limitation decreased the S-phase fraction of MUC1-overexpressing cells and induced G1 phase arrest. The G1 phase is a checkpoint before cells commit to mitosis, where there are two restriction points that cancer cells are typically able to pass through because of genetic mutations. Interestingly, one of these G1 check points is dependent on nutritional sufficiency.70 Thus the observed G1 phase arrest is consistent with a disruption in DNA replication due to glucose limitation and the observed decrease in cell survivability. Furthermore, the observed G1 phase arrest completely agrees with the metabolomics results; MUC1-overexpressing cells under glucose limitation have an altered glutamine metabolism that results in a disruption in de novo pyrimidine synthesis that negatively impacts DNA replication. Moreover, our results provide a clear explanation for the observed glucose dependency of MUC1-overexpressing cells.
Conclusions
MUC1 overexpression is associated with a majority of pancreatic adenocarcinomas and is correlated with poor prognosis, rapid metastasis, and chemotherapeutic drug resistance. Thus understanding the detailed biological impact of MUC1 activity is invaluable to our ability to discover new drugs and develop diagnostic tools for cancer. MUC1 is a master regulator of metabolism, in which we observed an enhancement in glycolytic activity and amino acid metabolism to facilitate cell survival and proliferation. As a consequence, pancreatic cancer cells overexpressing MUC1 were observed to have high rates of glucose uptake and to rely on aerobic glycolysis for survival, but the tumor microenvironment is typically glucose-limited, requiring the cancer cells to adapt. Even though glutamine is nonessential, our findings demonstrate that glutamine is the major anaplerotic source of oxaloacetate, a limiting metabolite for proliferating cells that is shuttled into a variety of biosynthetic pathways including amino acid and nucleotide metabolism. Furthermore, we observed that glucose limitation in MUC1-overexpressing cells leads to an increase in the uptake of glutamine and caused a metabolic switch in the relative cellular concentrations of glutamine, glutamate, aspartate, and various nucleotides. Thus our characterization of the metabolic response of MUC1-overexpressing cancer cells to glucose limitation revealed a coupling between glucose and glutamine metabolism, and, more importantly, our findings provide a molecular mechanism to explain the observed relative decrease in the proliferation of MUC1-overexpressing cells. Glucose limitation in MUC1-overexpressing cells disrupts pyrimidine nucleotide biosynthesis, which impedes DNA synthesis, causing the observed G1 phase arrest and the decrease in cell survivability. Our results also demonstrate the inherent value of a metabolomics approach for studying the cellular biology of cancer cells.
Acknowledgments
This work was supported in part by funding from the National Institutes of Health grant (R01 CA163649, NCI) to P.K.S. and R.P.; the Redox Biology Center (P30 GM103335, NIGMS) to R.P.; the Nebraska Center for Integrated Biomolecular Communication (P20 GM113126, NIGMS) to R.P.; American Association for Cancer Research (AACR)—Pancreatic Cancer Action Network (PanCAN) Career Development Award (30-20-25-SING) to P.K.S.; the Specialized Programs for Research Excellence (SPORE, 2P50 CA127297, NCI) to P.K.S.; Pancreatic Tumor Microenvironment Research Network (U54, CA163120, NCI) to P.K.S.; and Fred & Pamela Buffett Cancer Center Support Grant (P30CA036727) to P.K.S. and R.P. The research was performed in facilities renovated with support from the National Institutes of Health (RR015468-01). The funders had no role in study design, data collection and analysis, decision to publish, or preparation of the manuscript.
Supporting Information Available
The Supporting Information is available free of charge on the ACS Publications website at DOI: 10.1021/acs.jproteome.7b00246.
Figure S1: Examination of MUC1 overexpression in S2−013.Neo and S2−013.MUC1 cells using Western blot. Figure S2. OPLS-DA scores plot generated from 1D 1H NMR spectra of S2–013.Neo and S2–013.MUC1 cell extracts. Figure S3: Expanded view of 2D 1H–13C HSQC spectra of S2−013.Neo and S2–013.MUC1 cells that demonstrate C3 oxaloacetate carbon originates from glutamine. Figure S4. Metabolic scheme illustrating the incorporation of aspartate-derived carbon atoms into a pyrimidine nucleotide. Figure S5. Bar graph depicting the relative changes in the incorporation of glutamine-derived carbons into pyrimidine nucleotides due to glucose limitation. (PDF)
Author Contributions
▽ T.G. and V.P. contributed equally. T.G., V.P., P.K.S., and R.P. designed the experiments, analyzed the data, and wrote the manuscript; T.G., V.P., S.K.S., S.T., N.V.C., J.A., S.E.M., and V.G. performed the experiments.
The authors declare no competing financial interest.
Supplementary Material
References
- Cairns R. A.; Harris I. S.; Mak T. W. Regulation of cancer cell metabolism. Nat. Rev. Cancer 2011, 11 (2), 85–95. 10.1038/nrc2981. [DOI] [PubMed] [Google Scholar]
- Koppenol W. H.; Bounds P. L.; Dang C. V. Otto Warburg’s contributions to current concepts of cancer metabolism. Nat. Rev. Cancer 2011, 11 (5), 325–37. 10.1038/nrc3038. [DOI] [PubMed] [Google Scholar]
- Boroughs L. K.; DeBerardinis R. J. Metabolic pathways promoting cancer cell survival and growth. Nat. Cell Biol. 2015, 17 (4), 351–9. 10.1038/ncb3124. [DOI] [PMC free article] [PubMed] [Google Scholar]
- Singh P. K.; Hollingsworth M. A. Cell surface-associated mucins in signal transduction. Trends Cell Biol. 2006, 16 (9), 467–76. 10.1016/j.tcb.2006.07.006. [DOI] [PubMed] [Google Scholar]
- Singh P. K.; Behrens M. E.; Eggers J. P.; Cerny R. L.; Bailey J. M.; Shanmugam K.; Gendler S. J.; Bennett E. P.; Hollingsworth M. A. Phosphorylation of MUC1 by Met modulates interaction with p53 and MMP1 expression. J. Biol. Chem. 2008, 283 (40), 26985–26995. 10.1074/jbc.M805036200. [DOI] [PMC free article] [PubMed] [Google Scholar]
- Singh P. K.; Wen Y.; Swanson B. J.; Shanmugam K.; Kazlauskas A.; Cerny R. L.; Gendler S. J.; Hollingsworth M. A. Platelet-derived growth factor receptor beta-mediated phosphorylation of MUC1 enhances invasiveness in pancreatic adenocarcinoma cells. Cancer Res. 2007, 67 (11), 5201–10. 10.1158/0008-5472.CAN-06-4647. [DOI] [PubMed] [Google Scholar]
- Chaika N. V.; Gebregiworgis T.; Lewallen M. E.; Purohit V.; Radhakrishnan P.; Liu X.; Zhang B.; Mehla K.; Brown R. B.; Caffrey T.; et al. MUC1 mucin stabilizes and activates hypoxia-inducible factor 1 alpha to regulate metabolism in pancreatic cancer. Proc. Natl. Acad. Sci. U. S. A. 2012, 109 (34), 13787–13792. 10.1073/pnas.1203339109. [DOI] [PMC free article] [PubMed] [Google Scholar]
- Mehla K.; Singh P. K. MUC1: a novel metabolic master regulator. Biochim. Biophys. Acta, Rev. Cancer 2014, 1845 (2), 126–35. 10.1016/j.bbcan.2014.01.001. [DOI] [PMC free article] [PubMed] [Google Scholar]
- Schroeder J. A.; Masri A. A.; Adriance M. C.; Tessier J. C.; Kotlarczyk K. L.; Thompson M. C.; Gendler S. J. MUC1 overexpression results in mammary gland tumorigenesis and prolonged alveolar differentiation. Oncogene 2004, 23 (34), 5739–47. 10.1038/sj.onc.1207713. [DOI] [PubMed] [Google Scholar]
- Levi E.; Klimstra D. S.; Andea A.; Basturk O.; Adsay N. V. MUC1 and MUC2 in pancreatic neoplasia. J. Clin. Pathol. 2004, 57 (5), 456–62. 10.1136/jcp.2003.013292. [DOI] [PMC free article] [PubMed] [Google Scholar]
- Pillai K.; Pourgholami M. H.; Chua T. C.; Morris D. L. MUC1 has prognostic significance in malignant peritoneal mesothelioma. International journal of biological markers 2013, 28 (3), 303–312. 10.5301/jbm.5000038. [DOI] [PubMed] [Google Scholar]
- Horm T. M.; Schroeder J. A. MUC1 and metastatic cancer: expression, function and therapeutic targeting. Cell adhesion & migration 2013, 7 (2), 187–98. 10.4161/cam.23131. [DOI] [PMC free article] [PubMed] [Google Scholar]
- Nath S.; Daneshvar K.; Roy L. D.; Grover P.; Kidiyoor A.; Mosley L.; Sahraei M.; Mukherjee P. MUC1 induces drug resistance in pancreatic cancer cells via upregulation of multidrug resistance genes. Oncogenesis 2013, 2, e51. 10.1038/oncsis.2013.16. [DOI] [PMC free article] [PubMed] [Google Scholar]
- Chaika N. V.; Yu F.; Purohit V.; Mehla K.; Lazenby A. J.; DiMaio D.; Anderson J. M.; Yeh J. J.; Johnson K. R.; Hollingsworth M. A.; Singh P. K. Differential expression of metabolic genes in tumor and stromal components of primary and metastatic loci in pancreatic adenocarcinoma. PLoS One 2012, 7 (3), e32996. 10.1371/journal.pone.0032996. [DOI] [PMC free article] [PubMed] [Google Scholar]
- Cantor J. R.; Sabatini D. M. Cancer cell metabolism: one hallmark, many faces. Cancer Discovery 2012, 2 (10), 881–98. 10.1158/2159-8290.CD-12-0345. [DOI] [PMC free article] [PubMed] [Google Scholar]
- Lunt S. Y.; Vander Heiden M. G. Aerobic glycolysis: meeting the metabolic requirements of cell proliferation. Annu. Rev. Cell Dev. Biol. 2011, 27, 441–64. 10.1146/annurev-cellbio-092910-154237. [DOI] [PubMed] [Google Scholar]
- Tayek J. A. A review of cancer cachexia and abnormal glucose metabolism in humans with cancer. J. Am. Coll. Nutr. 1992, 11 (4), 445–56. 10.1080/07315724.1992.10718249. [DOI] [PubMed] [Google Scholar]
- Muniraj T.; Chari S. T. Diabetes and pancreatic cancer. Minerva Dietol. Gastroenterol. 2012, 58 (4), 331–45. [PMC free article] [PubMed] [Google Scholar]
- Sah R. P.; Nagpal S. J.; Mukhopadhyay D.; Chari S. T. New insights into pancreatic cancer-induced paraneoplastic diabetes. Nat. Rev. Gastroenterol. Hepatol. 2013, 10 (7), 423–33. 10.1038/nrgastro.2013.49. [DOI] [PMC free article] [PubMed] [Google Scholar]
- Pannala R.; Basu A.; Petersen G. M.; Chari S. T. New-onset diabetes: a potential clue to the early diagnosis of pancreatic cancer. Lancet Oncol. 2009, 10 (1), 88–95. 10.1016/S1470-2045(08)70337-1. [DOI] [PMC free article] [PubMed] [Google Scholar]
- Spitz D. R.; Sim J. E.; Ridnour L. A.; Galoforo S. S.; Lee Y. J. Glucose deprivation-induced oxidative stress in human tumor cells. A fundamental defect in metabolism?. Ann. N. Y. Acad. Sci. 2000, 899, 349–62. 10.1111/j.1749-6632.2000.tb06199.x. [DOI] [PubMed] [Google Scholar]
- Birsoy K.; Possemato R.; Lorbeer F. K.; Bayraktar E. C.; Thiru P.; Yucel B.; Wang T.; Chen W. W.; Clish C. B.; Sabatini D. M. Metabolic determinants of cancer cell sensitivity to glucose limitation and biguanides. Nature 2014, 508 (7494), 108–12. 10.1038/nature13110. [DOI] [PMC free article] [PubMed] [Google Scholar]
- Cheng G.; Zielonka J.; McAllister D.; Tsai S.; Dwinell M. B.; Kalyanaraman B. Profiling and targeting of cellular bioenergetics: inhibition of pancreatic cancer cell proliferation. Br. J. Cancer 2014, 111 (1), 85–93. 10.1038/bjc.2014.272. [DOI] [PMC free article] [PubMed] [Google Scholar]
- DeBerardinis R. J.; Mancuso A.; Daikhin E.; Nissim I.; Yudkoff M.; Wehrli S.; Thompson C. B. Beyond aerobic glycolysis: transformed cells can engage in glutamine metabolism that exceeds the requirement for protein and nucleotide synthesis. Proc. Natl. Acad. Sci. U. S. A. 2007, 104 (49), 19345–50. 10.1073/pnas.0709747104. [DOI] [PMC free article] [PubMed] [Google Scholar]
- Benjamin D. I.; Cravatt B. F.; Nomura D. K. Global profiling strategies for mapping dysregulated metabolic pathways in cancer. Cell Metab. 2012, 16 (5), 565–77. 10.1016/j.cmet.2012.09.013. [DOI] [PMC free article] [PubMed] [Google Scholar]
- Souba W. W. Glutamine and cancer. Ann. Surg. 1993, 218 (6), 715–28. 10.1097/00000658-199312000-00004. [DOI] [PMC free article] [PubMed] [Google Scholar]
- Lu W.; Pelicano H.; Huang P. Cancer metabolism: is glutamine sweeter than glucose?. Cancer Cell 2010, 18 (3), 199–200. 10.1016/j.ccr.2010.08.017. [DOI] [PMC free article] [PubMed] [Google Scholar]
- Wise D. R.; Thompson C. B. Glutamine addiction: a new therapeutic target in cancer. Trends Biochem. Sci. 2010, 35 (8), 427–33. 10.1016/j.tibs.2010.05.003. [DOI] [PMC free article] [PubMed] [Google Scholar]
- Son J.; Lyssiotis C. A.; Ying H.; Wang X.; Hua S.; Ligorio M.; Perera R. M.; Ferrone C. R.; Mullarky E.; Shyh-Chang N.; Kang Y.; Fleming J. B.; Bardeesy N.; Asara J. M.; Haigis M. C.; DePinho R. A.; Cantley L. C.; Kimmelman A. C. Glutamine supports pancreatic cancer growth through a KRAS-regulated metabolic pathway. Nature 2013, 496 (7443), 101–5. 10.1038/nature12040. [DOI] [PMC free article] [PubMed] [Google Scholar]
- Bryant K. L.; Mancias J. D.; Kimmelman A. C.; Der C. J. KRAS: feeding pancreatic cancer proliferation. Trends Biochem. Sci. 2014, 39 (2), 91–100. 10.1016/j.tibs.2013.12.004. [DOI] [PMC free article] [PubMed] [Google Scholar]
- Dang C. V. Links between metabolism and cancer. Genes Dev. 2012, 26 (9), 877–890. 10.1101/gad.189365.112. [DOI] [PMC free article] [PubMed] [Google Scholar]
- Hensley C. T.; Wasti A. T.; DeBerardinis R. J. Glutamine and cancer: cell biology, physiology, and clinical opportunities. J. Clin. Invest. 2013, 123 (9), 3678–84. 10.1172/JCI69600. [DOI] [PMC free article] [PubMed] [Google Scholar]
- Blum R.; Kloog Y. Metabolism addiction in pancreatic cancer. Cell Death Dis. 2014, 5, e1065. 10.1038/cddis.2014.38. [DOI] [PMC free article] [PubMed] [Google Scholar]
- Yang C.; Ko B.; Hensley C. T.; Jiang L.; Wasti A. T.; Kim J.; Sudderth J.; Calvaruso M. A.; Lumata L.; Mitsche M.; Rutter J.; Merritt M. E.; DeBerardinis R. J. Glutamine oxidation maintains the TCA cycle and cell survival during impaired mitochondrial pyruvate transport. Mol. Cell 2014, 56 (3), 414–24. 10.1016/j.molcel.2014.09.025. [DOI] [PMC free article] [PubMed] [Google Scholar]
- Cairns R. A.; Harris I. S.; Mak T. W. Regulation of cancer cell metabolism. Nat. Rev. Cancer 2011, 11 (2), 85–95. 10.1038/nrc2981. [DOI] [PubMed] [Google Scholar]
- Denko N. C. Hypoxia, HIF1 and glucose metabolism in the solid tumour. Nat. Rev. Cancer 2008, 8 (9), 705–13. 10.1038/nrc2468. [DOI] [PubMed] [Google Scholar]
- Nicholson J. K.; Lindon J. C.; Holmes E. ″Metabonomics″: understanding the metabolic responses of living systems to pathophysiological stimuli via multivariate statistical analysis of biological NMR spectroscopic data. Xenobiotica 1999, 29 (11), 1181–1189. 10.1080/004982599238047. [DOI] [PubMed] [Google Scholar]
- Gebregiworgis T.; Powers R. Application of NMR metabolomics to search for human disease biomarkers. Comb. Chem. High Throughput Screening 2012, 15 (8), 595–610. 10.2174/138620712802650522. [DOI] [PMC free article] [PubMed] [Google Scholar]
- Wang H.; Wang L.; Zhang H.; Deng P.; Chen J.; Zhou B.; Hu J.; Zou J.; Lu W.; Xiang P.; Wu T.; Shao X.; Li Y.; Zhou Z.; Zhao Y. L. 1H NMR-based metabolic profiling of human rectal cancer tissue. Mol. Cancer 2013, 12 (1), 121. 10.1186/1476-4598-12-121. [DOI] [PMC free article] [PubMed] [Google Scholar]
- Fan T. W.; Lane A. N.; Higashi R. M.; Farag M. A.; Gao H.; Bousamra M.; Miller D. M. Altered regulation of metabolic pathways in human lung cancer discerned by (13)C stable isotope-resolved metabolomics (SIRM). Mol. Cancer 2009, 8, 41. 10.1186/1476-4598-8-41. [DOI] [PMC free article] [PubMed] [Google Scholar]
- Kohlgraf K. G.; Gawron A. J.; Higashi M.; Meza J. L.; Burdick M. D.; Kitajima S.; Kelly D. L.; Caffrey T. C.; Hollingsworth M. A. Contribution of the MUC1 tandem repeat and cytoplasmic tail to invasive and metastatic properties of a pancreatic cancer cell line. Cancer Res. 2003, 63 (16), 5011–20. [PubMed] [Google Scholar]
- McDermott K. M.; Crocker P. R.; Harris A.; Burdick M. D.; Hinoda Y.; Hayashi T.; Imai K.; Hollingsworth M. A. Overexpression of MUC1 reconfigures the binding properties of tumor cells. Int. J. Cancer 2001, 94 (6), 783–91. 10.1002/ijc.1554. [DOI] [PubMed] [Google Scholar]
- Liu X.; Caffrey T. C.; Steele M. M.; Mohr A.; Singh P. K.; Radhakrishnan P.; Kelly D. L.; Wen Y.; Hollingsworth M. A. MUC1 regulates cyclin D1 gene expression through p120 catenin and beta-catenin. Oncogenesis 2014, 3, e107. 10.1038/oncsis.2014.19. [DOI] [PMC free article] [PubMed] [Google Scholar]
- Behrens M. E.; Grandgenett P. M.; Bailey J. M.; Singh P. K.; Yi C. H.; Yu F.; Hollingsworth M. A. The reactive tumor microenvironment: MUC1 signaling directly reprograms transcription of CTGF. Oncogene 2010, 29 (42), 5667–77. 10.1038/onc.2010.327. [DOI] [PMC free article] [PubMed] [Google Scholar]
- Nguyen B. D.; Meng X.; Donovan K. J.; Shaka A. J. SOGGY: solvent-optimized double gradient spectroscopy for water suppression. A comparison with some existing techniques. J. Magn. Reson. 2007, 184 (2), 263–74. 10.1016/j.jmr.2006.10.014. [DOI] [PubMed] [Google Scholar]
- Worley B.; Powers R. MVAPACK: A Complete Data Handling Package for NMR Metabolomics. ACS Chem. Biol. 2014, 9 (5), 1138–1144. 10.1021/cb4008937. [DOI] [PMC free article] [PubMed] [Google Scholar]
- De Meyer T.; Sinnaeve D.; Van Gasse B.; Tsiporkova E.; Rietzschel E. R.; De Buyzere M. L.; Gillebert T. C.; Bekaert S.; Martins J. C.; Van Criekinge W. NMR-Based Characterization of Metabolic Alterations in Hypertension Using an Adaptive, Intelligent Binning Algorithm. Anal. Chem. 2008, 80 (10), 3783–3790. 10.1021/ac7025964. [DOI] [PubMed] [Google Scholar]
- Savorani F.; Tomasi G.; Engelsen S. B. icoshift: A versatile tool for the rapid alignment of 1D NMR spectra. J. Magn. Reson. 2010, 202 (2), 190–202. 10.1016/j.jmr.2009.11.012. [DOI] [PubMed] [Google Scholar]
- Shao J. Linear Model Selection by Cross-Validation. J. Am. Stat. Assoc. 1993, 88 (422), 486–94. 10.1080/01621459.1993.10476299. [DOI] [Google Scholar]
- Xu Q.-S.; Liang Y.-Z.; Du Y.-P. Monte Carlo cross-validation for selecting a model and estimating the prediction error in multivariate calibration. J. Chemom. 2004, 18 (2), 112–120. 10.1002/cem.858. [DOI] [Google Scholar]
- Westerhuis J. A.; Hoefsloot H. C. J.; Smit S.; Vis D. J.; Smilde A. K.; van Velzen E. J. J.; van Duijnhoven J. P. M.; van Dorsten F. A. Assessment of PLSDA cross validation. Metabolomics 2008, 4 (1), 81–89. 10.1007/s11306-007-0099-6. [DOI] [Google Scholar]
- Eriksson L.; Trygg J.; Wold S. CV-ANOVA for significance testing of PLS and OPLS models. J. Chemom. 2008, 22 (11–12), 594–600. 10.1002/cem.1187. [DOI] [Google Scholar]
- Delaglio F.; Grzesiek S.; Vuister G. W.; Zhu G.; Pfeifer J.; Bax A. NMRPipe: a multidimensional spectral processing system based on UNIX pipes. J. Biomol. NMR 1995, 6 (3), 277–93. 10.1007/BF00197809. [DOI] [PubMed] [Google Scholar]
- Johnson B. A. Using NMRView to visualize and analyze the NMR spectra of macromolecules. Methods in molecular biology 2004, 278, 313–52. 10.1385/1-59259-809-9:313. [DOI] [PubMed] [Google Scholar]
- Wishart D. S.; Jewison T.; Guo A. C.; Wilson M.; Knox C.; Liu Y.; Djoumbou Y.; Mandal R.; Aziat F.; Dong E.; Bouatra S.; Sinelnikov I.; Arndt D.; Xia J.; Liu P.; Yallou F.; Bjorndahl T.; Perez-Pineiro R.; Eisner R.; Allen F.; Neveu V.; Greiner R.; Scalbert A. HMDB 3.0--The Human Metabolome Database in 2013. Nucleic Acids Res. 2013, 41 (D1), D801–7. 10.1093/nar/gks1065. [DOI] [PMC free article] [PubMed] [Google Scholar]
- Akiyama K.; Chikayama E.; Yuasa H.; Shimada Y.; Tohge T.; Shinozaki K.; Hirai M. Y.; Sakurai T.; Kikuchi J.; Saito K. PRIMe: a Web site that assembles tools for metabolomics and transcriptomics. In Silico Biol. 2008, 8 (3–4), 339–45. [PubMed] [Google Scholar]
- Cui Q.; Lewis I. A.; Hegeman A. D.; Anderson M. E.; Li J.; Schulte C. F.; Westler W. M.; Eghbalnia H. R.; Sussman M. R.; Markley J. L. Metabolite identification via the Madison Metabolomics Consortium Database. Nat. Biotechnol. 2008, 26 (2), 162–4. 10.1038/nbt0208-162. [DOI] [PubMed] [Google Scholar]
- Shukla S. K.; Gebregiworgis T.; Purohit V.; Chaika N. V.; Gunda V.; Radhakrishnan P.; Mehla K.; Pipinos I. I.; Powers R.; Yu F.; et al. Metabolic Reprogramming Induced by Ketone Bodies Diminishes Pancreatic Cancer Cachexia. Cancer and Metabolism 2014, 2, 18. 10.1186/2049-3002-2-18. [DOI] [PMC free article] [PubMed] [Google Scholar]
- Shukla S. K.; Dasgupta A.; Mehla K.; Gunda V.; Vernucci E.; Souchek J.; Goode G.; King R.; Mishra A.; Rai I.; Nagarajan S.; Chaika N. V.; Yu F.; Singh P. K. Silibinin-mediated metabolic reprogramming attenuates pancreatic cancer-induced cachexia and tumor growth. Oncotarget 2015, 6 (38), 41146–41161. 10.18632/oncotarget.5843. [DOI] [PMC free article] [PubMed] [Google Scholar]
- Navratilova J.; Hankeova T.; Benes P.; Smarda J. Low-glucose conditions of tumor microenvironment enhance cytotoxicity of tetrathiomolybdate to neuroblastoma cells. Nutr. Cancer 2013, 65 (5), 702–10. 10.1080/01635581.2013.789118. [DOI] [PubMed] [Google Scholar]
- Cohen R.; Neuzillet C.; Tijeras-Raballand A.; Faivre S.; de Gramont A.; Raymond E. Targeting cancer cell metabolism in pancreatic adenocarcinoma. Oncotarget 2015, 6 (19), 16832–47. 10.18632/oncotarget.4160. [DOI] [PMC free article] [PubMed] [Google Scholar]
- Worley B.; Halouska S.; Powers R. Utilities for quantifying separation in PCA/PLS-DA scores plots. Anal. Biochem. 2013, 433 (2), 102–4. 10.1016/j.ab.2012.10.011. [DOI] [PMC free article] [PubMed] [Google Scholar]
- Sellers K.; Fox M. P.; Bousamra M. 2nd; Slone S. P.; Higashi R. M.; Miller D. M.; Wang Y.; Yan J.; Yuneva M. O.; Deshpande R.; Lane A. N.; Fan T. W. Pyruvate carboxylase is critical for non-small-cell lung cancer proliferation. J. Clin. Invest. 2015, 125 (2), 687–98. 10.1172/JCI72873. [DOI] [PMC free article] [PubMed] [Google Scholar]
- Huang M.; Graves L. M. De novo synthesis of pyrimidine nucleotides; emerging interfaces with signal transduction pathways. Cell. Mol. Life Sci. 2003, 60 (2), 321–36. 10.1007/s000180300027. [DOI] [PMC free article] [PubMed] [Google Scholar]
- Lane A. N.; Fan T. W. M. Regulation of mammalian nucleotide metabolism and biosynthesis. Nucleic Acids Res. 2015, 43 (4), 2466–2485. 10.1093/nar/gkv047. [DOI] [PMC free article] [PubMed] [Google Scholar]
- Collins K.; Jacks T.; Pavletich N. P. The cell cycle and cancer. Proc. Natl. Acad. Sci. U. S. A. 1997, 94 (7), 2776–8. 10.1073/pnas.94.7.2776. [DOI] [PMC free article] [PubMed] [Google Scholar]
- Wenger C. R.; Clark G. M. S-phase fraction and breast cancer--a decade of experience. Breast Cancer Res. Treat. 1998, 51 (3), 255–65. 10.1023/A:1006188512927. [DOI] [PubMed] [Google Scholar]
- Chassevent A.; Jourdan M. L.; Romain S.; Descotes F.; Colonna M.; Martin P. M.; Bolla M.; Spyratos F. S-phase fraction and DNA ploidy in 633 T1T2 breast cancers: a standardized flow cytometric study. Clin. Cancer Res. 2001, 7 (4), 909–17. [PubMed] [Google Scholar]
- Kaaijk P.; Kaspers G. J.; Van Wering E. R.; Broekema G. J.; Loonen A. H.; Hahlen K.; Schmiegelow K.; Janka-Schaub G. E.; Henze G.; Creutzig U.; Veerman A. J. Cell proliferation is related to in vitro drug resistance in childhood acute leukaemia. Br. J. Cancer 2003, 88 (5), 775–81. 10.1038/sj.bjc.6600787. [DOI] [PMC free article] [PubMed] [Google Scholar]
- Foster D. A.; Yellen P.; Xu L.; Saqcena M. Regulation of G1 cell cycle progression: distinguishing the restriction point from a nutrient-sensing cell growth checkpoint(s). Genes Cancer 2010, 1 (11), 1124–1131. 10.1177/1947601910392989. [DOI] [PMC free article] [PubMed] [Google Scholar]
Associated Data
This section collects any data citations, data availability statements, or supplementary materials included in this article.