Abstract
The thymidine analogue 3′-deoxy-3′-[18F]fluorothymidine, or [18F]fluorothymidine ([18F]FLT), is used to measure tumor cell proliferation with positron emission tomography (PET) imaging technology in nuclear medicine. FLT is phosphorylated by thymidine kinase 1 (TK1) and then trapped inside cells; it is not incorporated into DNA. Imaging with 18F-radiolabeled FLT is a noninvasive technique to visualize cellular proliferation in tumors. However, it is difficult to distinguish between [18F]FLT and its metabolites by PET imaging, and quantification has not been attempted using current imaging methods. In this study, we successfully acquired in vivo 19F spectra of natural or nonradioactive 3′-deoxy-3′-fluorothymidine ([19F]FLT) and its monophosphate metabolite (FLT-MP) in a tumor xenograft mouse model using 9.4T magnetic resonance imaging (MRI). This preliminary result demonstrates that 19F magnetic resonance spectroscopy (MRS) with FLT is suitable for the in vivo assessment of tumor aggressiveness and for early prediction of treatment response.
1. Introduction
Tumor cell proliferation is a useful prognostic indicator of tumor aggressiveness, and proliferation may be evaluated to monitor and predict the response to antitumor therapy. Tumor cells and tissues with a high proliferation rate require a high rate of DNA synthesis [1–5]. Radiolabeled thymidine analogues are standard biomarkers for DNA synthesis and are generally used in nuclear medicine. One thymidine analogue, [11C]-labeled thymidine, is well known as a radiotracer for positron emission tomography (PET) studies of tumor cell proliferation and DNA synthesis [6–9]. However, the short physical half-life (20 min) of [11C]-thymidine and its rapid biodegradation are practical limitations to its use [4, 10]. Consequently, the use of [18F]-labeled 3′-deoxy-3′-fluorothymidine ([18F]FLT) PET imaging to assess proliferation in various tumors has been reported in preclinical and clinical studies [11–13]. [18F]FLT in the cell is phosphorylated by the enzyme thymidine kinase 1 (TK1), producing [18F]FLT monophosphate ([18F]FLT-MP). [18F]FLT-MP can then be sequentially phosphorylated to form [18F]FLT diphosphate ([18F]FLT-DP) and [18F]FLT triphosphate ([18F]FLT-TP), which are metabolically trapped inside cells and are not incorporated into DNA (Figure 1) [14]. Li et al. demonstrated that metabolites of intracellular FLT during in vitro cell growth could be accurately measured with a liquid chromatography-tandem mass spectrometry (LC-MS/MS) assay [15]. However, this technique is considered a restrictive method, which is only used for in vitro drug screening at early stages.
Figure 1.
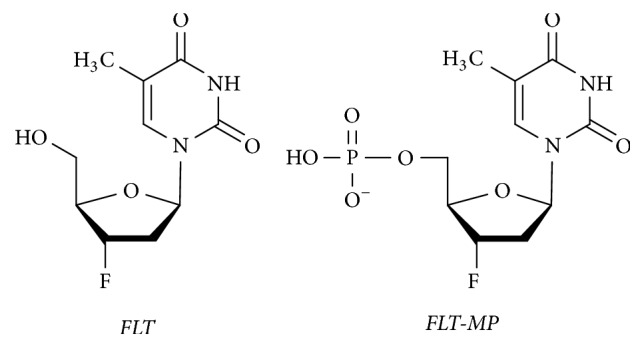
Chemical structures of FLT and FLT-MP.
19F magnetic resonance imaging (19F MRI) and spectroscopy (MRS) represent a promising in vivo quantitative imaging technique [16–18]. The nonradioactive isotope 19F has a 100% natural abundance with 83% sensitivity of 1H. The negligible background signal of endogenous 19F in biological systems provides an extremely high signal-to-nose ratio and exceptional sensitivity, making 19F MRI/MRS an ideal modality to monitor in vivo biochemical changes, in specific enzyme activity, cell tracking and migration, hypoxia, and quantitative neovascular responses [19, 20].
In this study, we monitored TK1 activity by quantifying FLT and FLT-MP in vivo using 19F MRI/MRS. Our aim was to develop and validate a suitable 19F MRI/MRS imaging biomarker for cellular proliferation in tumors.
2. Results and Discussion
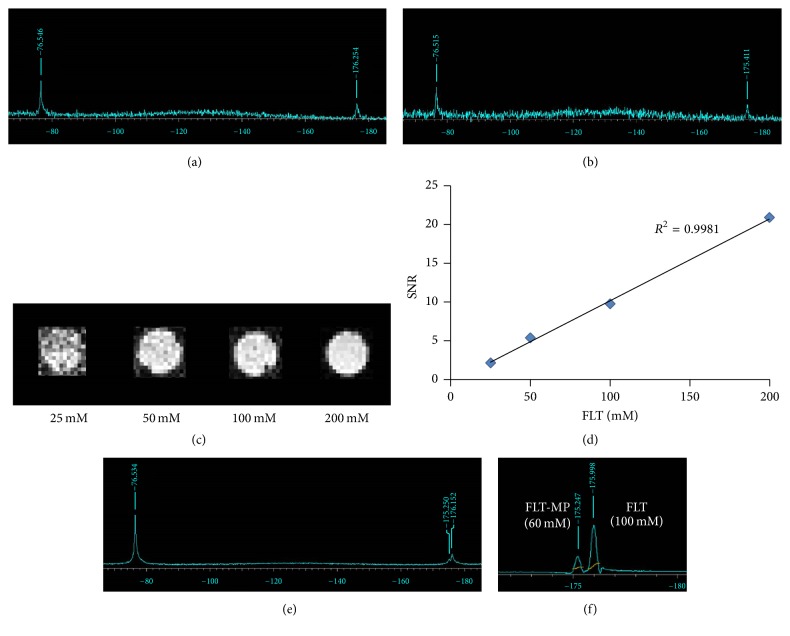
To detect the locations of FLT and FLT-MP, we investigated the 19F MRS of compounds containing TFA (−76.5 ppm) as a reference material. Figures 2(a) and 2(b) show that the spectra of FLT and FLT-MP were observed at −176.2 ppm and −175.4 ppm, respectively; the values were consistent with the NMR data (Figures S1 and S2, in Supplementary Material available online at https://doi.org/10.1155/2017/3981358). Figure 2(c) shows 19F MR images of phantoms containing 25, 50, 100, and 200 mM of FLT, demonstrating that the signal intensity of 19F MR images corresponded with FLT concentration in phantoms (Figure 2(d)). Figure 2(e) shows the spectrum of a mixture of FLT and FLT-MP, which were well separated at −176.2 ppm and −175.2 ppm, respectively. Figure 2(f) shows the 19F MRS of the mixture; here, the former was FLT-MP and the latter was FLT. Because the area ratios of the spectra for the former and latter were approximately 60 and 100, respectively, the findings were consistent with the concentrations in the mixture of FLT-MP (60 mM) and FLT (100 mM).
Figure 2.
Typical coil-localized 19F spectra of (a) FLT and (b) FLT-MP containing TFA as a reference. (c) 19F MR images of phantoms containing 25, 50, 100, and 200 mM FLT. (d) Signal intensity in 19F MR images of FLT phantoms, as a function of FLT concentration (R2 = 0.998). (e) Typical coil-localized 19F spectrum of a phantom containing a mixture of FLT (100 mM) and FLT-MP (60 mM). (f) 19F MRS spectrum of a phantom containing a mixture of FLT (100 mM) and FLT-MP (60 mM). The area ratio of FLT (100 mM) to FLT-MP (60 mM) is approximately 100 to 60.
We investigated whether the 19F NMR or 19F MRS signal of intracellular FLT-MP, produced as an FLT metabolite, could be detected in vitro. In the first group of cells that were not washed, both FLT and FLT-MP were clearly observed in the 19F NMR spectra, although the FLT-MP peak was very weak (Figure S3). However, the signal for FLT in the cells was very strong, and the concentration of FLT was 16.7 mM. In contrast, an FLT-MP peak in the first group of cells was not observed in the 19F MRS; only an FLT peak was observed (Figure S4).
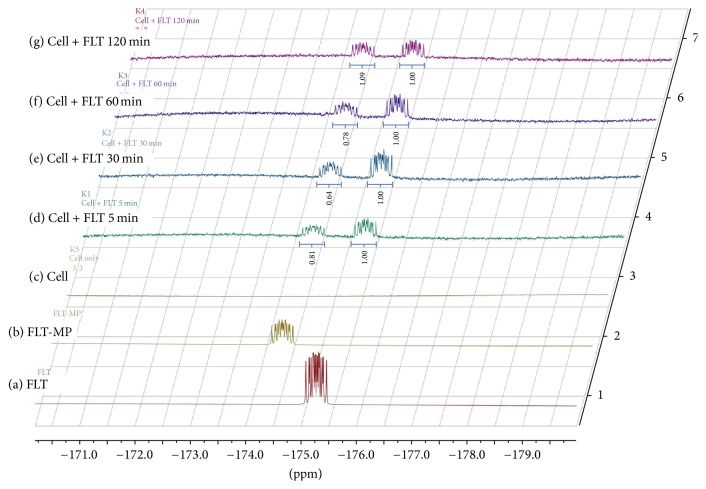
Figure 3 shows the 19F NMR spectra of washed cells in the second group as a function of time. Both intracellular FLT and FLT-MP were clearly observed at −175.2 ppm and −174.5 ppm, respectively. Because the extra FLT was washed out, the FLT signal exhibited a moderate level relative to the cells in the first group. Although the extra FLT was washed out, the presence of FLT demonstrated that FLT and its metabolites were reversible in the cell [2]. The amounts of intracellular FLT-MP and FLT were therefore inconsistent over time. A relative ratio of FLT to FLT-MP, here, demonstrated the on-going phosphorylation of different spectra in various tumors unlike PET technology.
Figure 3.
19F NMR spectra of MCF-7 cell suspensions treated with FLT (0.1 mg/1 × 107 cells) as a function of time (d–g). The quantification in a relative ratio of FLT to FLT-MP was indicated. Typical spectra of (a) FLT (−175.4 ppm), (b) FLT-MP (−174.4 ppm), and (c) MCF-7 cells without FLT addition.
No peak was observed in the 19F MRS signal for intracellular FLT-MP formed in the second group of cells because of its low concentration. These results demonstrated that a typical FLT concentration of 16.7 mM is required for in vivo detection by 19F MRS. As previous reports, in vivo 19F MR imaging is generally used for the high concentration of 89 mM due to the low sensitivity of that [21].
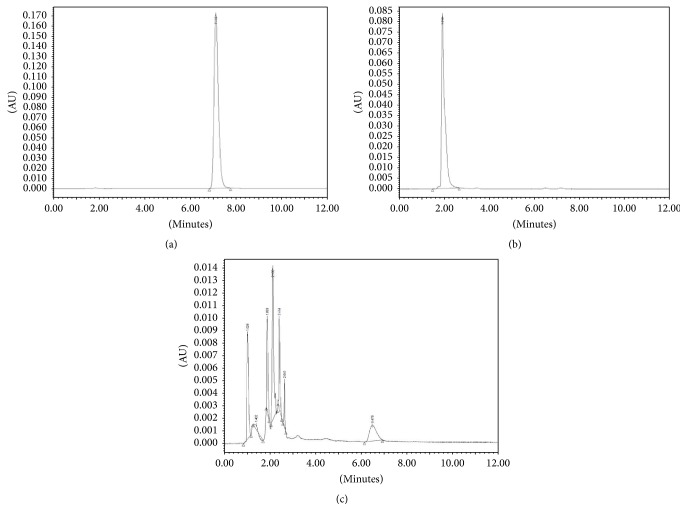
To chemically confirm the accuracy of quantitation and metabolite detection by 19F MRS, an HPLC assay was performed. Figure 4 shows HPLC chromatograms for FLT (Rt, 7.1 min) and FLT-MP (Rt, 2.0 min); the concentration was approximately 1 μg/μL. The in vitro HPLC chromatogram of the second group of cells demonstrated that FLT metabolism resulted in FLT-MP, FLT-DP, and FLT-TP production (Figure 4(c)).
Figure 4.
HPLC chromatograms of (a) FLT (Rt, 7.1 min), (b) FLT-MP (Rt, 2.0 min), and (c) MCF-7 cells treated with FLT.
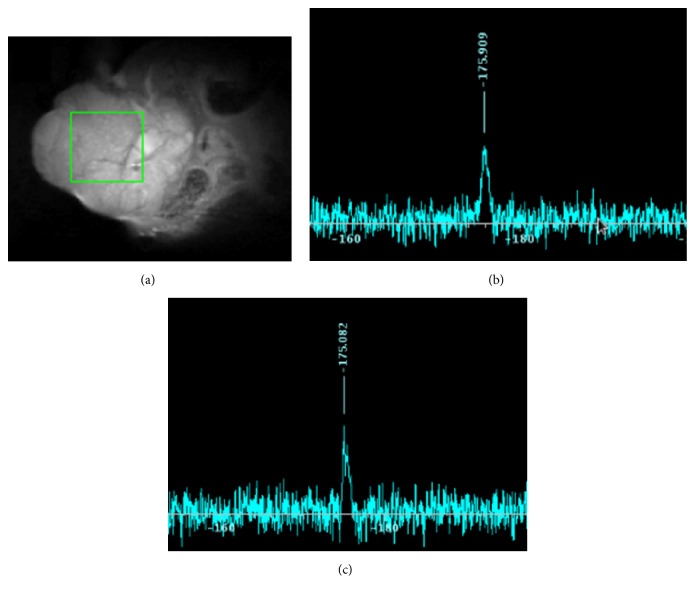
We, then, investigated the in vivo 19F MR signals for FLT and FLT-MP. More precisely, we aimed to observe that the appearance of the FLT-MP signal is caused by metabolism of FLT in vivo. Figure 5(a) shows anatomical 1H MR images of a MCF-7 tumor in a mouse and the voxel of interest in the tumor for 19F MRS. In the 25 min after injection of FLT (200 mM, 100 μL), a slight 19F signal was observed at −175.99 ppm (Figure 5(b)), corresponding with the location of FLT. After 90 min, the 19F signal was observed at −175.08 ppm (Figure 5(c)). Judging from the results of the phantom study, this signal represented FLT-MP despite being very weak.
Figure 5.
In vivo 19F MR spectrum in a mouse tumor model. FLT (200 mM, 100 μL) was injected into tail veins. (a) Anatomical 1H MR images of the mouse were obtained using fast spin echo sequence with the voxel of interest in the tumor (5 × 5 × 5 mm3). Time-course of 19F MR spectra at (b) 25 min after injection (a.i.) (−175.9 ppm) and (c) 90 min a.i. (−175.08 ppm). 19F MRS data were acquired with Point-REsolved Spectroscopy (PRESS) using TR 3000 ms, TE 15 ms, averages 512, scan time 25 min.
Experimentally speaking, it was very difficult to accurately perform chemical shift imaging (CSI) of FLT and FLT-MP. Our studies, however, first detected a remarkable 19F MR signal in the tumors of living mice, thereby observing the metabolism of FLT by 19F MRS in vivo. Understanding the metabolism of FLT in a tumor-bearing mouse model may help us associate metabolism with PET data from [18F]FLT, a commonly used radiopharmaceutical in nuclear medicine; [18F]FLT is a good tracer of cell proliferation for assessment of tumor aggressiveness and early prediction of treatment response [12]. PET technology, high sensitivity, and the radiation of positron-emitting radioisotopes can easily permeate tissues, making PET a powerful molecular imaging modality to monitor the progression of cancer [22]. However, PET alone cannot readily distinguish between [18F]FLT and [18F]FLT-MP. Specifically, it is very difficult to simultaneously identify metabolites in vivo by kinetic analysis of FLT-PET images [8]. In that respect, our results show that 19F MRS is a noninvasive and practical way to identify biomolecules in vivo, including fluorine atoms; it may, thus, be utilized to complement other imaging tools, such as PET.
MRI/MRS is also a promising molecular imaging method for cancer theragnostics [23, 24]. For example, 13C MRI/MRS study of hyperpolarized [13C]pyruvate and its metabolite ([13C]lactate) could be recently used to measure early responses to therapy, and the utilization of metabolite levels has been studied in clinical practice [25–27]. The hyperpolarized 13C compounds, however, have restriction on the metabolism studies of DNA synthesis due to a time limit of hyperpolarization. The results of the present study, though preliminary, demonstrate that detection of [19F]FLT and its metabolite using 19F MRS might provide a novel avenue for cancer theragnostics.
3. Conclusion
In this study, FLT and its metabolite were measured for the first time in an in vivo mouse model using 19F MRS. This result showed that 19F MRS is suitable for the purpose of in vivo monitoring of specific drugs including radiopharmaceuticals and their metabolites. In addition, the findings of this study may support the clinical use of 19F MRI/MRS for the quantification and monitoring of the cellular proliferation in cancer and to assess the effectiveness of responses to therapy. Further studies are needed to improve the 19F MRS and CSI techniques for in vivo detection.
4. Materials and Methods
4.1. Chemicals
All reagents were purchased from commercial sources, and the following agents were FLT and FLT-MP (Research Center FutureChem Co., Ltd., Seoul, Korea) and trifluoroacetic acid (TFA) (Sigma-Aldrich, St. Louis, MO).
4.2. High-Performance Liquid Chromatography (HPLC)
The locations of compound were confirmed by analytical HPLC using an Atlantis C18 analytical column (5 µm, 3.0 × 150 mm) with 10% EtOH in water (v/v) as the mobile phase at a flow rate of 0.4 mL/min. The retention times (Rt) for FLT and FLT-MP were 7.1 min and 2 min, respectively.
4.3. Cell Culture
The MCF-7 human breast cancer cell line expressing the HSV-tk gene was maintained in RPMI-1640 medium supplemented with 10% FBS, 1% antibiotics, and 100 μg/mL of G418 (Invitrogen). Cultures were maintained in a 37°C incubator with 5% CO2, and the medium was changed every 3 days.
For 19F MRS, MCF-7 cells were plated, and 5 × 10⁷ cells were suspended in 500 μL of serum-free RPMI medium containing FLT (16.7 mM) before being incubated at 37°C for different time periods (5 min, 30 min, 60 min, and 120 min). The cells were divided into two groups. The first group of cells was not washed and was used for 19F NMR and 19F MRS. The second group of cells was washed three times with PBS, scraped from the plate, centrifuged at 1,000 rpm for 3 min, and then collected for use in 19F NMR, 19F MRS, and HPLC analyses.
For HPLC, the pellets were resuspended in PBS to a final volume of 1 mL and were then lysed by three cycles of freezing and thawing; the lysates were centrifuged at 14,000 rpm for 5 min at 4°C. The supernatant was used for HPLC analysis.
FLT and FLT-MP were extracted from the samples after growth for 5 min, 30 min, 60 min, or 120 min by three cycles of freezing and thawing. After centrifugation (14,000 rpm for 5 min at 4°C), the samples comprising a 90 : 10 mixture of supernatant: D2O, were placed in 5 mm nuclear magnetic resonance (NMR) tubes for data acquisition.
4.4. NMR
The 19F NMR measurements were conducted at 28°C on a Bruker 400-MHz NMR spectrometer, equipped with a 5-mm BBFO probe. The experimental parameters were as follows: pulse angle, 90° (18.32 μsec); repetition rate, 1 sec; 172 K data set; 2,000 scans. All 19F data were processed using TopSpin and analyzed with MestReNova.
4.5. Animals
All animal experiments were conducted in compliance with the Guidelines for the Care and Use of Research Animals under protocols approved by the Korea Institute of Radiological and Medical Sciences (KIRAMS') Animal Studies Committee.
MCF-7 tumor cells (106 cells/mL) suspended in RPMI serum-depletion media were inoculated into the subcutaneous tissue (sc) of female BALB/c nude mice (6 weeks, 20–25 g of body mass). The mice were anesthetized with 1.5% isoflurane. To monitor the formation of FLT-MP, 1H MRI and 19F MRS were performed after intravenous bolus injections of FLT (200 mM, 100 μL).
4.6. MRI
All 1H MRI and 19F MRI/MRS data were acquired with a 9.4T animal MRI system and 20 mm surface coil (370–420 MHz) (Agilent Technologies, USA).
1H MR images were acquired with a fast spin echo sequence using the following settings: repetition time (TR) 2500 ms, echo time (TE) 25 ms, matrix 256 × 256, field of view (FOV) 5 × 5 cm2, slice thickness 2 mm, gap 0 mm, averages 2, and scan time 2 min 45 sec.
19F MR images of phantom were acquired with a gradient echo sequence using the following settings: TR 100 ms, TE 4.0 ms, matrix 64 × 64, FOV 5 × 5 cm2, slice thickness 2 mm, gap 0 mm, averages 1200, and scan time 2 h 8 min.
19F MRS of phantoms and in vivo data were acquired with Point-REsolved Spectroscopy (PRESS) using the following settings: TR 3000 ms, TE 15 ms, voxel size 5 × 5 × 5 mm3, averages 512, and scan time 25 min.
Supplementary Material
Figure S1. 19F NMR spectrum of FLT.
Figure S2. 19F NMR spectrum of FLT-MP.
Figure S3. 19F NMR spectra of MCF-7 cells treated with FLT as a function of time. The formation of the FLT-MP signal caused by metabolism of FLT was observed at -174.5 ppm.
Figure S4. 19F MRS of MCF-7 cells treated with FLT.
Acknowledgments
This research was supported by a grant of the Korea Institute of Radiological and Medical Sciences (KIRAMS) funded by the Ministry of Science, ICT & Future Planning, Republic of Korea (no. 1711045539;171104541/50461-2017).
Contributor Information
Jung Young Kim, Email: jykim@kirams.re.kr.
Ji-Ae Park, Email: jpark@kirams.re.kr.
Conflicts of Interest
The authors declare that they have no conflicts of interest.
References
- 1.Schwartz J. L., Tamura Y., Jordan R., Grierson J. R., Krohn K. A. Monitoring tumor cell proliferation by targeting DNA synthetic processes with thymidine and thymidine analogs. Journal of Nuclear Medicine. 2003;44:2027–2032. [PubMed] [Google Scholar]
- 2.Bading J. R., Shields A. F. Imaging of cell proliferation: status and prospects. Journal of Nuclear Medicine. 2008;49(supplement 2):64S–80S. doi: 10.2967/jnumed.107.046391. [DOI] [PubMed] [Google Scholar]
- 3.Hu V. W., Black G. E., Torres-Duarte A., Abramson F. P. 3H-thymidine is a defective tool with which to measure rates of DNA synthesis. The FASEB journal: official publication of the Federation of American Societies for Experimental Biology. 2002;16(11):1456–1457. doi: 10.1096/fj.02-0142fje. [DOI] [PubMed] [Google Scholar]
- 4.Nimmagadda S., Shields A. F. The role of DNA synthesis imaging in cancer in the era of targeted therapeutics. Cancer and Metastasis Reviews. 2008;27(4):575–587. doi: 10.1007/s10555-008-9148-5. [DOI] [PMC free article] [PubMed] [Google Scholar]
- 5.Kenny L. M., Aboagye E. O., Price P. M. Positron emission tomography imaging of cell proliferation in oncology. Clinical Oncology. 2004;16(3):176–185. doi: 10.1016/j.clon.2003.10.009. [DOI] [PubMed] [Google Scholar]
- 6.Christman D., Crawford E. J., Friedkin M., Wolf A. P. Detection of DNA Synthesis in Intact Organisms with Positron-Emitting [Methyl-11C]Thymidine. Proceedings of the National Academy of Sciences of the United States of America. 1972;69(4):988–992. doi: 10.1073/pnas.69.4.988. [DOI] [PMC free article] [PubMed] [Google Scholar]
- 7.Tahara T., Zhang Z., Ohno M., et al. A novel 11C-labeled thymidine analog, [11C]AZT, for tumor imaging by positron emission tomography. EJNMMI Research. 2015;5(1) 124 doi: 10.1186/s13550-015-0124-0. [DOI] [PMC free article] [PubMed] [Google Scholar]
- 8.Mankoff D. A., Shields A. F., Link J. M., et al. Kinetic analysis of 2-[11C]thymidine PET imaging studies: Validation studies. Journal of Nuclear Medicine. 1999;40(4):614–624. [PubMed] [Google Scholar]
- 9.Toyohara J., Okada M., Toramatsu C., Suzuki K., Irie T. Feasibility studies of 4′-[methyl-11C]thiothymidine as a tumor proliferation imaging agent in mice. Nuclear Medicine and Biology. 2008;35(1):67–74. doi: 10.1016/j.nucmedbio.2007.10.001. [DOI] [PubMed] [Google Scholar]
- 10.Mankoff D. A., Shields A. F., Graham M. M., Link J. M., Eary J. F., Krohn K. A. Kinetic analysis of 2-[carbon-11]thymidine PET imaging studies: Compartmental model and mathematical analysis. Journal of Nuclear Medicine. 1998;39(6):1043–1055. [PubMed] [Google Scholar]
- 11.Shields A. F. PET imaging with 18F-FLT and thymidine analogs: promise and pitfalls. The Journal of Nuclear Medicine. 2003;44(9):1432–1434. [PubMed] [Google Scholar]
- 12.Chen W., Cloughesy T., Kamdar N., et al. Imaging proliferation in brain tumors with 18F-FLT PET: comparison with 18F-FDG. Journal of Nuclear Medicine. 2005;46(6):945–952. [PubMed] [Google Scholar]
- 13.Shields A. F., Grierson J. R., Dohmen B. M., et al. Imaging proliferation in vivo with [F-18]FLT and positron emission tomography. Nature Medicine. 1998;4(11):1334–1336. doi: 10.1038/3337. [DOI] [PubMed] [Google Scholar]
- 14.McKinley E. T., Ayers G. D., Smith R. A., et al. Limits of [18F]-FLT PET as a Biomarker of Proliferation in Oncology. PLoS ONE. 2013;8(3) doi: 10.1371/journal.pone.0058938.e58938 [DOI] [PMC free article] [PubMed] [Google Scholar]
- 15.Li W., Araya M., Elliott M., et al. Monitoring cellular accumulation of 3-deoxy-3-fluorothymidine (FLT) and its monophosphate metabolite (FLT-MP) by LC-MS/MS as a measure of cell proliferation in vitro. Journal of Chromatography B: Analytical Technologies in the Biomedical and Life Sciences. 2011;879(28):2963–2970. doi: 10.1016/j.jchromb.2011.08.024. [DOI] [PubMed] [Google Scholar]
- 16.Ruiz-Cabello J., Barnett B. P., Bottomley P. A., Bulte J. W. M. Fluorine (19F) MRS and MRI in biomedicine. NMR in Biomedicine. 2011;24(2):114–129. doi: 10.1002/nbm.1570. [DOI] [PMC free article] [PubMed] [Google Scholar]
- 17.van Heeswijk R. B., Pilloud Y., Flögel U., Schwitter J., Stuber M. Fluorine-19 magnetic resonance angiography of the mouse. PLoS ONE. 2012;7(7) doi: 10.1371/journal.pone.0042236.e42236 [DOI] [PMC free article] [PubMed] [Google Scholar]
- 18.Tirotta I., Dichiarante V., Pigliacelli C., et al. (19)F magnetic resonance imaging (MRI): from design of materials to clinical applications. Chemical Reviews. 2015;115(2):1106–1129. doi: 10.1021/cr500286d. [DOI] [PubMed] [Google Scholar]
- 19.Yue X., Wang Z., Zhu L., et al. Novel 19F activatable probe for the detection of matrix metalloprotease-2 activity by MRI/MRS. Molecular Pharmaceutics. 2014;11(11):4208–4217. doi: 10.1021/mp500443x. [DOI] [PMC free article] [PubMed] [Google Scholar]
- 20.Gonzales C., Yoshihara H. A. I., Dilek N., et al. In-vivo detection and tracking of T cells in various organs in a melanoma tumor model by 19F-fluorine MRS/MRI. PLoS ONE. 2016;11(10) doi: 10.1371/journal.pone.0164557.e0164557 [DOI] [PMC free article] [PubMed] [Google Scholar]
- 21.Yu W., Yang Y., Bo S., et al. Design and Synthesis of Fluorinated Dendrimers for Sensitive 19F MRI. Journal of Organic Chemistry. 2015;80(9):4443–4449. doi: 10.1021/acs.joc.5b00294. [DOI] [PubMed] [Google Scholar]
- 22.Krohn K. A., Mankoff D. A., Eary J. F. Imaging cellular proliferation as a measure of response to therapy. Journal of Clinical Pharmacology. 2001;41(suppl):96S–103S. doi: 10.1177/00912700122012977. [DOI] [PubMed] [Google Scholar]
- 23.Caravan P. Strategies for increasing the sensitivity of gadolinium based MRI contrast agents. Chemical Society Reviews. 2006;35(6):512–523. doi: 10.1039/b510982p. [DOI] [PubMed] [Google Scholar]
- 24.Negendank W. Studies of human tumors by MRS: A review. NMR in Biomedicine. 1992;5(5):303–324. doi: 10.1002/nbm.1940050518. [DOI] [PubMed] [Google Scholar]
- 25.Albers M. J., Bok R., Chen A. P., et al. Hyperpolarized 13C lactate, pyruvate, and alanine: Noninvasive biomarkers for prostate cancer detection and grading. Cancer Research. 2008;68(20):8607–8615. doi: 10.1158/0008-5472.CAN-08-0749. [DOI] [PMC free article] [PubMed] [Google Scholar]
- 26.MacKenzie J. D., Yen Y.-F., Mayer D., Tropp J. S., Hurd R. E., Spielman D. M. Detection of inflammatory arthritis by using hyperpolarized 13C-pyruvate with MR imaging and spectroscopy. Radiology. 2011;259(2):414–420. doi: 10.1148/radiol.10101921. [DOI] [PMC free article] [PubMed] [Google Scholar]
- 27.Keshari K. R., Wilson D. M. Chemistry and biochemistry of 13C hyperpolarized magnetic resonance using dynamic nuclear polarization. Chemical Society Reviews. 2014;43(5):1627–1659. doi: 10.1039/c3cs60124b. [DOI] [PMC free article] [PubMed] [Google Scholar]
Associated Data
This section collects any data citations, data availability statements, or supplementary materials included in this article.
Supplementary Materials
Figure S1. 19F NMR spectrum of FLT.
Figure S2. 19F NMR spectrum of FLT-MP.
Figure S3. 19F NMR spectra of MCF-7 cells treated with FLT as a function of time. The formation of the FLT-MP signal caused by metabolism of FLT was observed at -174.5 ppm.
Figure S4. 19F MRS of MCF-7 cells treated with FLT.


